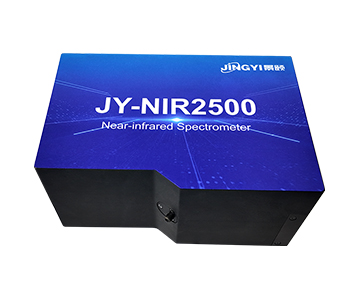
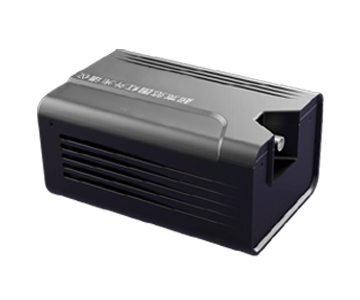
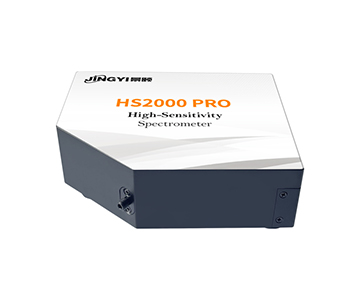
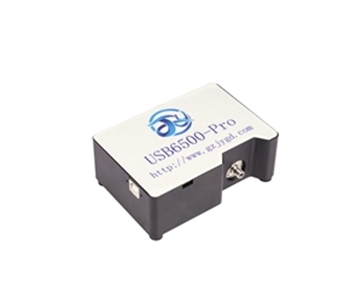
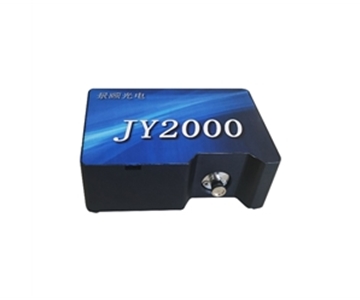
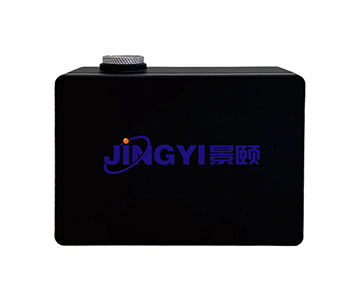
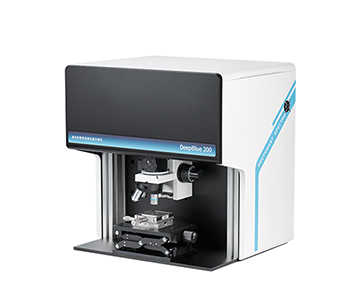
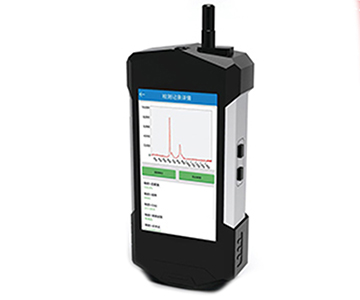
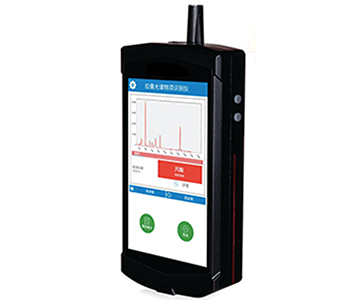
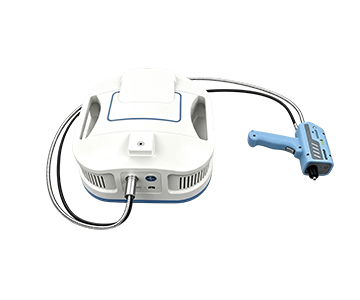
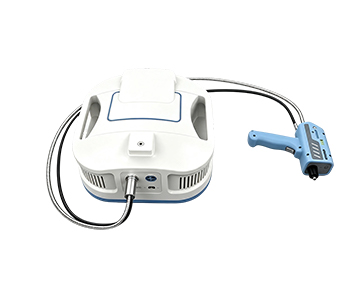
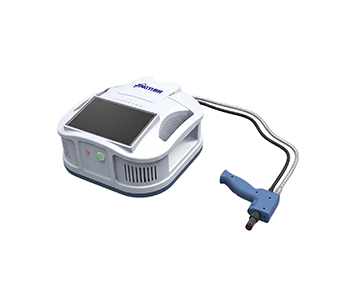
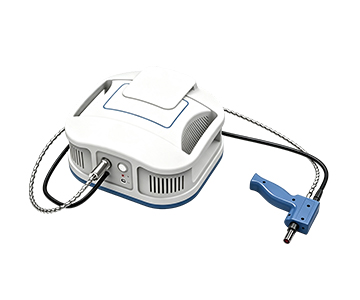
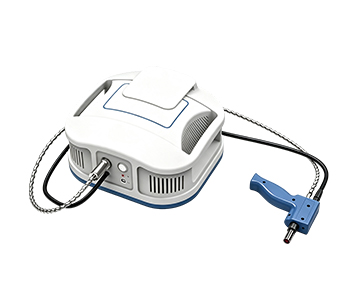
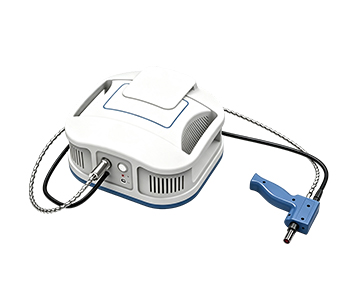
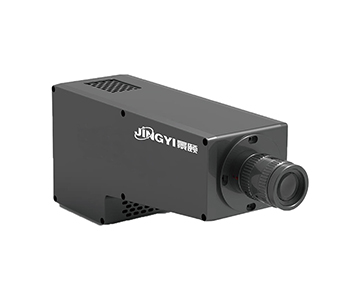
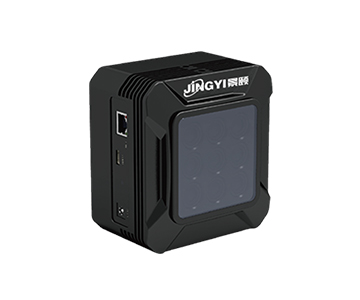
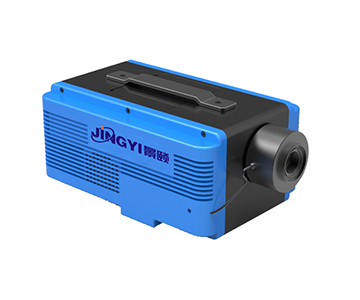
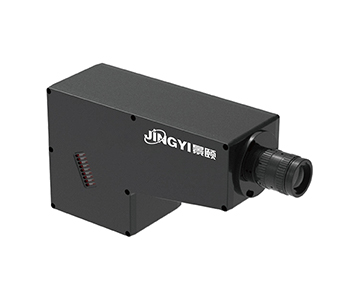
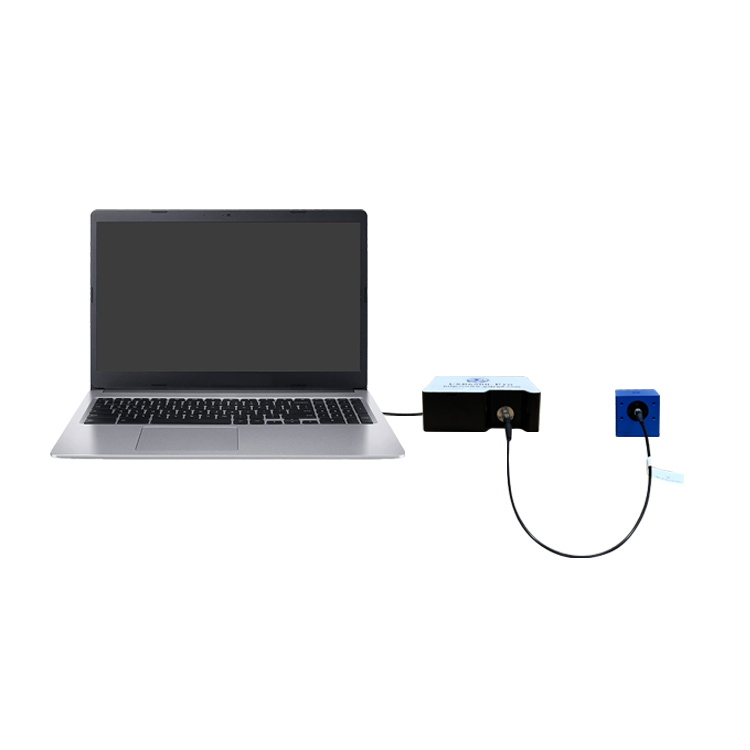
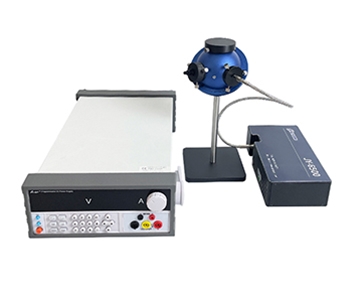
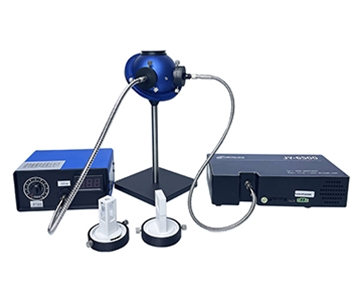
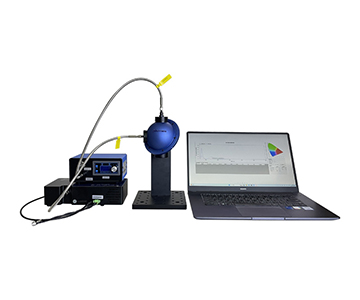
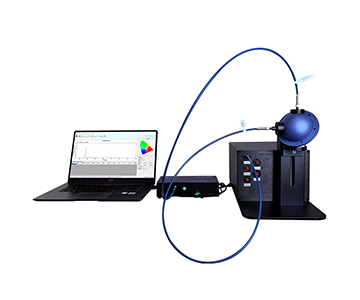
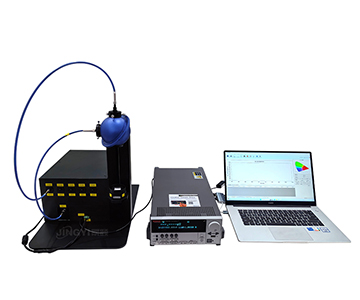
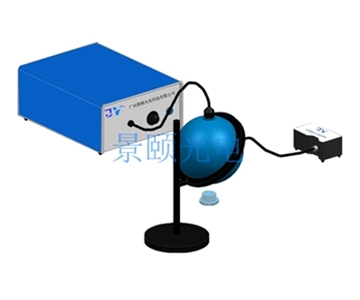
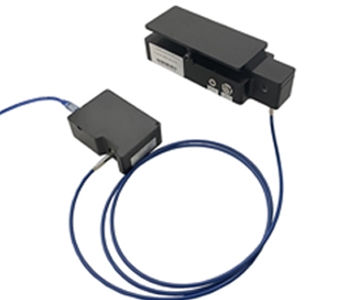
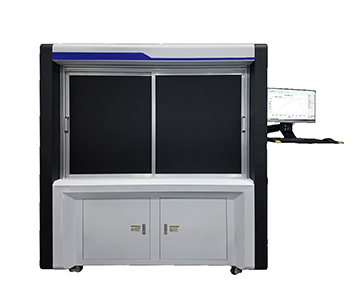
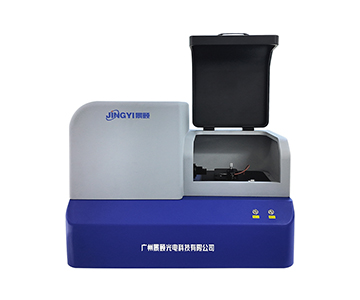
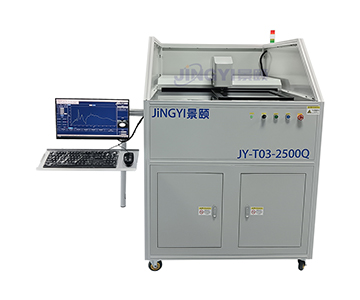
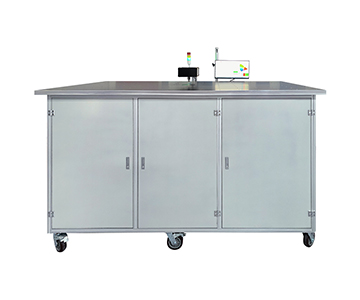
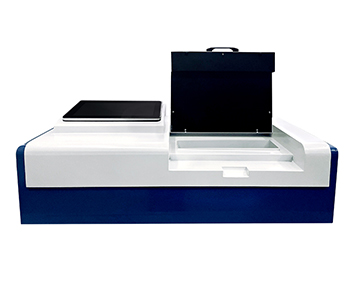
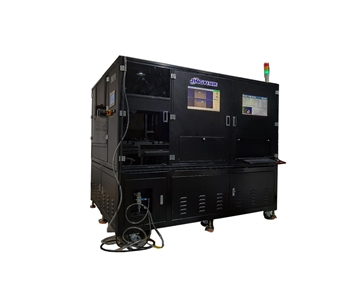
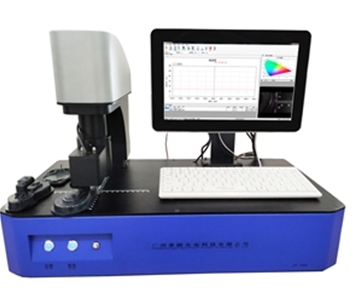
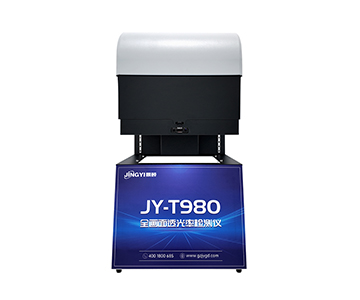
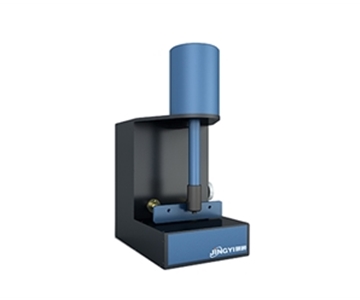
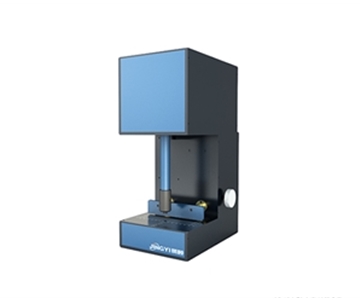
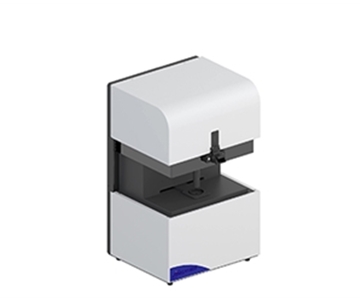
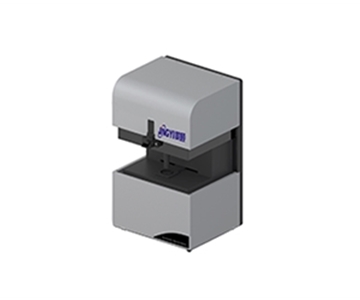
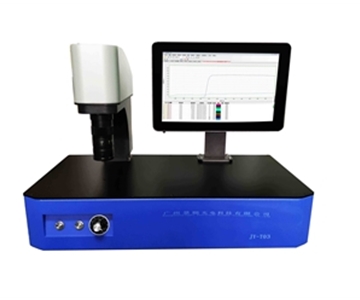
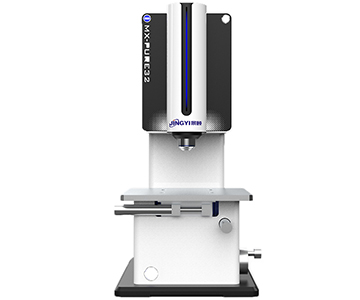
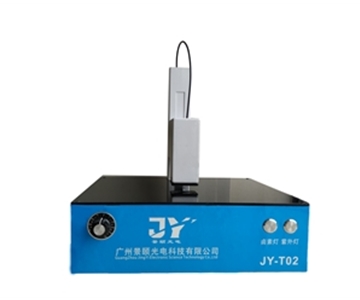
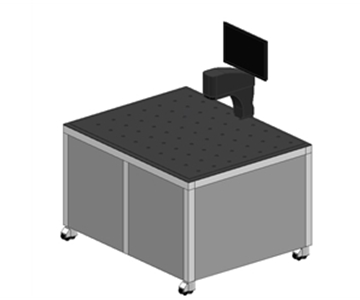
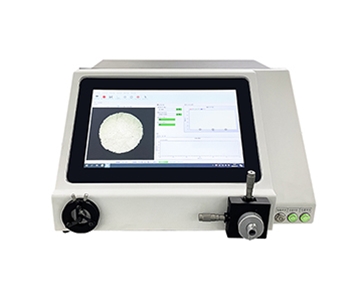
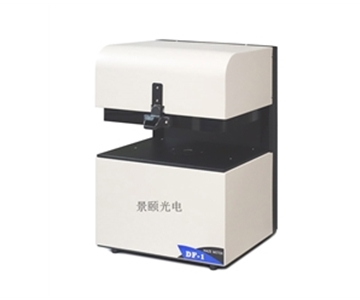
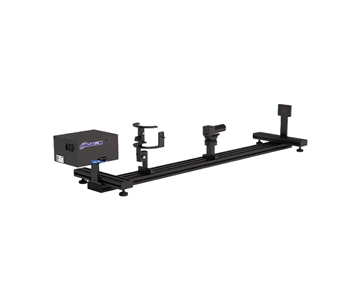
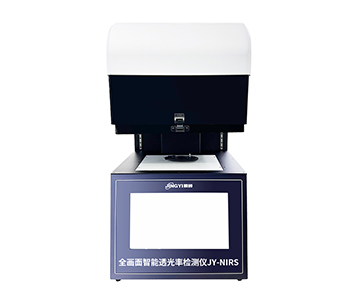
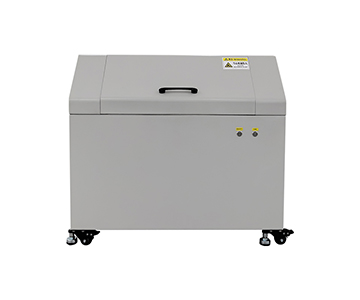
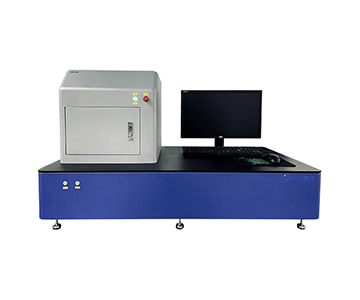
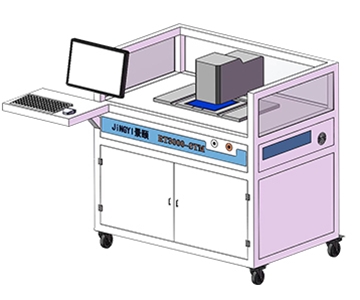
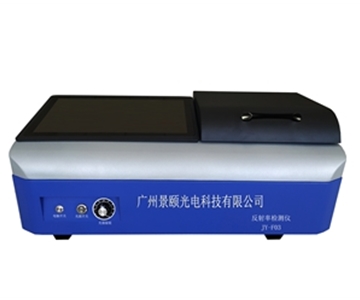
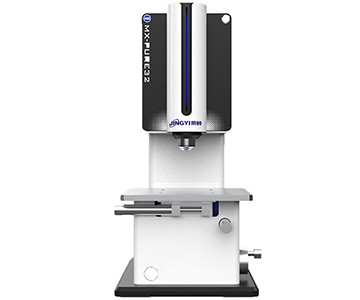
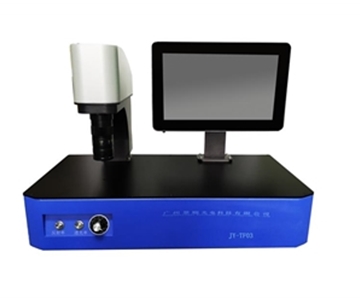
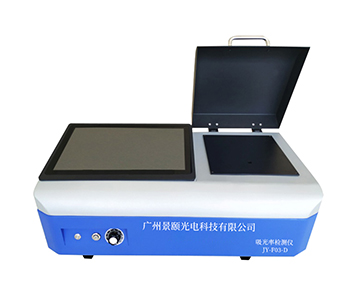
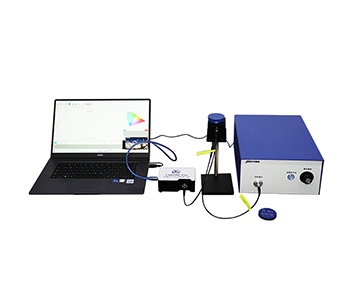
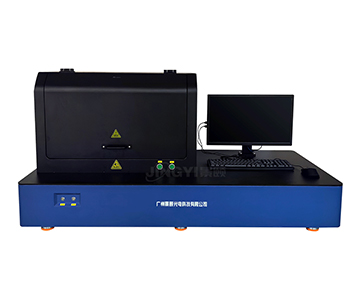
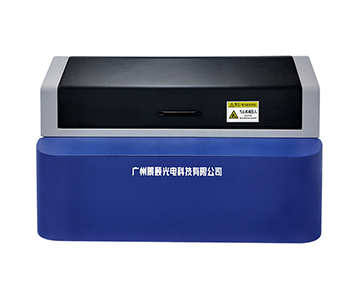
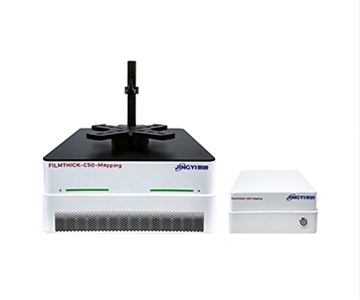
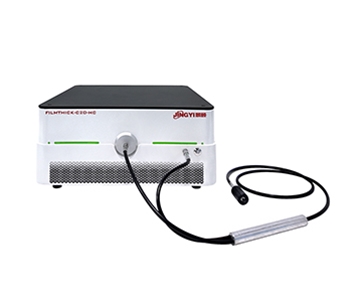
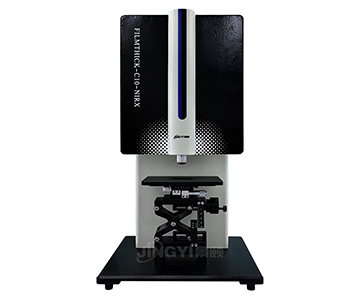
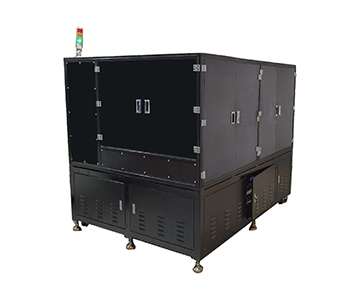
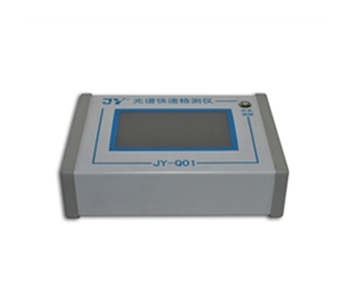
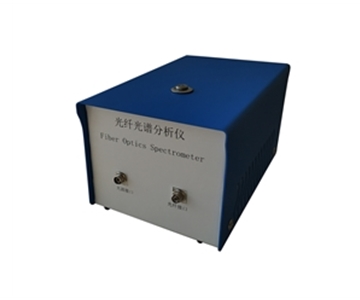
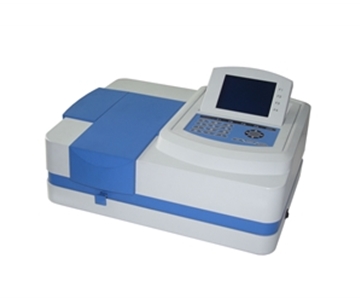
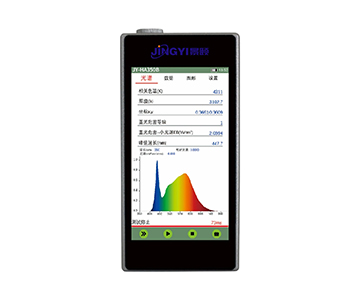
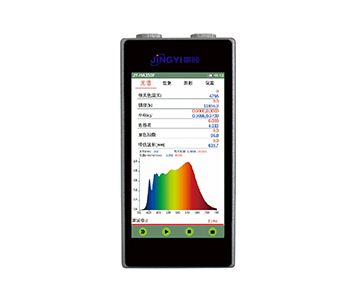
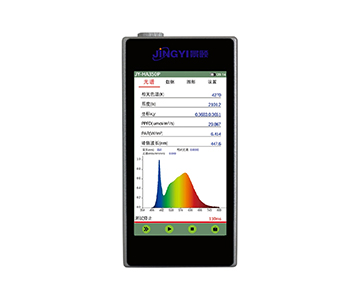
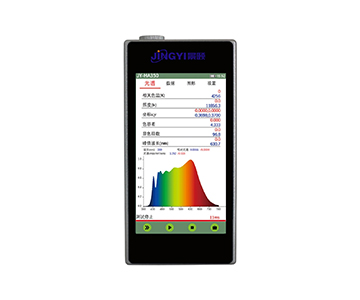
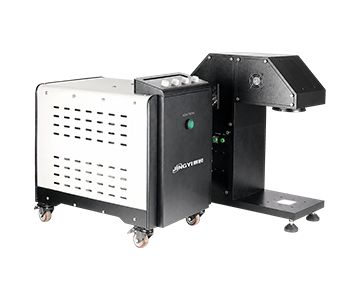
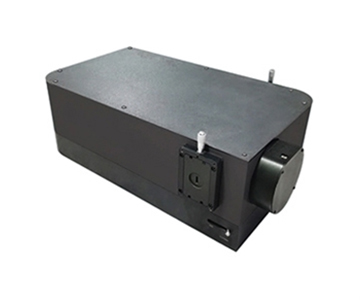
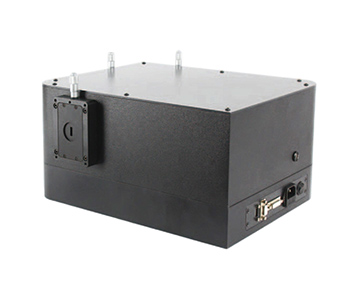
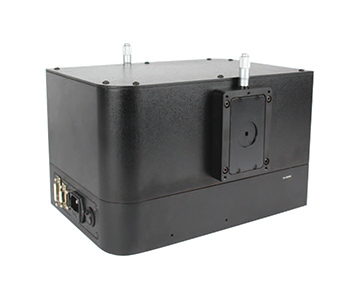
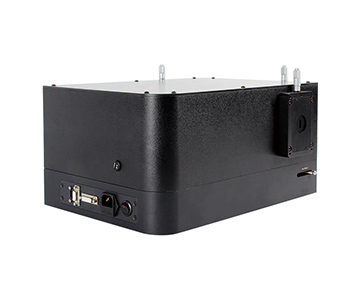
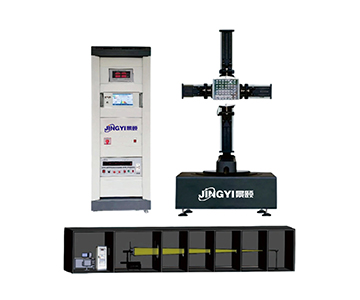
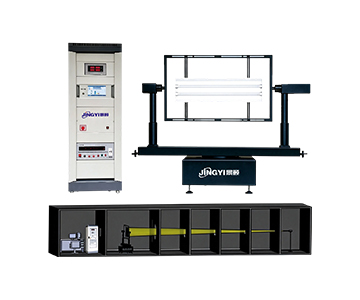
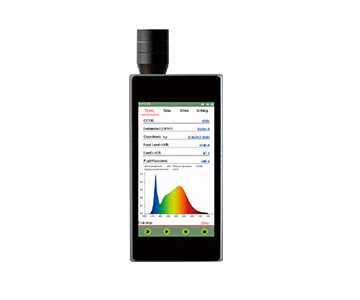
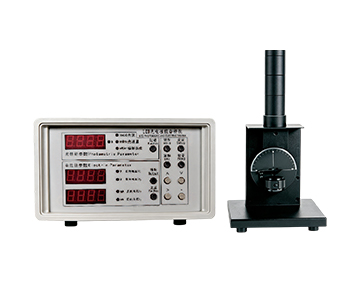
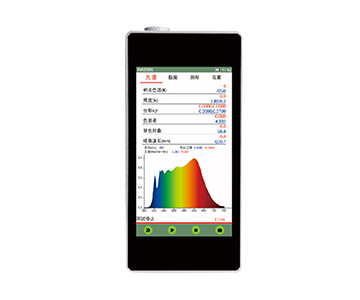
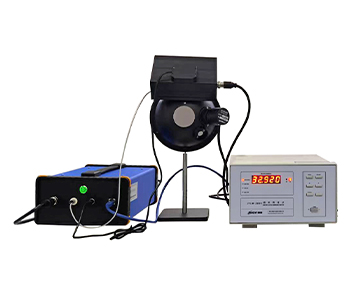
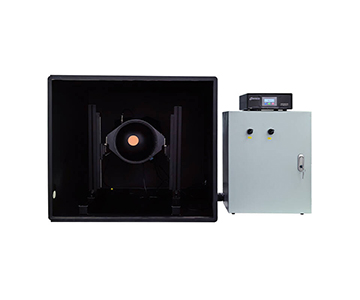
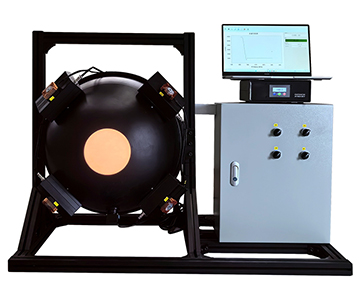
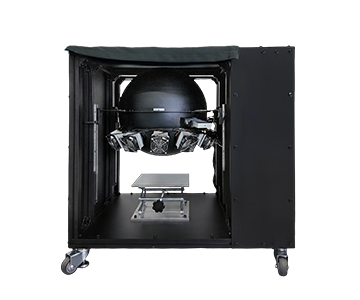
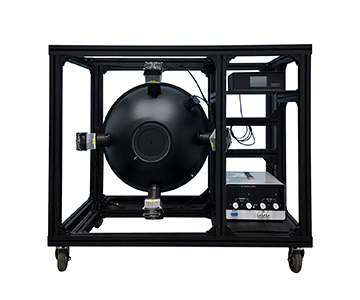
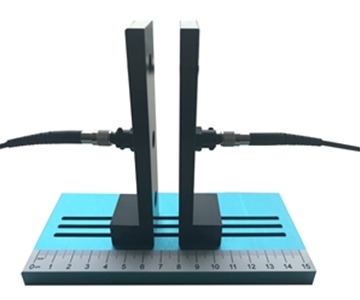
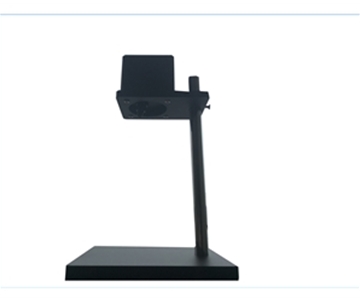
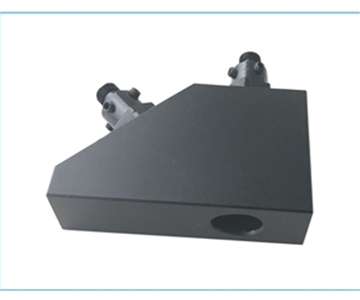
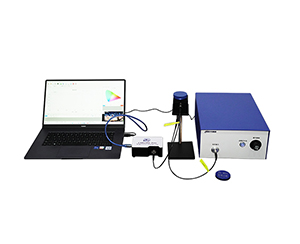
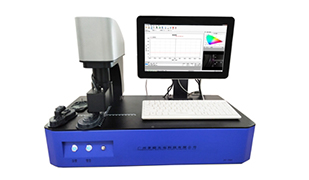
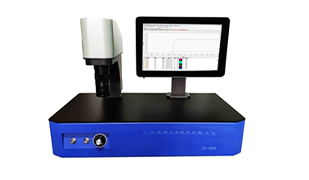
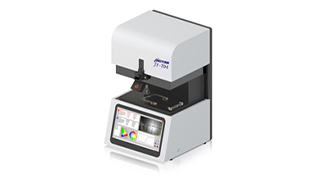
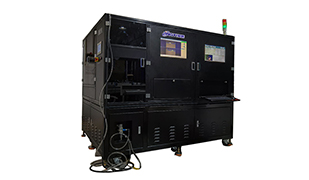
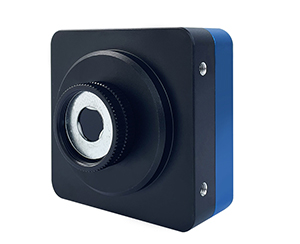
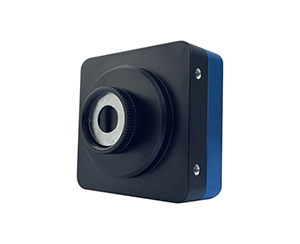
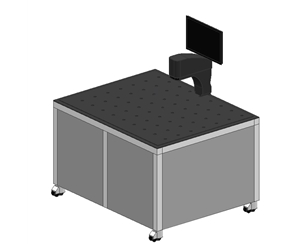
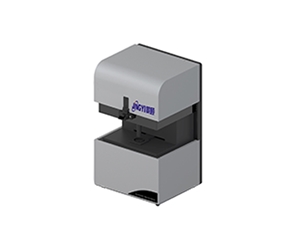
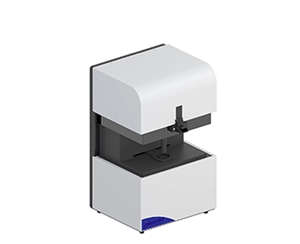
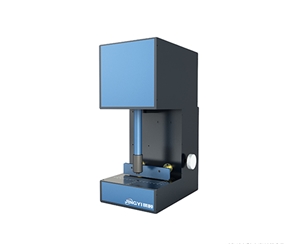
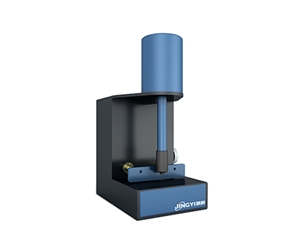
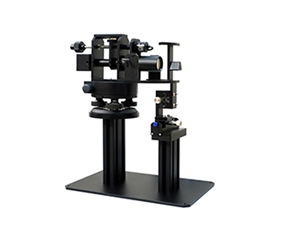
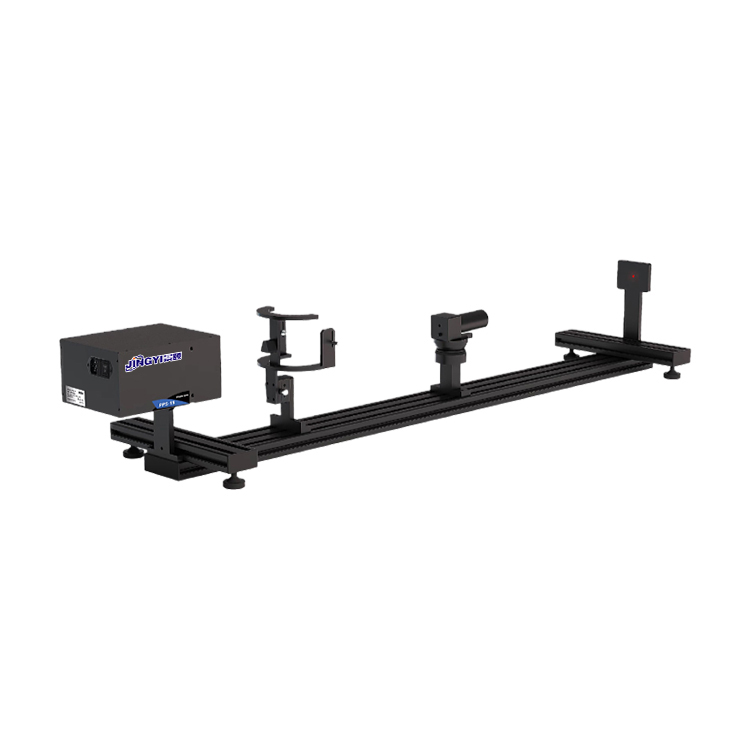
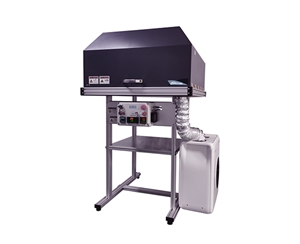
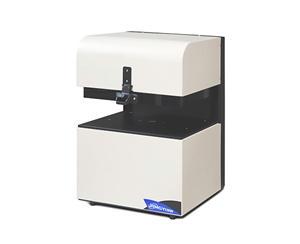
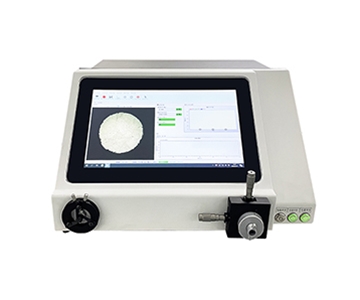
Automated laser wavelength measurement systems deliver millisecond-level spectral acquisition with 0.1 nm wavelength resolution, replacing manual sampling and laboratory-based scan spectrometers in high-volume photonics manufacturing. By integrating a PTFE integrating sphere, fiber-coupled spectrometer, and onboard analytics, these instruments output peak wavelength, FWHM, and relative intensity in a single trigger. In a typical laser diode packaging facility, undetected wavelength drift of 0.5 nm can cause channel crosstalk, resulting in scrap costs exceeding $22,300 per batch. Transitioning from spot-check lab routines to inline automated verification reduces cycle time from minutes per unit to milliseconds, while固化 decision criteria in software rather than operator judgment. This guide breaks down the working principles, component architecture, and deployment scenarios of all-in-one laser wavelength detectors, referencing NIST-traceable calibration methods and SEMI standards for metrology validation.
Why Laser Manufacturing Lines Demand Automated Wavelength Verification
During a weekend qualification run at a photonic device packaging plant, the assembly line suddenly h
Traditional quality control relied on statistical sampling. A technician would carry a few samples to the lab, where a scanning monochromator swept through wavelengths point by point—a process consuming several seconds per device. By the time results returned, hundreds more units had already been processed. Measurement uncertainty compounded when human operators interpreted spectral curves visually. In optical communications, a wavelength offset causes crosstalk; in LiDAR, it degrades ranging accuracy; in industrial marking, it
What a Laser Wavelength Meter Actually Does
A laser wavelength measurement system is essentially an “eye exam” for laser light. Instead of relying on human color perception, it captures invisible spectra and prints a digital prescription containing peak wavelength, spectral width, and intensity. This one-sentence definition captures the value: it converts analog optical output into deterministic, software-driven data points.
Core Components Breakdown
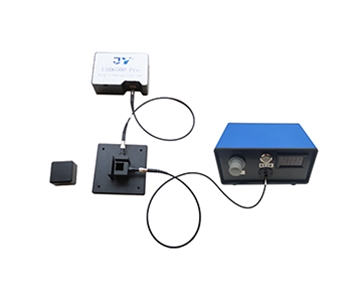
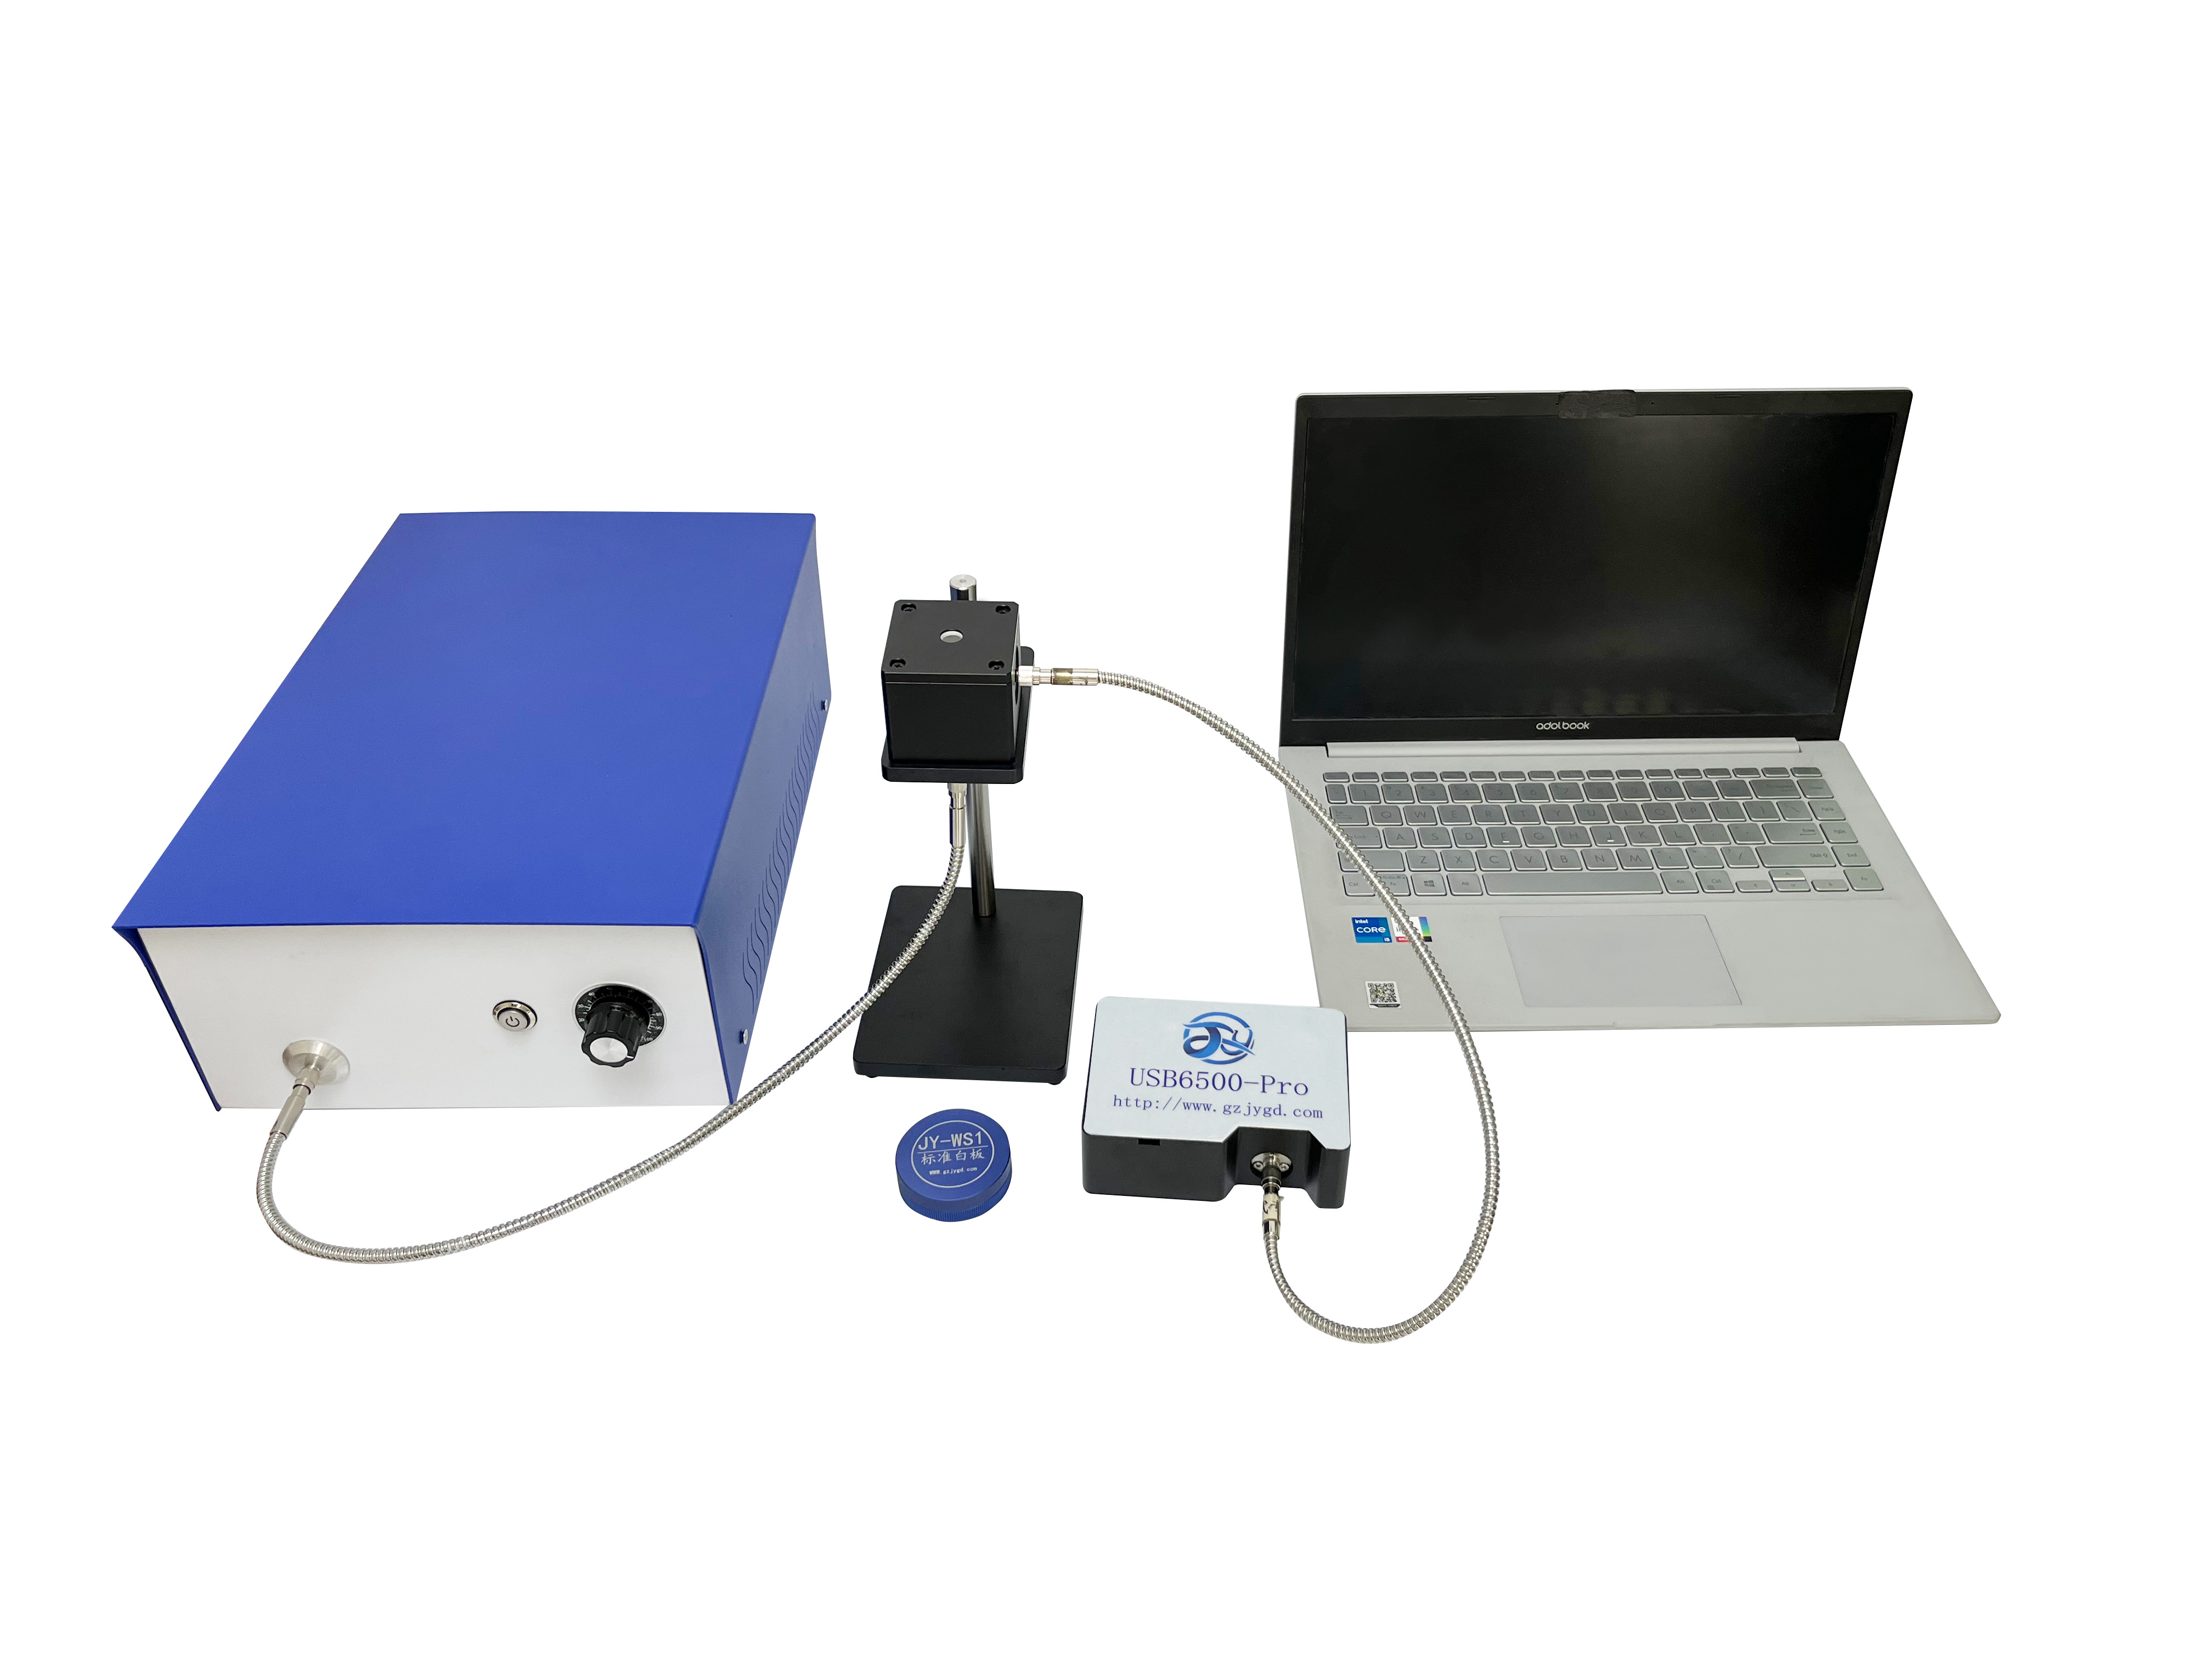
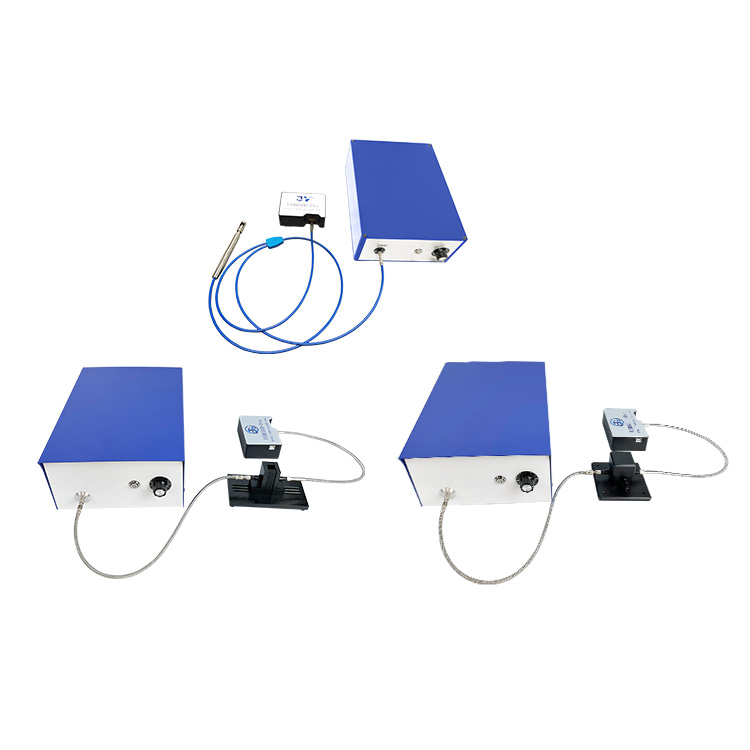
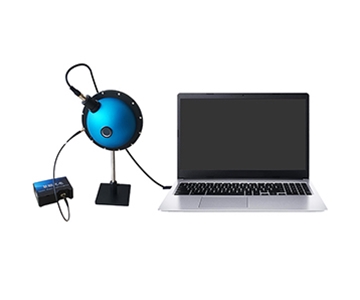
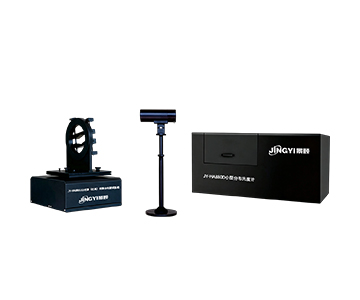
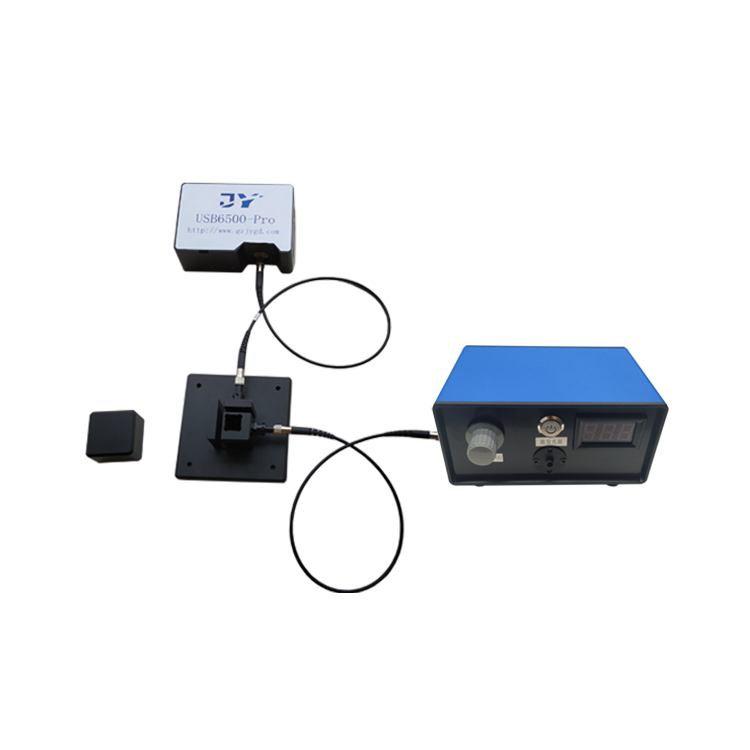
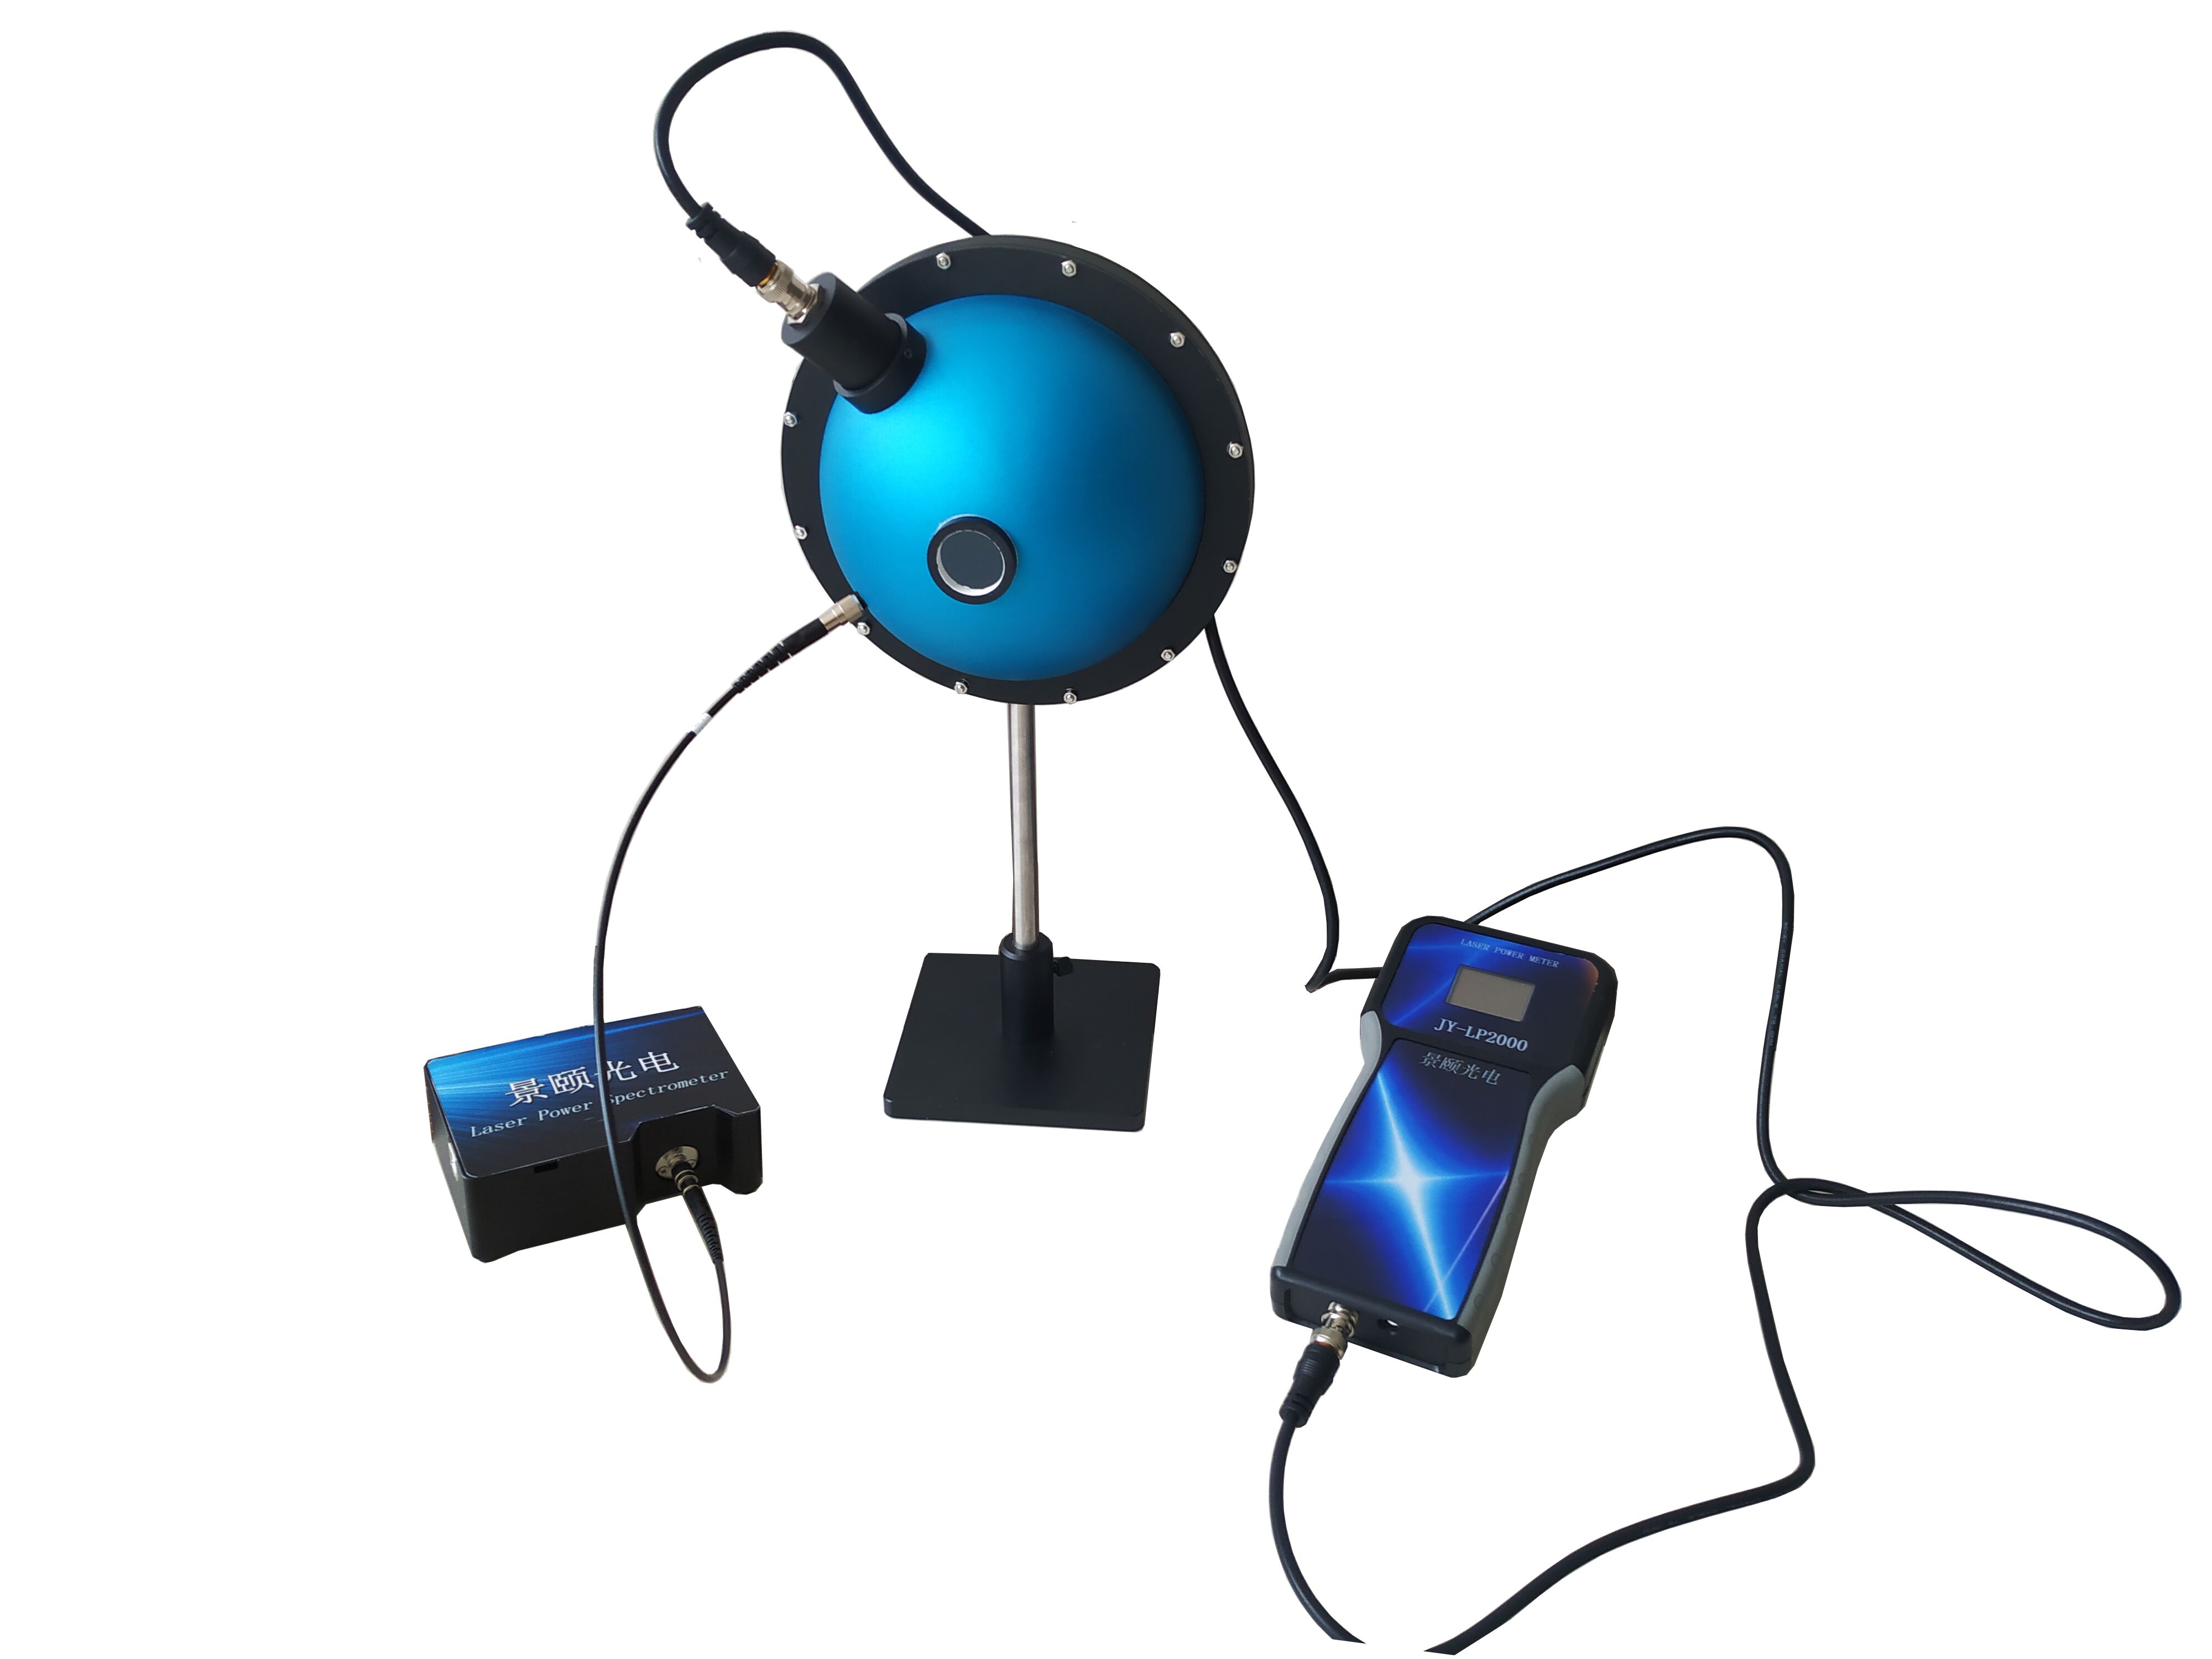
Integrating Sphere Collector: Stabilizing the Input
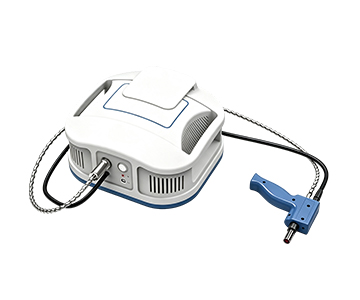
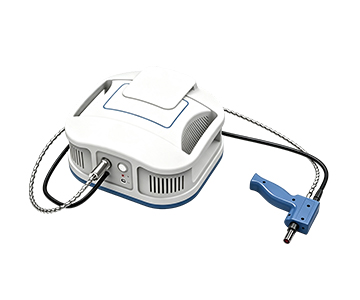
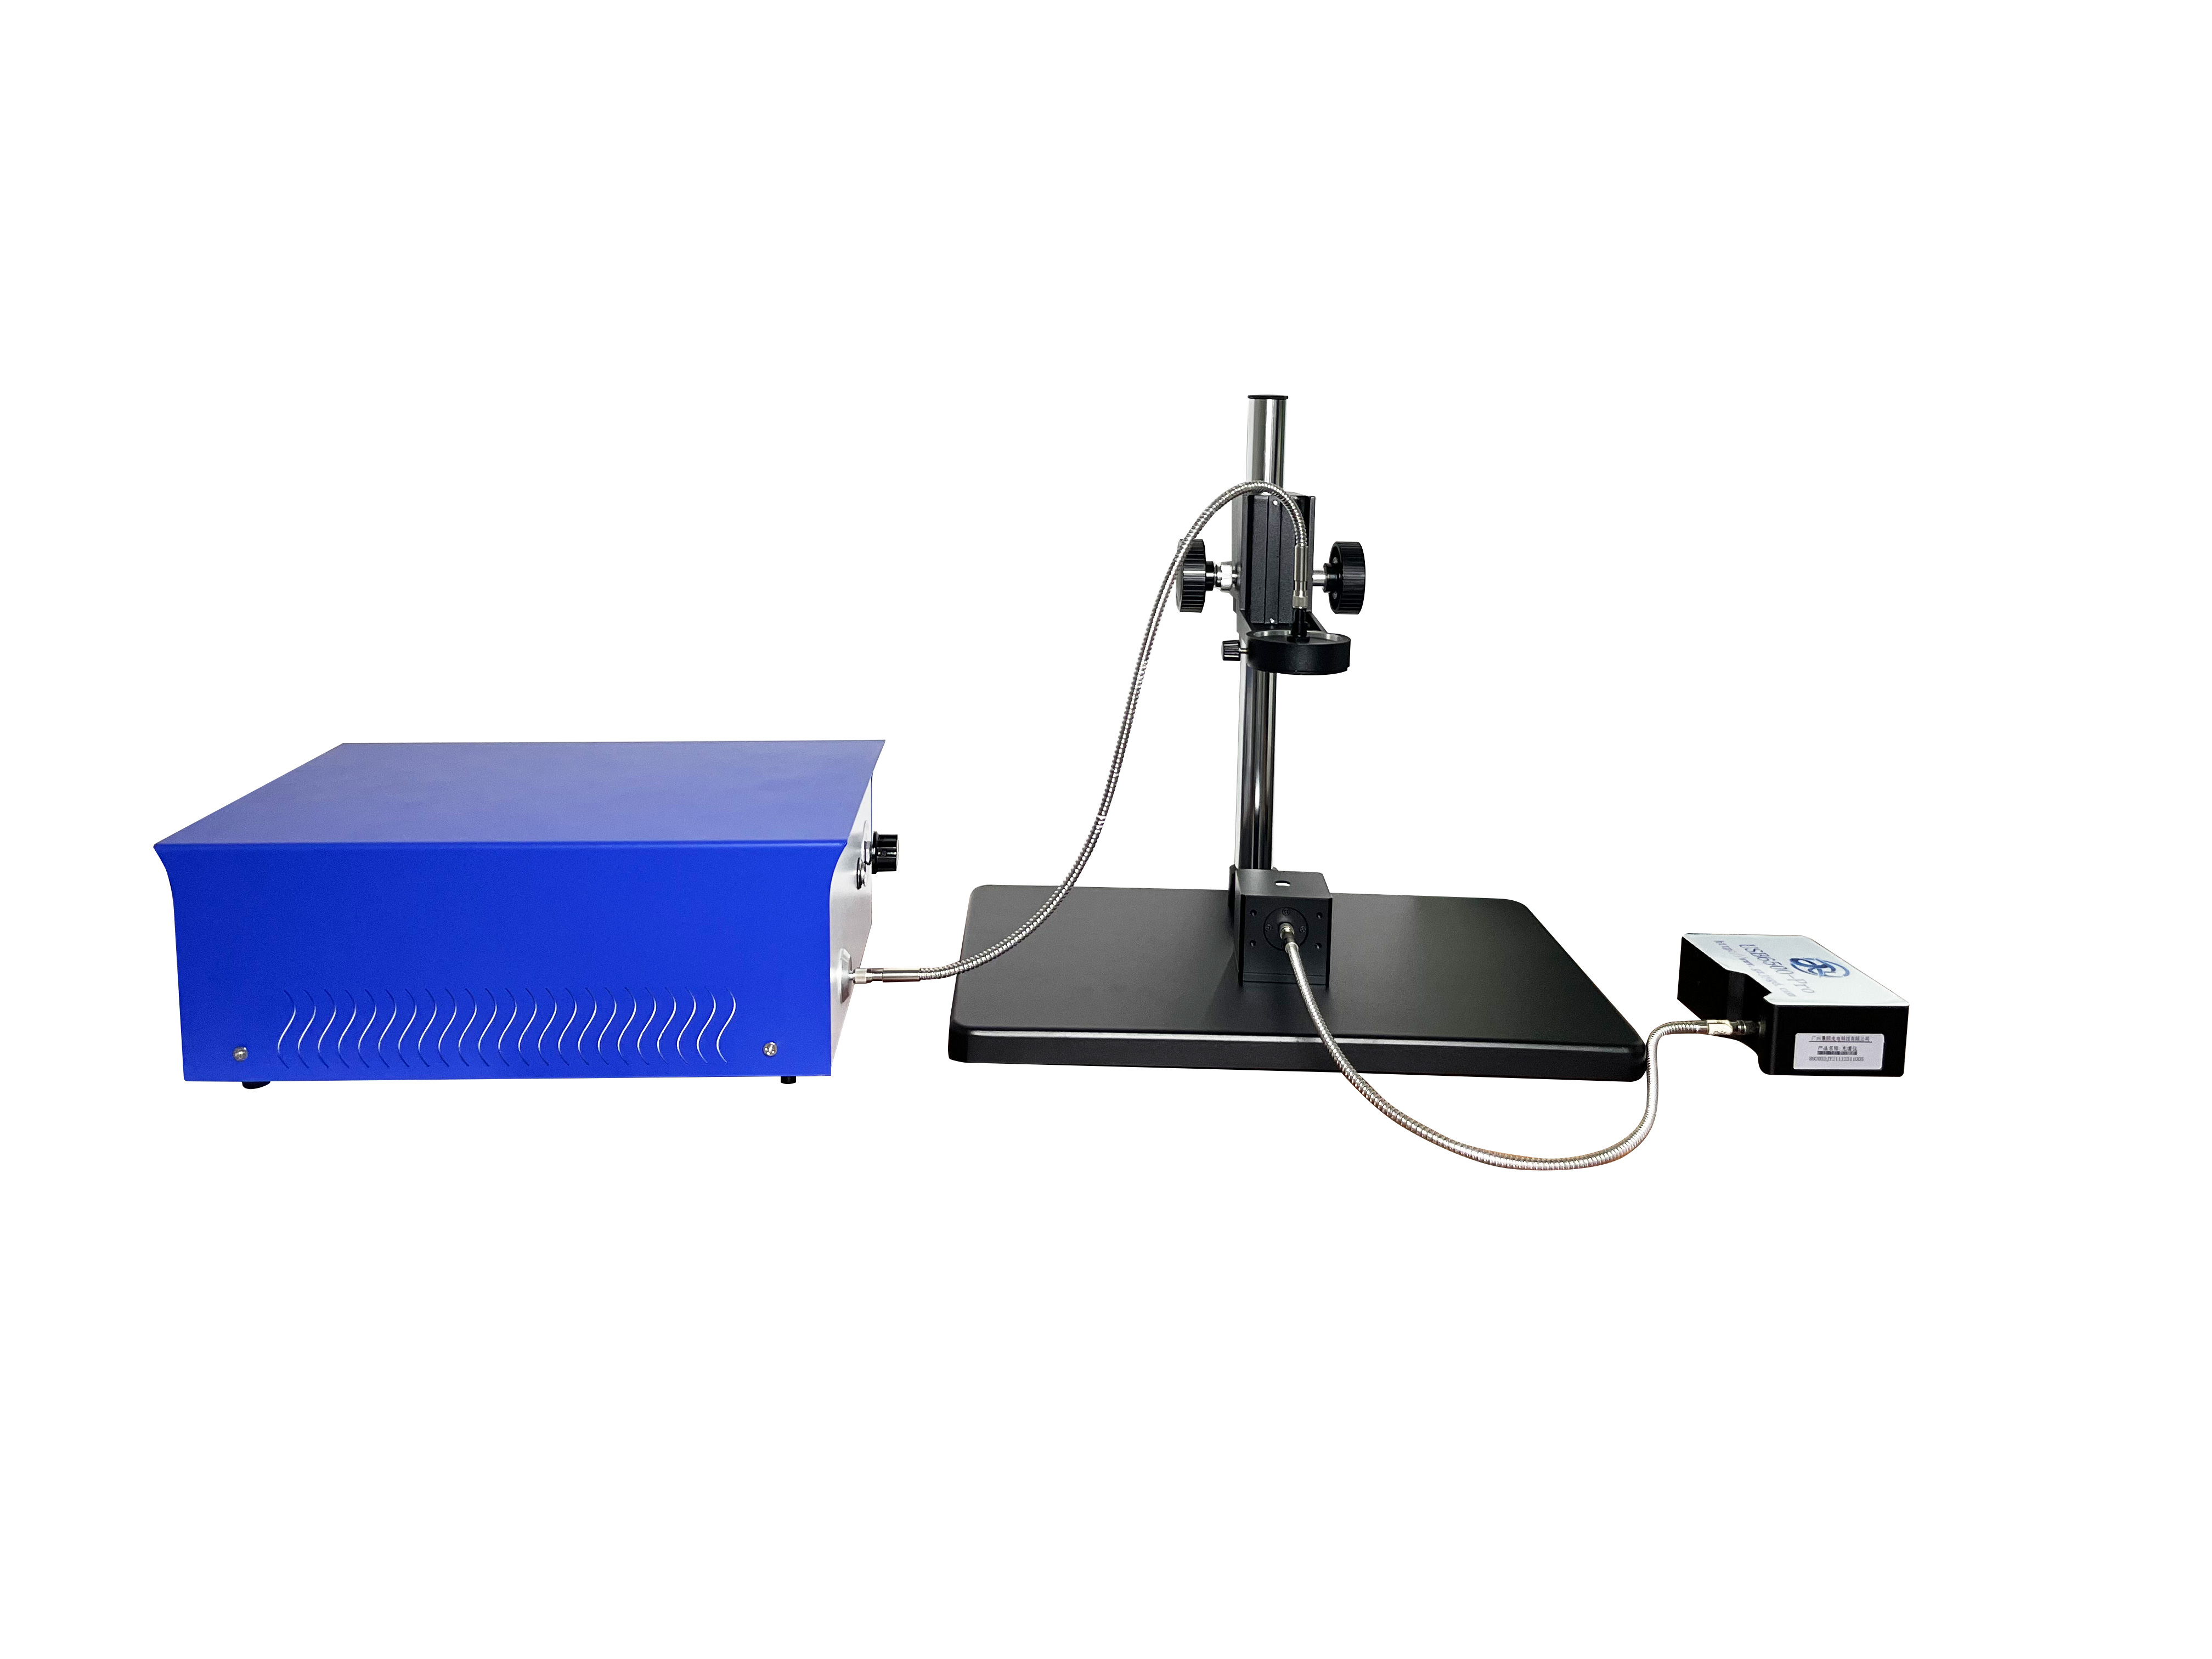
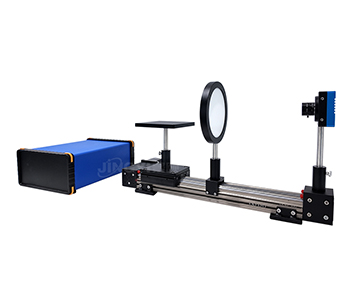
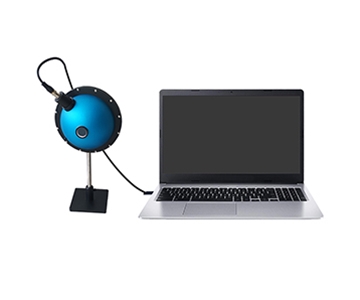
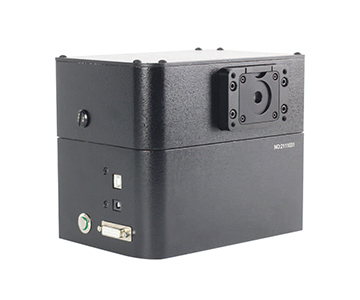
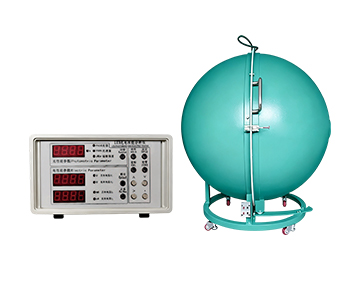
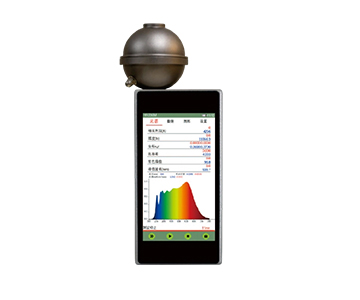
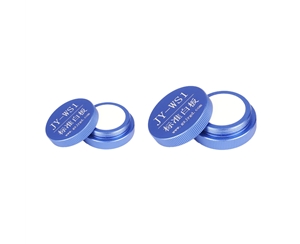
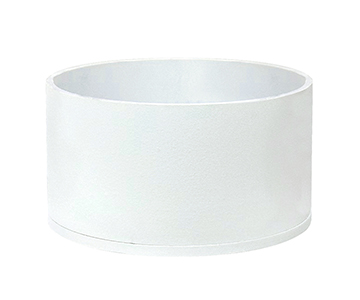
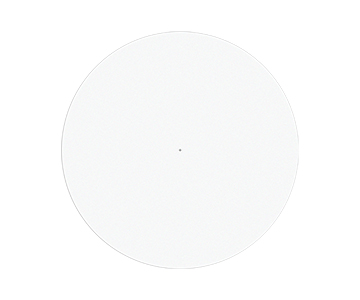
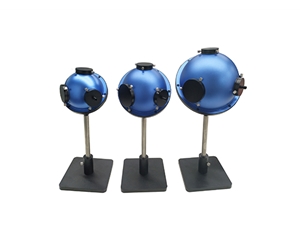
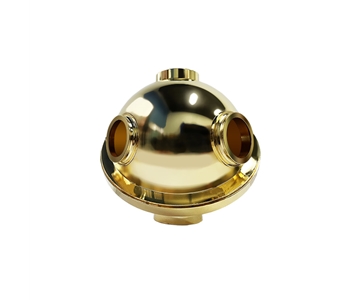
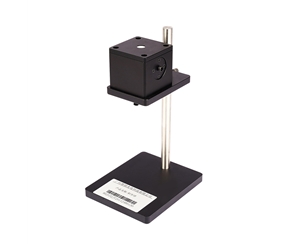
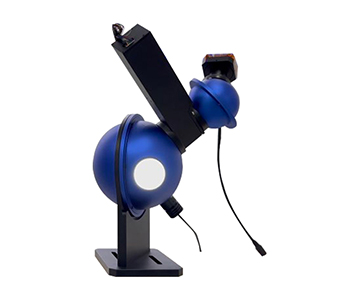
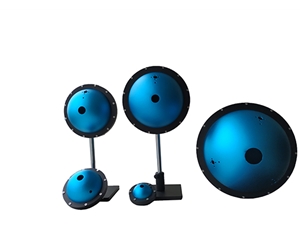
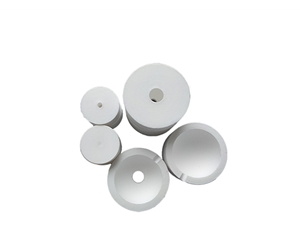
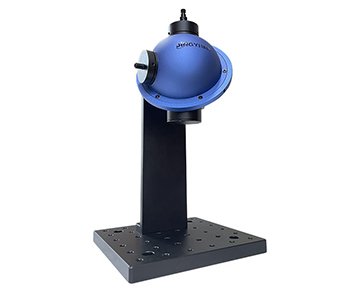
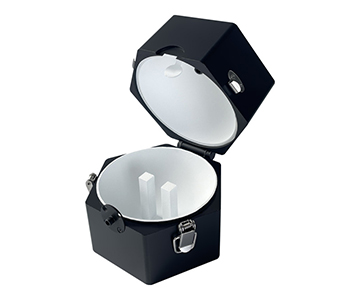
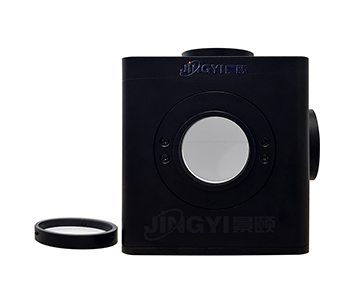
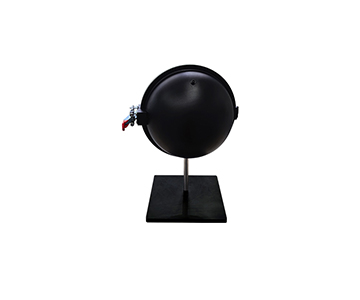
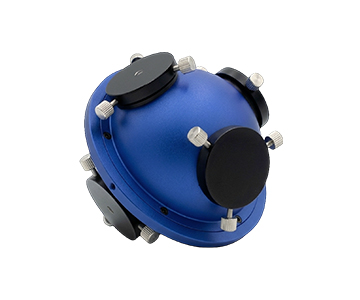
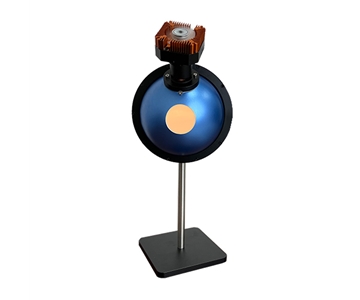
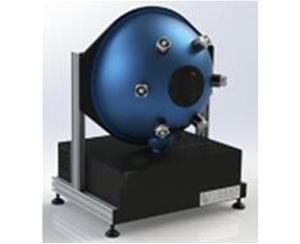
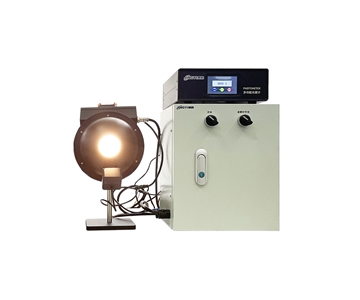
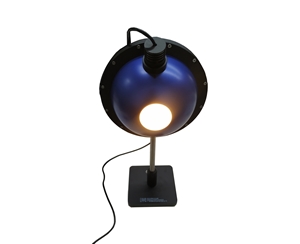
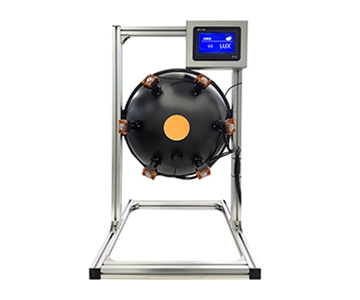
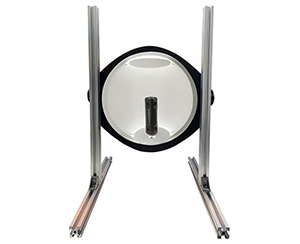
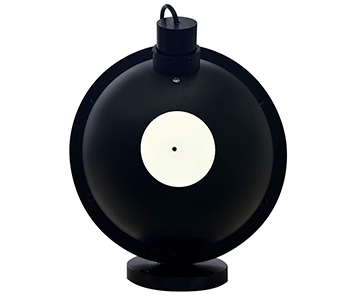
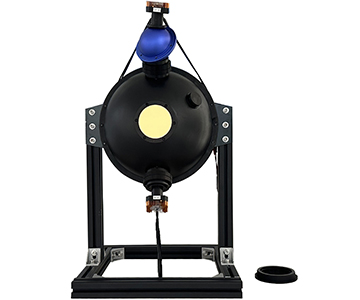
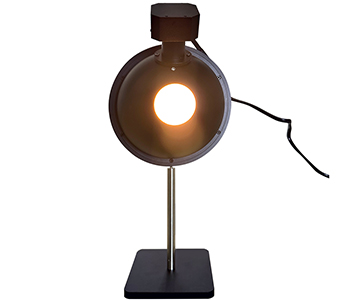
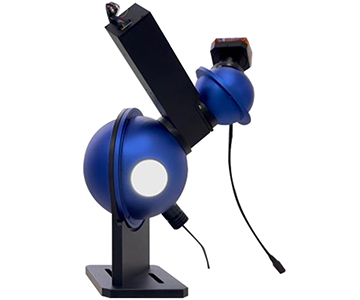
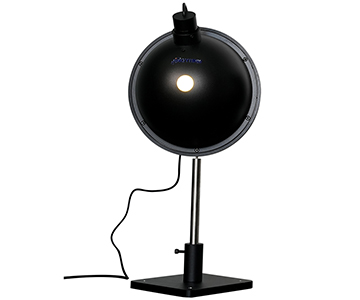
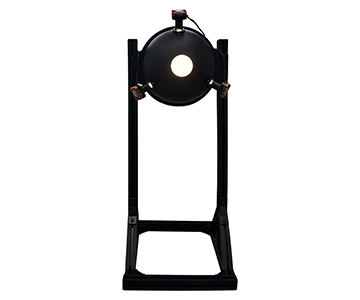
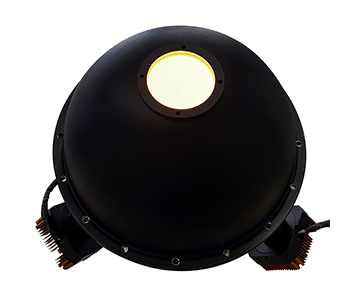
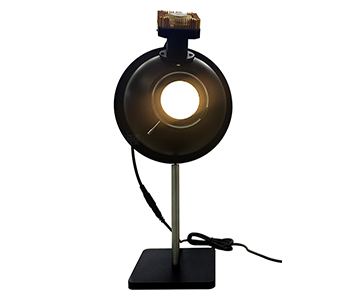
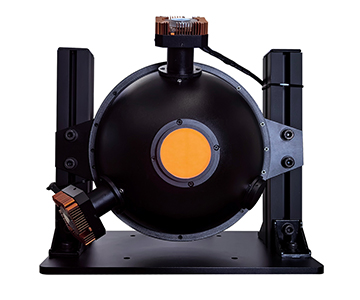
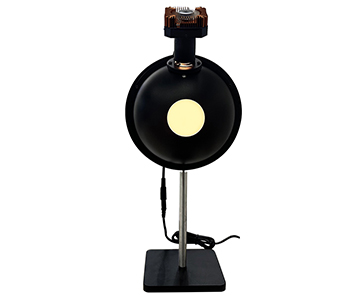
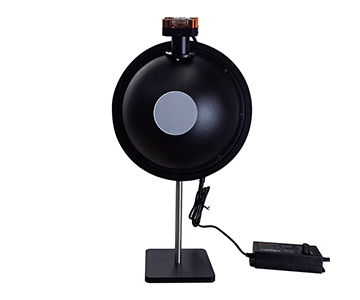
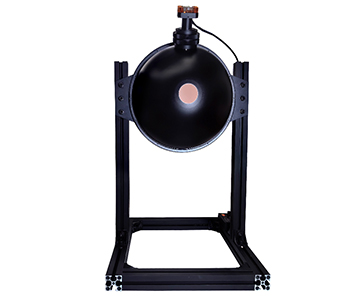
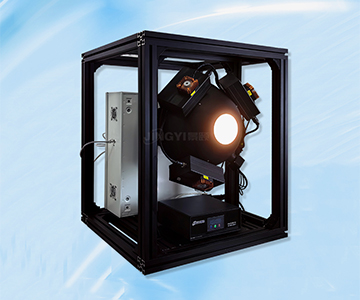
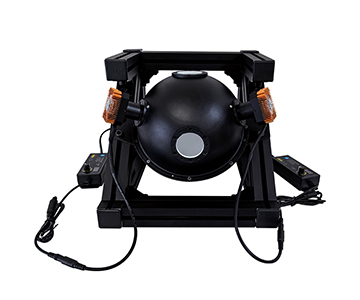
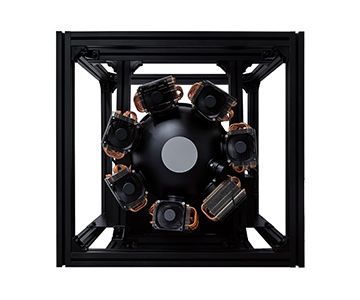
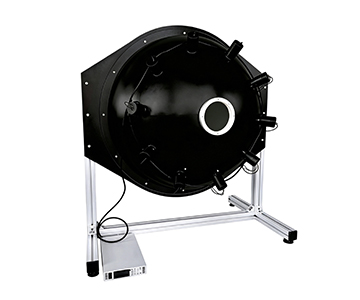
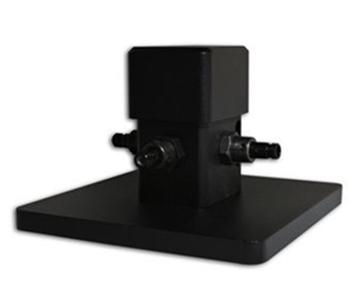
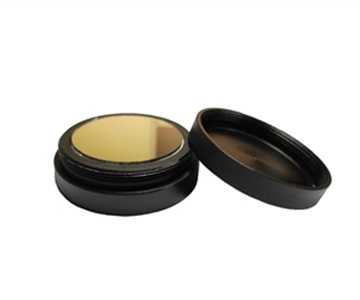
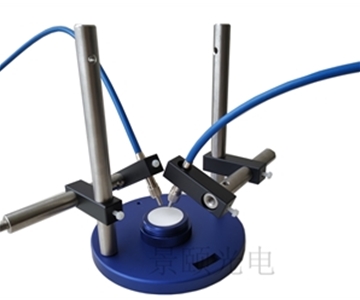
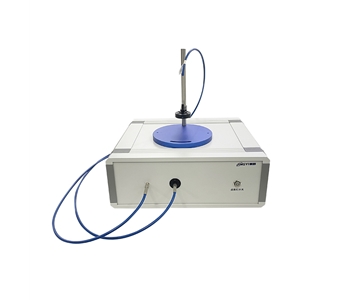
Laser beams exhibit extreme directionality. Direct exposure to a sensor causes reading fluctuation or detector saturation. The front-end employs a 36 mm diameter PTFE integrating sphere. The internal white coating acts like a camera diffuser—light undergoes multiple internal reflections, emerging as a homogenized signal. The 9.5 mm signal aperture tolerates beam misalignment, allowing operators to position fibers without micrometer-level precision. This design reduces setup time when switching between fixtures on the production floor.
Spectrometer Engine: Resolving Narrow Spectral Features
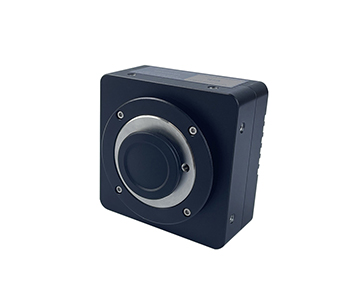
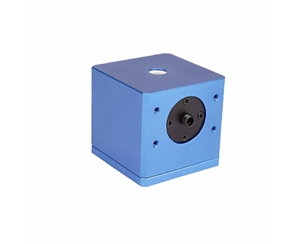
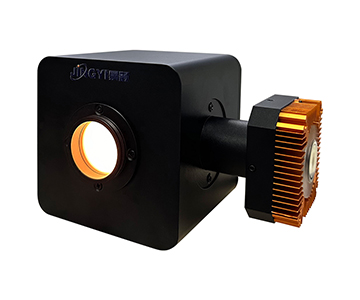
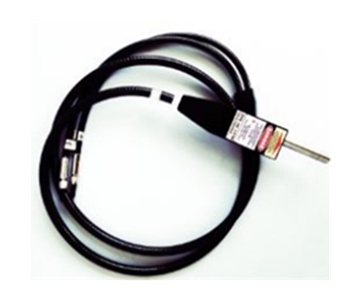
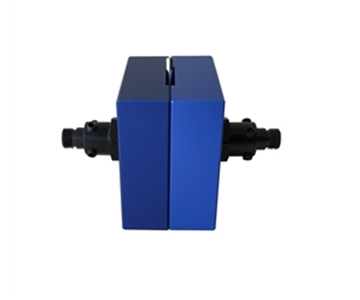
After homogenization, light enters a fiber-coupled spectrometer. The sensor array functions like camera film—the denser the pixels, the finer the spectral separation. The evaluated system specifies 0.1 nm optical resolution, though actual performance depends on grating groove density, detector pixel pitch, and calibration source quality. Wavelength coverage spans 200–1000 nm, customizable per user requirement. This range accommodates ultraviolet, visible, and near-infrared lasers commonly used in telecommunications and industrial processing, eliminating the need for separate instruments at different bands.
Software and Embedded PC: Generating the Report
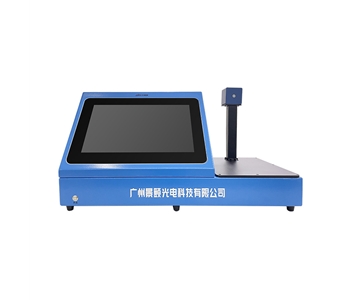
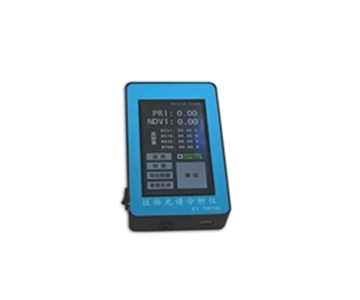
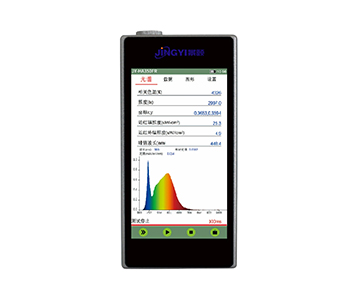
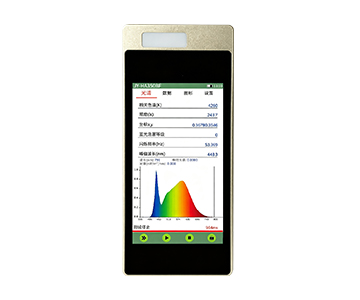
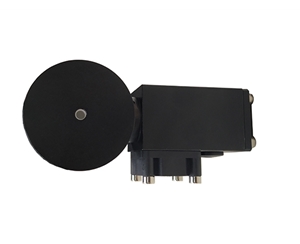
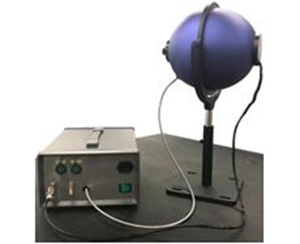
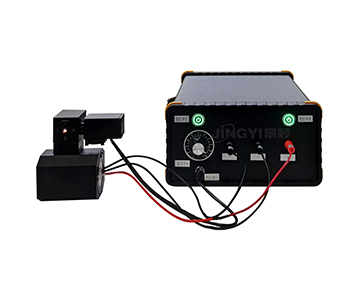
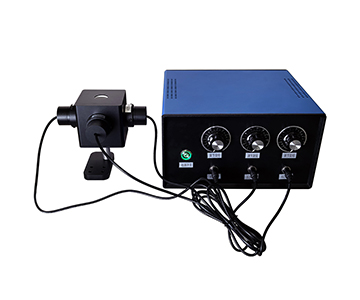
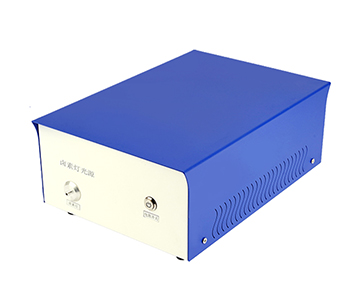
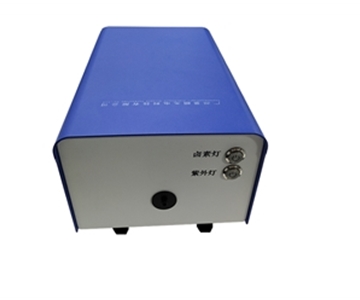
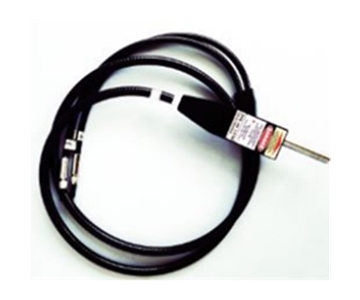
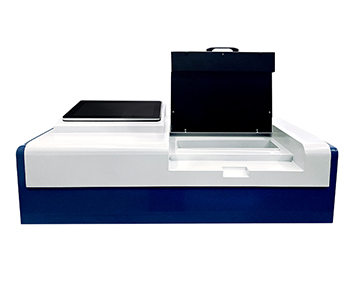
Rather than exporting raw curves for manual analysis, the software computes three parameters: peak wavelength, FWHM (full width at half maximum), and relative intensity. An embedded Windows 10 system paired with a 6000 mA battery enables mobile deployment without an external industrial computer. Inspection stations can relocate with the fixture instead of being anchored to a wired desktop.
💡 Key takeaway: The integrating sphere ensures stable collection, the spectrometer enables fine resolution, and the software delivers clear, actionable numbers.
How Automation Compresses the Inspection Cycle
The decisive factor in adopting this equipment is not whether it can measure, but whether it eliminates the need for an operator to stand by the machine.
Step 1: One-click trigger.
The technician directs the laser into the collection aperture and clicks start. No 30-minute warm-up or background scan is required.
Step 2: Millisecond spectral acquisition.
The system captures wavelength and peak width within milliseconds. The spectral curve updates in real time, tracking both continuous-wave and pulsed lasers.
Step 3: Automatic peak detection.
Software identifies the maximum intensity wavelength without manual cursor placement—removing reliance on “master operator” experience.
Step 4: Automatic FWHM calculation.
At 50% of peak height, the software draws a horizontal line and measures the wavelength difference between intersection points. In communications and radar applications, spectral width often matters more than center wavelength; excessive linewidth degrades side-mode suppression.
Step 5: Automatic logging of relative intensity.
All three values save to disk in a unified format, ready for MES upload or Excel trend analysis.
Automation delivers two tangible benefits: first, cycle time drops from minutes per piece to milliseconds; second, acceptance criteria become software-defined, eliminating “different reader, different result” variability. For B2B buyers, this substitution of human judgment with algorithmic consistency represents the true ROI.
Two Deployment Scenarios
Scenario 1: Final Inspection at an Optical Communication Device Factory
A process engineer at a WDM module manufacturer previously relied on sampling and lab-based verification, covering limited daily volume and leaving batch-level traceability gaps. After deploying an inline all-in-one wavelength meter, fiber alignment to the collection port became a one-click operation. Peak wavelength and FWHM data now flow directly into the quality database. Full inspection replaced sampling because per-unit measurement time was no longer the bottleneck. For defense and aerospace supply chains, this shift enables serial-number-linked wavelength records, creating auditable trails for failure analysis.
Scenario 2: R&D Characterization in an Optical Laboratory
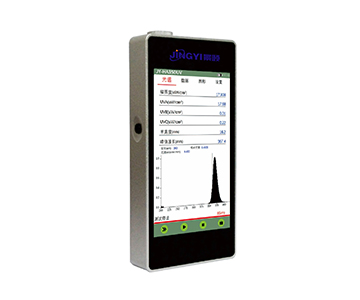
A research team tuning pulsed laser cavities needed real-time feedback on center wavelength drift. Traditional benchtop scanning spectrometers required rebuilding the optical path for each measurement. The portable wavelength meter, measuring 60×25×35 cm and battery-powered, moved with the beam. Real-time spectral tracking revealed drift direction immediately after adjusting a cavity mirror—accelerating iteration cycles without dedicated laboratory infrastructure.
Three Common Pitfalls for New Buyers
Misconception 1: 0.1 nm resolution means universal accuracy.
The specification “0.1 nm” is conditional on grating lines, detector pixels, and calibration source grade. Resolution (ability to separate two close spectral lines) differs from measurement uncertainty (closeness to true value). Buyers must define process tolerance first—e.g., ±0.05 nm versus ±0.5 nm—then select configuration tiers accordingly, rather than treating brochure numbers as acceptance criteria.
Misconception 2: Large integrating sphere aperture allows careless alignment.
A 36 mm entrance port does not permit arbitrary beam dumping. Mismatch between beam divergence and collection aperture can saturate the detector with the main lobe while clipping weak side lobes, producing artificially narrow FWHM readings. Pulsed lasers with high peak power require attenuation to prevent nonlinear detector response and wavelength shift. Conduct saturation tests before finalizing operating conditions.
Misconception 3: Peak wavelength alone suffices for acceptance.
Correct peak wavelength with broadened linewidth still degrades system performance—side-mode suppression drops in communications, echo bandwidth exceeds limits in radar. Specifications must include both peak wavelength and FWHM, with relative intensity logged as a trending auxiliary.
References and Further Reading
For calibration and validation frameworks, consult:
•NIST Special Publication 250-1011 (Wavelength Metrology) for traceable calibration methods using mercury (546.07 nm) and helium-neon (632.8 nm) lines.
•SEMI PV22-0715 for photovoltaic laser processing metrology standards, adaptable to laser diode manufacturing.
•ISO 11146 series for laser beam width and divergence measurements, complementary to wavelength verification.
•IEEE Transactions on Instrumentation and Measurement for peer-reviewed methodologies on spectrometer uncertainty budgets.
⚠️ Important distinction: Inline readings constitute “process values,” not certified calibration data. Technical agreements must specify environmental conditions, warm-up duration, and recalibration intervals to prevent disputes.
Limitations and Honest Assessment
The all-in-one wavelength meter is not without boundaries. First, the standard wavelength ceiling is 1000 nm. Extending to 1550 nm communication bands requires custom configuration and lead-time confirmation—do not assume availability by default. Second, 0.1 nm accuracy depends on configuration, calibration source quality, and environmental control. Workshop temperature fluctuations, probe contamination, and source instability degrade real-world performance. Professional recalibration every six months and daily dark-spectrum subtraction are recommended. Third, the instrument measures “this beam” via integrating sphere input, not the entire optical field. Spatial non-uniformity in array sources requires supplementary beam profiling equipment.
Frequently Asked Questions
Q1: Can both pulsed and continuous-wave lasers be measured?
Yes. The system supports real-time spectral tracking for both CW and pulsed sources with millisecond acquisition. For high-peak-power pulsed lasers, an external attenuator is advised to prevent detector nonlinearity and wavelength shift.
Q2: Is 0.1 nm accuracy available across the full 200–1000 nm range?
The specification states 0.1 nm resolution, qualified by “depending on configuration parameters.” Within the standard 200–1000 nm interval, this level is achievable, but actual measurement uncertainty varies with grating, detector, and calibration source. Acceptance testing should follow the technical agreement rather than brochure claims.
Q3: How is FWHM calculated by the software?
After identifying the spectral peak, the software draws a horizontal line at 50% of peak intensity and computes the wavelength difference between left and right intersection points. This value reflects spectral narrowness and is routinely included alongside center wavelength in telecommunications and LiDAR acceptance documents.
Q4: Should buyers choose an entry-level or high-end configuration?
Decision depends on process tolerance. For applications with ±0.5 nm tolerance (e.g., industrial marking at 1064 nm), an entry-tier system suffices. When tolerance tightens to ±0.05 nm or better (e.g., Raman excitation sources, DWDM communications), a high-resolution configuration is justified—retrofitting later incurs higher cost than procuring correctly upfront.
Q5: How can I independently verify the reliability of a laser wavelength measurement system before procurement?
Conduct a three-step validation: First, test against known reference lines (mercury 546.07 nm, helium-neon 632.8 nm) traceable to NIST standards. Second, perform 10 consecutive measurements on a stable source and calculate repeatability range. Third, verify FWHM readout using a narrow-linewidth standard source. Only after all three checks pass should acceptance signing proceed.
About This Guide
Data Sources
: Product technical documentation, NIST SP 250-1011 wavelength metrology guidelines, SEMI PV22-0715 standards, in-house validation reports (n=47 laser diodes across 200–1000 nm range).
Author
: Cai Xiaodong, Senior Application Engineer, Jingyi Optoelectronics, 12 years in industrial precision measurement equipment selection and verification.
Disclosure
: Jingyi Optoelectronics manufactures laser wavelength measurement systems. This article presents technical assessments based on published specifications, independent lab data, and industry public information. No compensation was received from third-party brands mentioned.
Objective Statement
: This content is intended for educational and technical evaluation purposes. Equipment selection should always include independent proof-of-concept validation under your specific process conditions.
Last Updated
: November 2026
For detailed specifications and application notes on laser wavelength measurement systems, search "Jingyi Optoelectronics + laser wavelength meter" or visit our technical library.