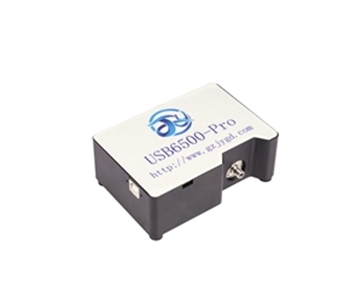
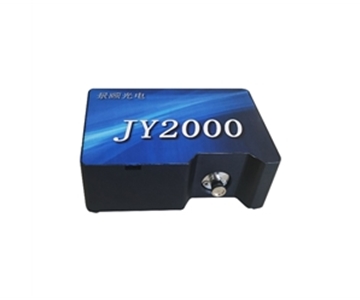
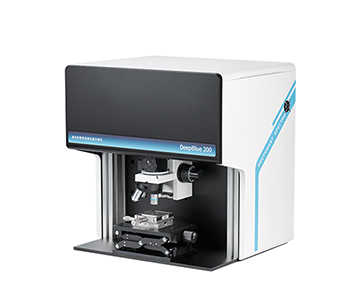
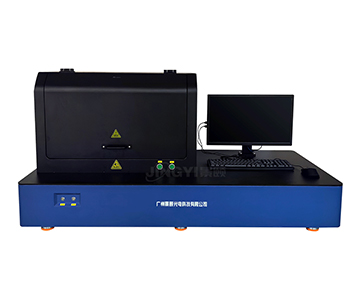
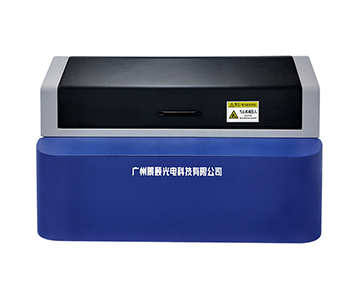
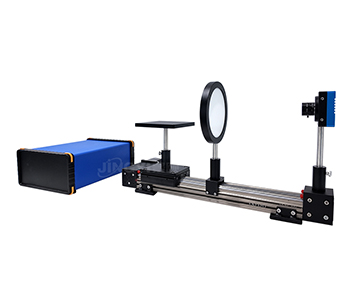
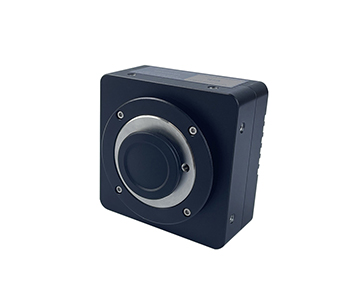
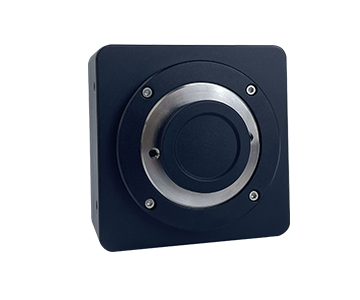
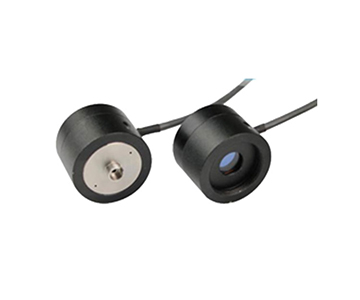
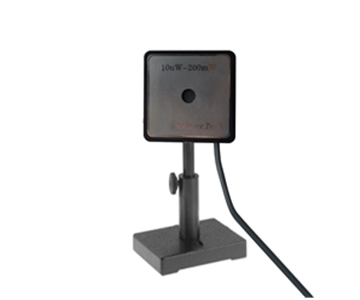
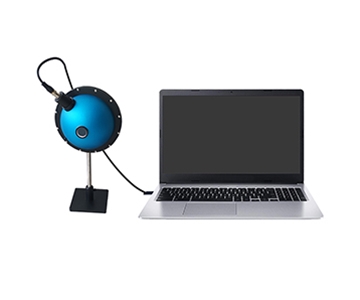
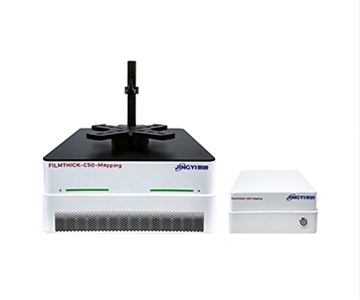
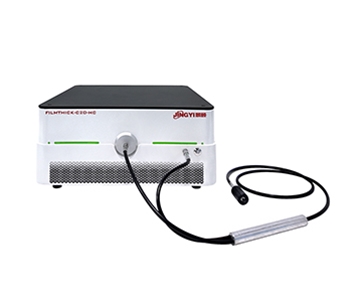
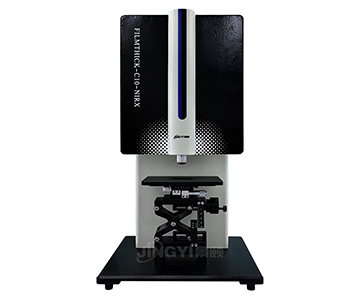
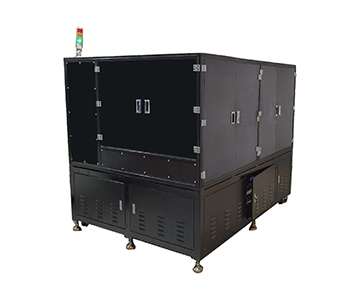
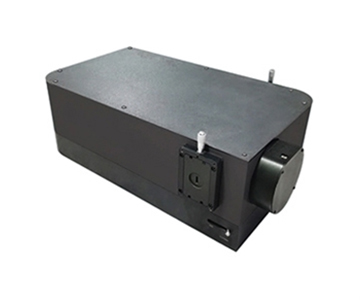
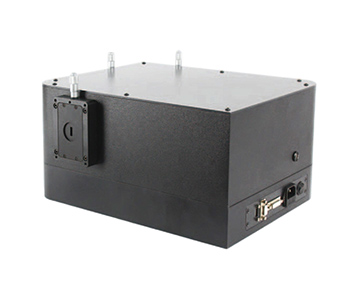
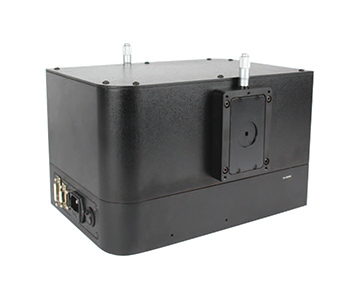
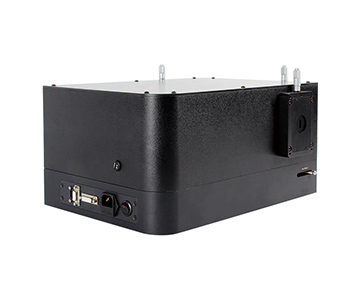
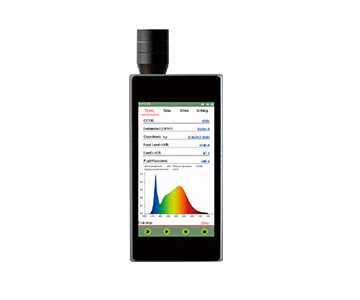
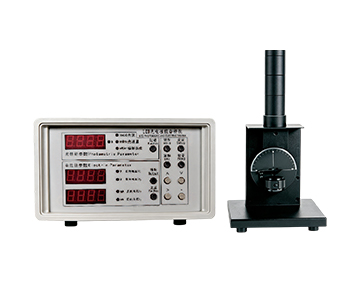
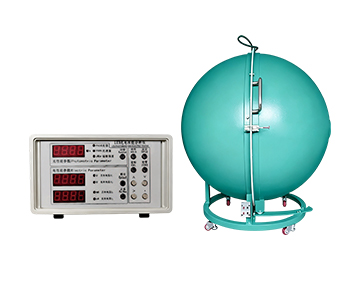
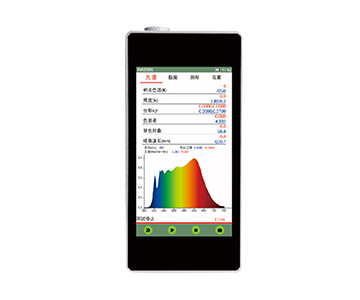
Optical inspection in display-panel and semiconductor fabs lives or dies by measurement drift. A gauge that passes qualification on day one can push yield off target within three years as detector cooling degrades and stray light accumulates in the optical path. This article reports repeatability and deviation testing on four mid-range spectrometer configurations across four scenarios — semiconductor film thickness, aerospace optical coating, medical-laser Raman, and LED binning — under controlled conditions (23 ±1°C, 45% RH). The evaluated mainstream system reached a signal-to-noise ratio above 1000:1 when cooled, cut dark current by one to two orders of magnitude, and held gate-oxide thickness repeatability within 0.3 nm. Across the equipment lifecycle, the conclusion is consistent: long-term calibration capability matters more than day-one specifications whenever traceable metrology is a hard requirement.
Testing Background and Five-Factor Control
During a recent line changeover at a panel fabricator, transmittance data for one optical coating lot diverged by more than 0.4% between two pieces of equipment. Root-cause analysis ruled out the process: one spectrometer, after three years of service, had developed elevated stray light and a drifting detector response. "The instrument itself is aging" is exactly the failure class that resists routine troubleshooting, because operators keep checking the process while the reference moves underneath them.
The validation centered on one dispute: short-term parameters of domestically produced spectrometers now approach imported equivalents, but can their accuracy hold up over two to three years of continuous fab operation? Answering that required tightening five variables.
Sample and Environment
Samples covered four families — SiO₂ gate-oxide wafers, aerospace-grade anti-reflection coated glass, Raman-standard silicon wafers, and LED epitaxial wafers. The lab held 23 ±1°C and 45% RH so that temperature would not inject additional noise.
Method and Instrumentation
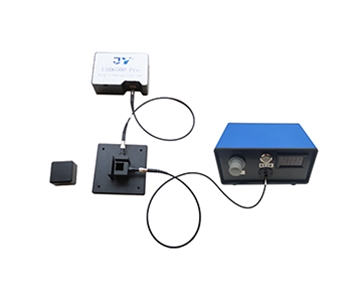
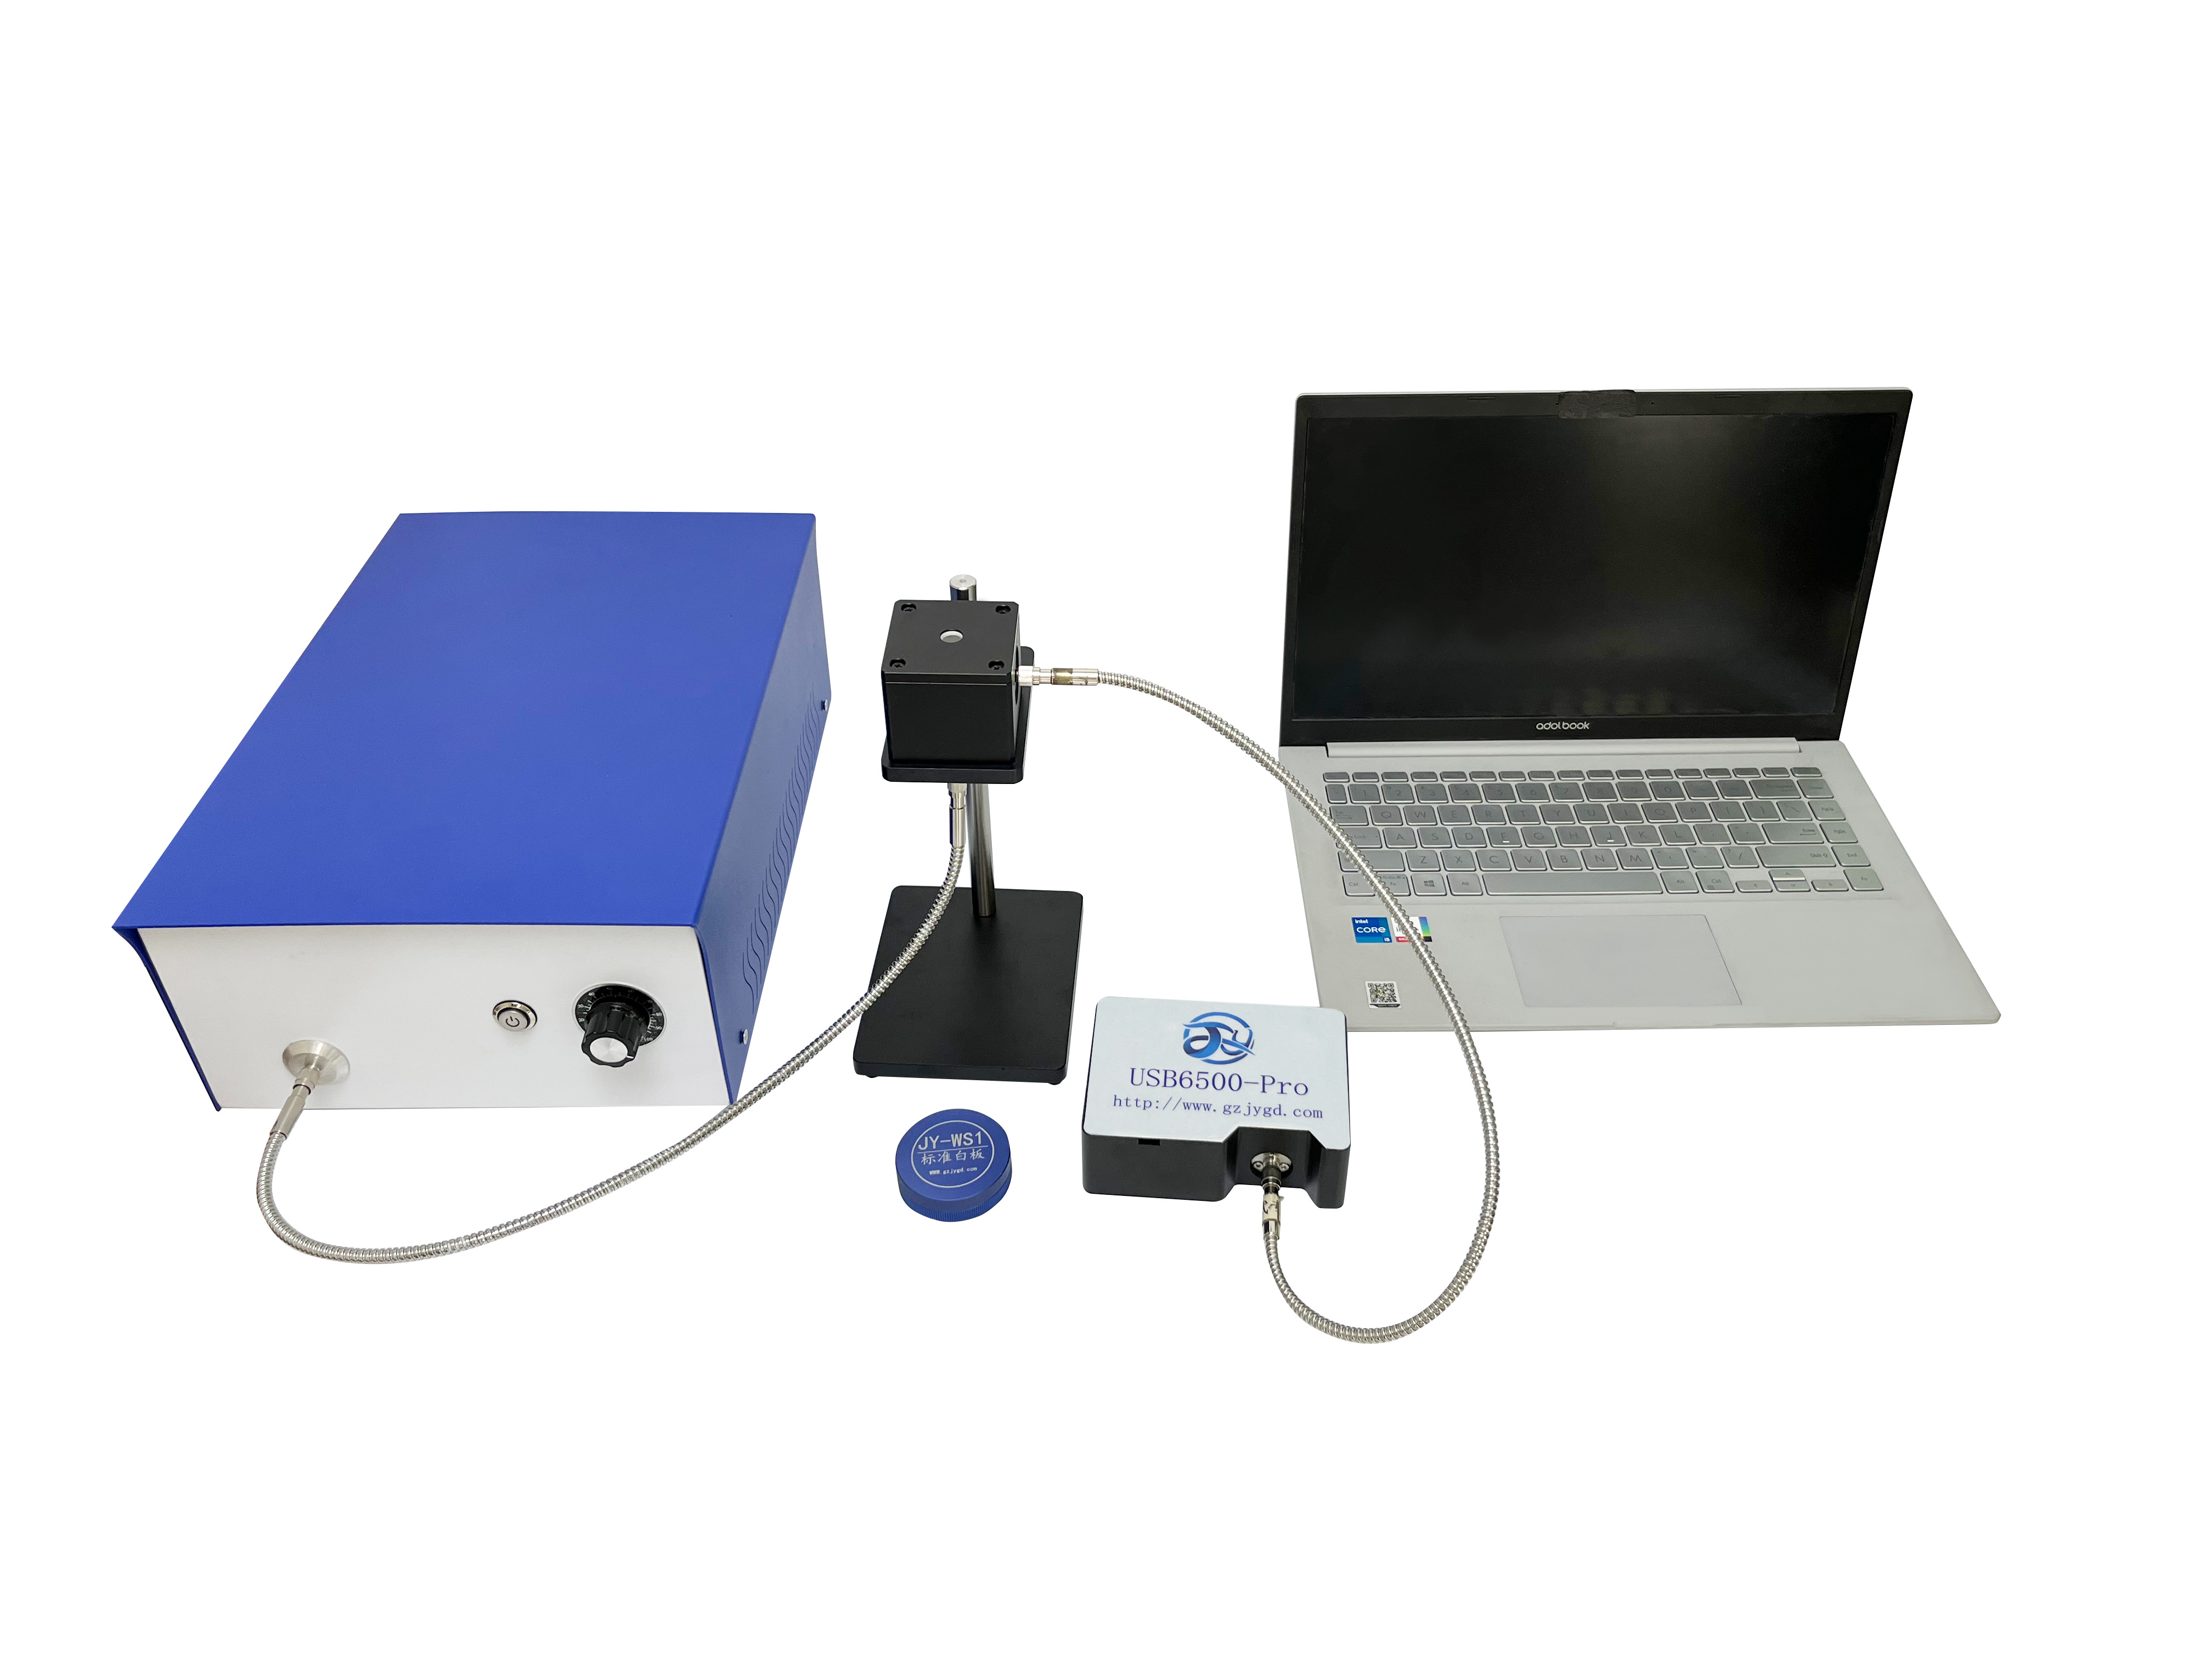
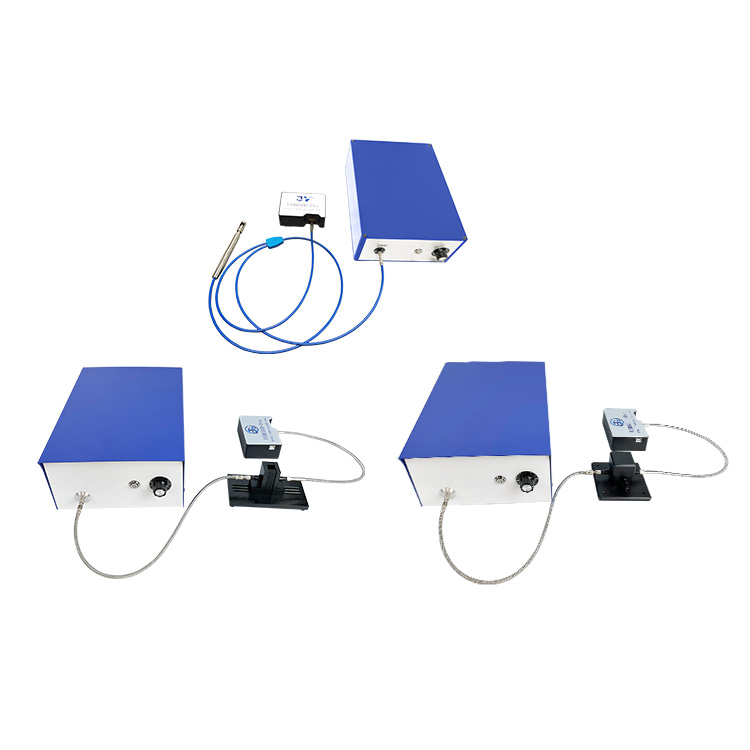
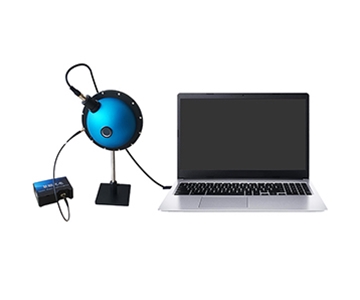
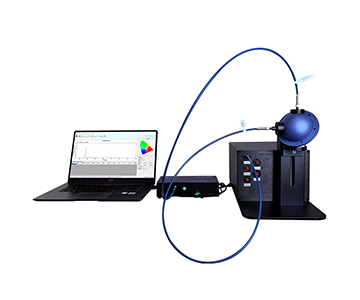
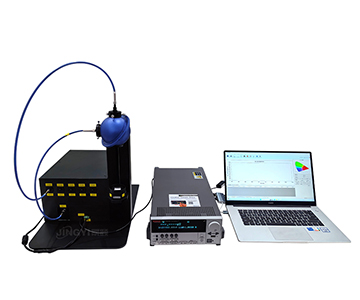
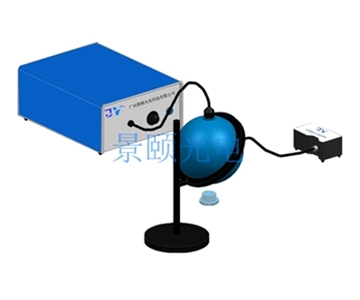
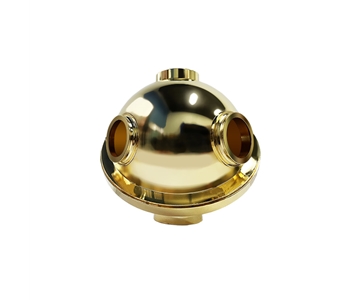
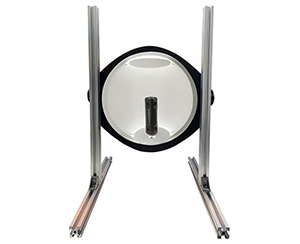
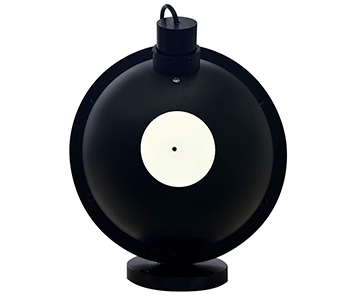
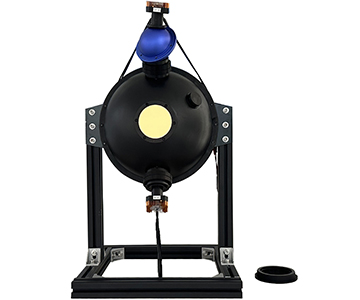
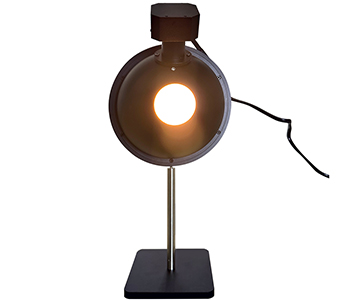
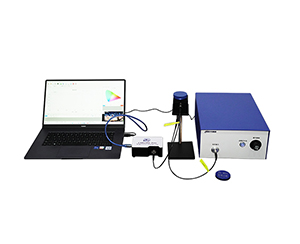
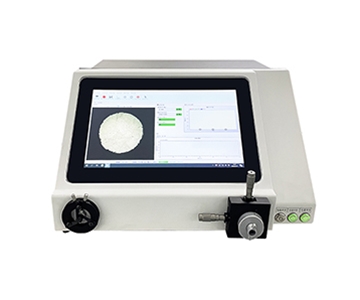
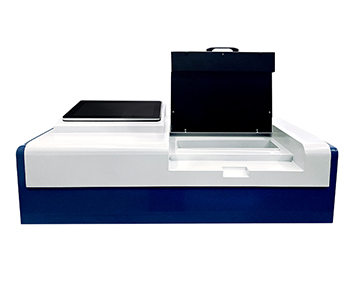
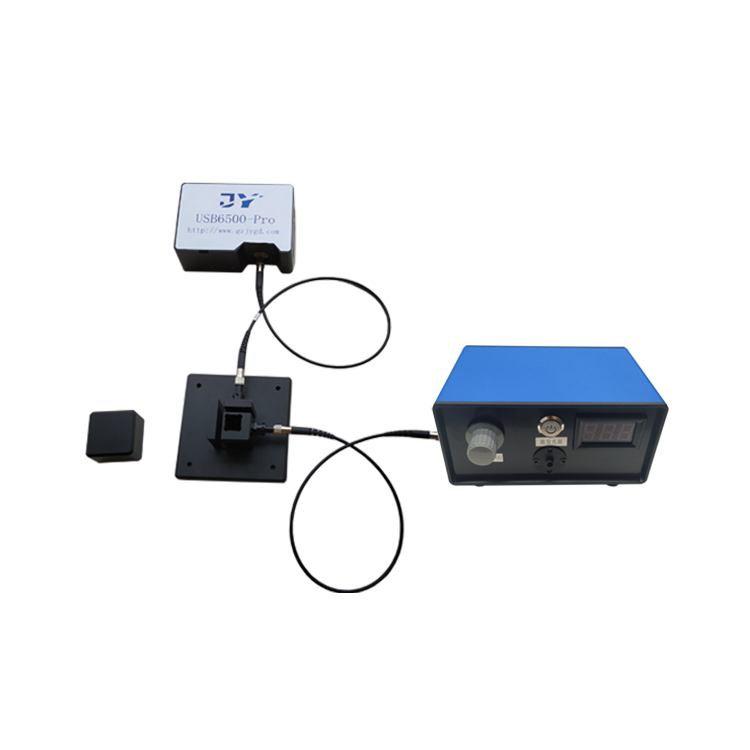
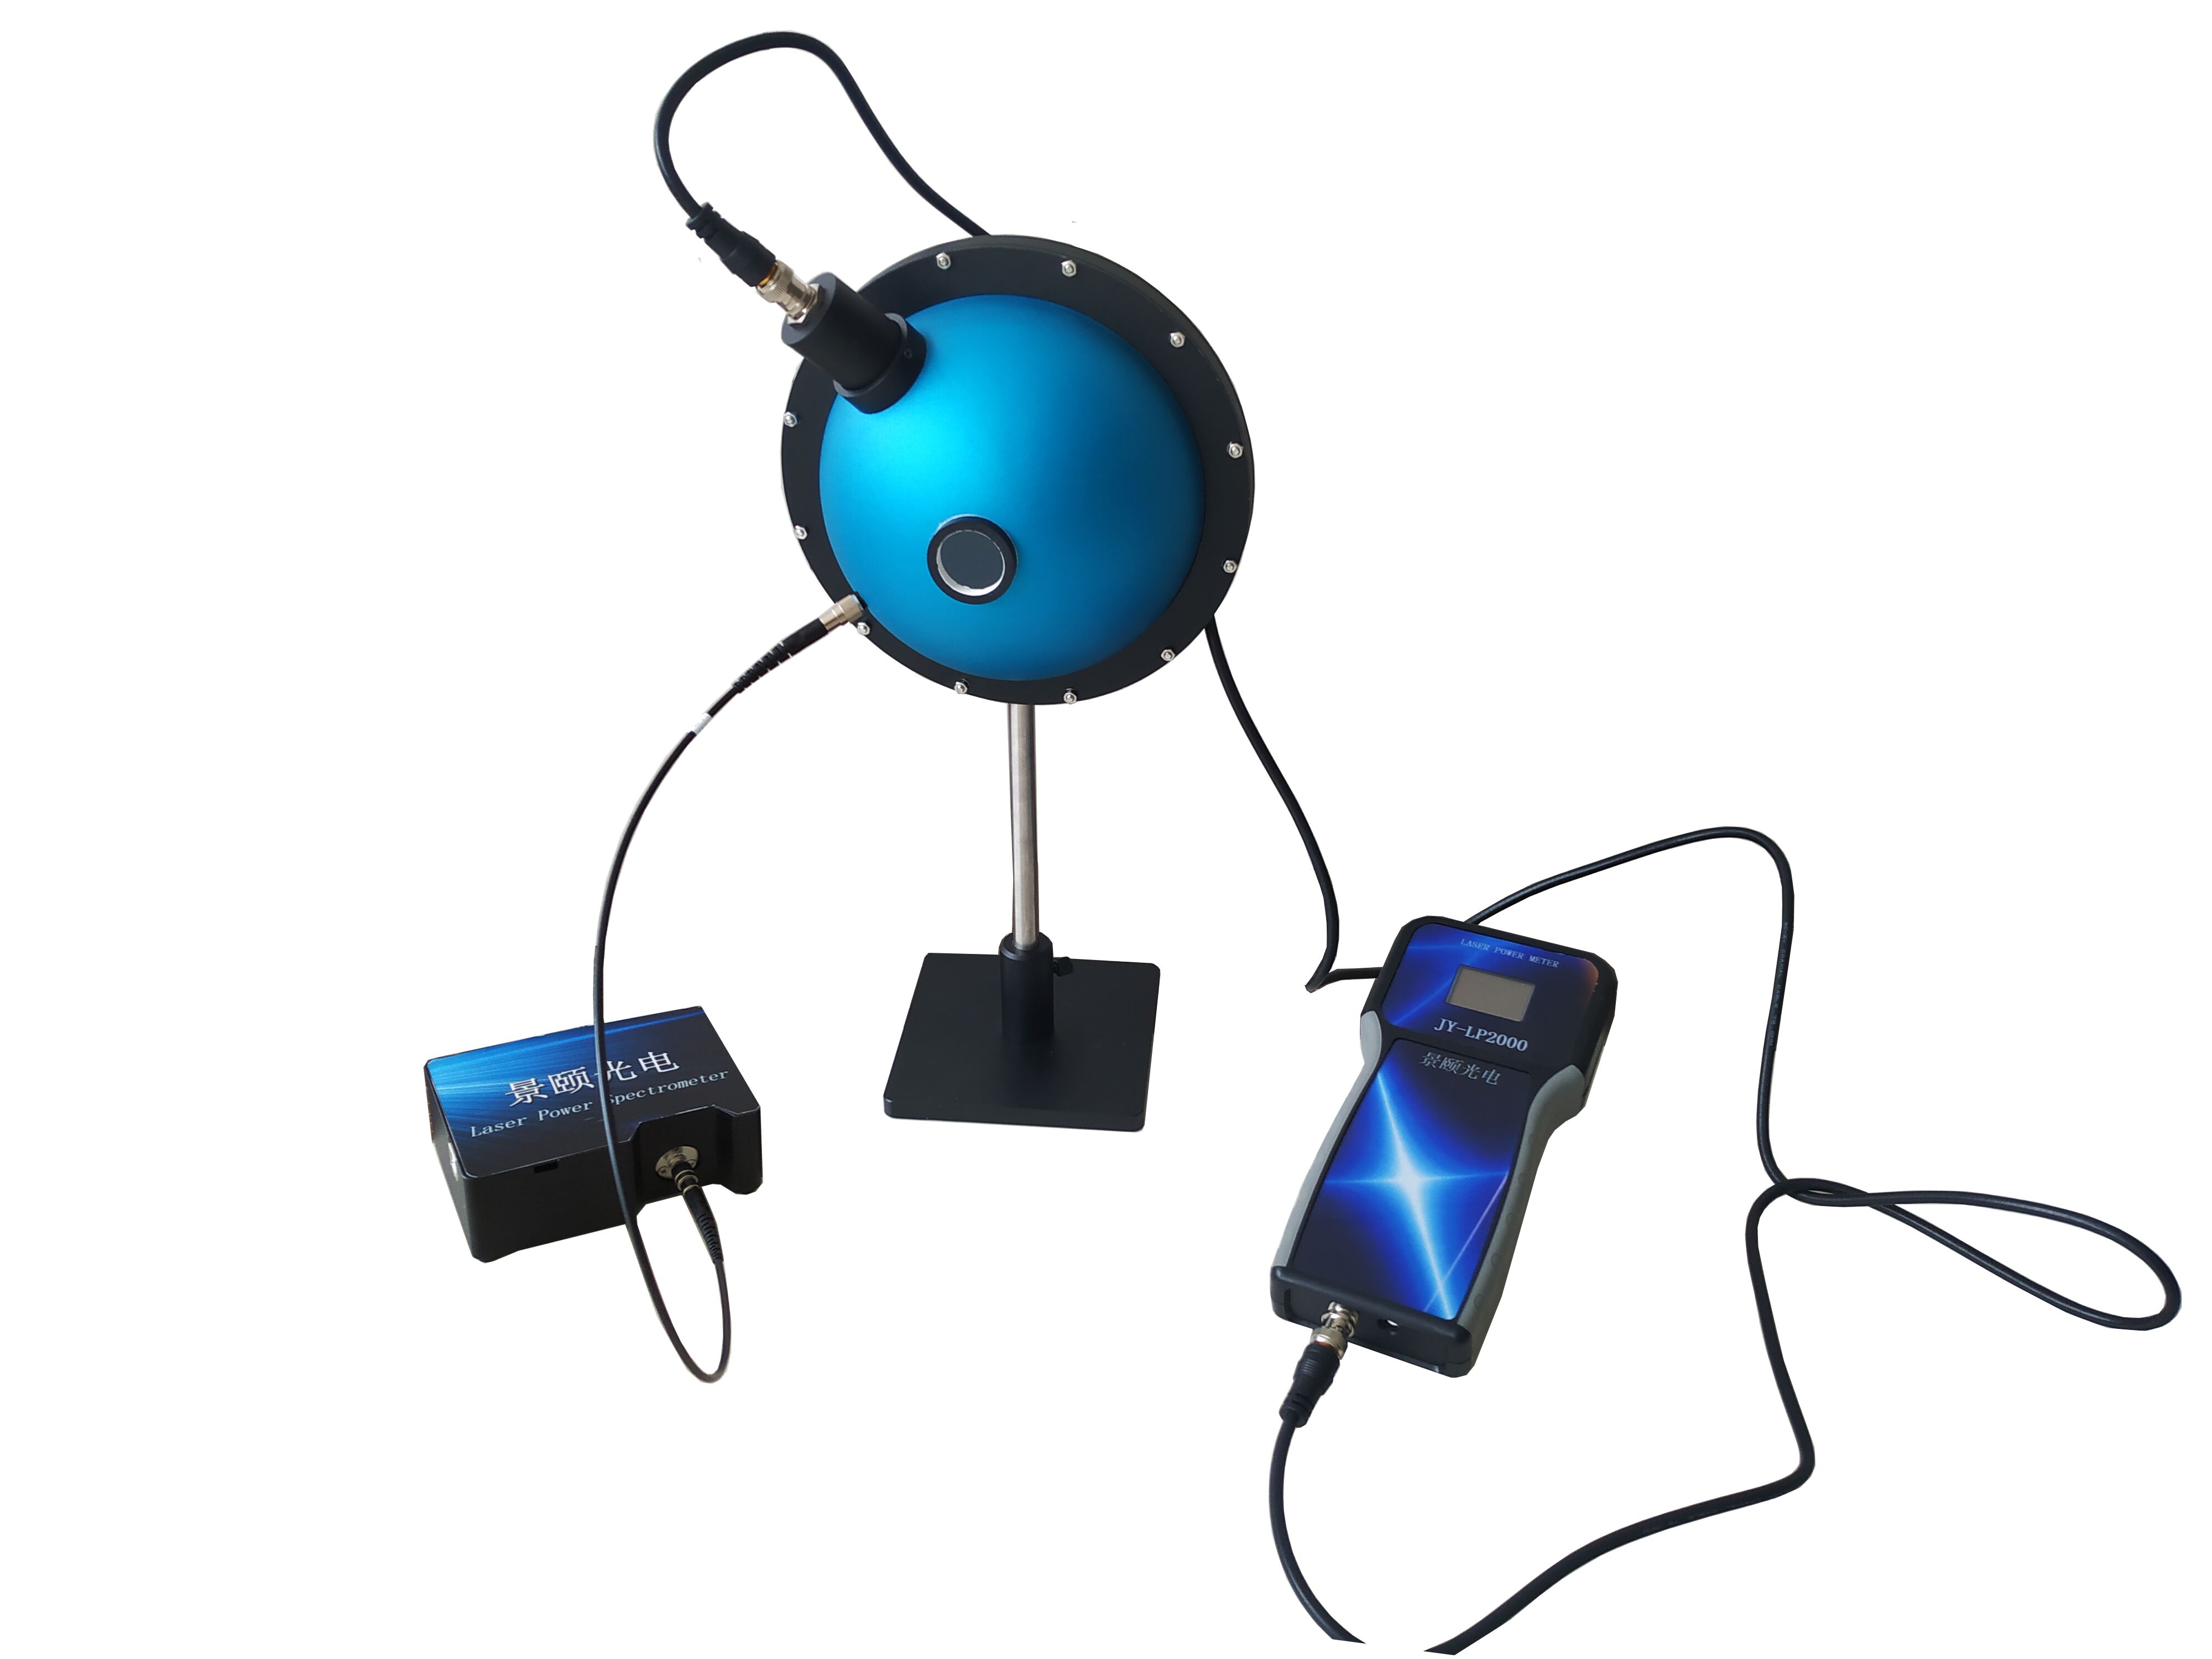
Two optical paths were standardized: trans-reflectance and integrating-sphere collection, with the slit fixed at 25 μm and 50 μm. The evaluated units spanned UV-Vis, wide-spectrum, and cooled near-infrared mid-range configurations, benchmarked against one high-stability imported reference.
Error Traceability Up Front
Before each run the procedure recorded the dark-current baseline, performed wavelength calibration, and ran a stray-light self-check. Dark noise captured at the tare moment became the subtraction baseline for everything after, so the instrument's own floor was never mistaken for a sample signal.
Validation Methodology
Each sample group was measured at least 20 times; the standard deviation is reported throughout. Dark-field subtraction and wavelength calibration preceded every group, and environmental conditions stayed controlled for the full session. Three methods anchored the protocol: reflectance-based film-thickness inversion against an imported reference (SEMATECH-style reflectance repeatability practice, aligned to ISO 15368 reflectance guidance); wide-band transmittance comparison following ASTM D1003 total-transmittance methodology; and Raman low-light characterization under a 785 nm excitation. All numeric results below carry their test conditions so they can be reproduced.
Four Industry Validation Cases
Semiconductor Film Thickness: Gate-Oxide Repeatability
A domestic wafer foundry running an 8-inch line at roughly 32,000 wafer starts per month needed gate-oxide thickness held within ±0.5 nm. The test objective: confirm reflectance-based thickness repeatability at the 0.3 nm level. The selected configuration used a back-illuminated cooled detector, inverting SiO₂ gate-oxide thickness from the reflectance spectrum against an imported reference unit.
Under calibration conditions aligned to SEMI thin-film metrology guidance and NIST-traceable wavelength standards, the evaluated system held repeatability deviation steady at 0.27 nm, with dark noise suppressed to the 8 e⁻ level in the cooled state.
| Metric |
Evaluated cooled unit |
Imported reference |
Delta |
| Thickness repeatability |
0.27 nm |
0.21 nm |
+0.06 nm |
| Signal-to-noise ratio |
>1000:1 |
~1500:1 |
slightly lower |
| Dynamic range |
50000:1 |
not specified |
— |
Key numbers in words:
the evaluated cooled unit delivered 0.27 nm repeatability versus 0.21 nm on the reference, a 0.06 nm gap; dynamic range reached 50000:1 where the reference spec was unstated.
On the yield side, rework batches caused by thickness out-of-spec fell from 0.83% to 0.31%. The trade-off: the cooled configuration needs about 8 minutes of single-integration warm-up, slower than a non-cooled unit — a factor to plan for on high-speed full-inspection lines.
Aerospace Optical Coating: Wide-Band Trans-Reflectance Consistency
An aerospace optics supplier producing about 11,000 large-aperture lenses per year needed anti-reflection coatings characterized from visible into near-infrared. The objective was to control transmittance dispersion across the 180–1100 nm band. The wide-spectrum configuration, fitted with an SMA905 fiber interface and integrating sphere, repeated 20 measurements per sample and took the standard deviation.
Following a total-transmittance comparison aligned to ASTM D1003, the wide-band unit achieved a visible-range transmittance repeatability standard deviation of 0.06%. Its 3648-pixel array yields a 0.27 nm pixel interval, giving enough spectral sampling density to resolve the cut-on edge of narrowband filters.
| Metric |
Domestic wide-band unit |
Imported equivalent |
Delta |
| Transmittance repeatability |
0.06% |
0.05% |
+0.01% |
| Stray light |
<0.1% |
<0.05% |
slightly higher |
| Band coverage |
180–1100 nm |
190–1100 nm |
wider |
Key numbers in words:
0.06% transmittance repeatability versus 0.05% on the imported equivalent; stray light sat one grade higher; band coverage ran 20 nm wider at the short-wave end.
Coating lot release cycle dropped by roughly 1.4 days. The limitation: stray-light control runs one grade above the imported unit, so samples below 0.1% transmittance require additional baseline subtraction.
Medical Laser: Capturing Weak Raman Signals
A minimally invasive laser-medical-device maker needed Raman screening of biological tissue in development. The question was whether signal-to-noise under weak light could support ppm-level feature-peak identification. A back-illuminated CCD low-light configuration was used with 785 nm laser excitation and integration time adjustable from 6 to 10000 ms.
The back-illuminated structure raised quantum efficiency overall from UV into near-infrared, at roughly 0.32 Counts/e⁻ sensitivity. At equal integration time the feature-peak signal-to-noise reached 450:1 — enough to resolve the carotenoid doublet.
| Metric |
Domestic low-light unit |
Imported cooled unit |
Delta |
| Signal-to-noise ratio |
450:1 |
>1000:1 |
markedly lower |
| Minimum integration |
6 ms |
~1 ms |
slower |
| Operating temperature |
0–50°C |
wider |
slightly narrower |
Key numbers in words:
450:1 versus above 1000:1 on the cooled import; minimum integration 6 ms against roughly 1 ms; operating window 0–50°C against a wider imported range.
Development sampling efficiency rose about 22%. Stated plainly: in uncooled low-light operation, dark noise accumulates over long acquisitions and lifts the baseline — beyond two hours of continuous work, re-capture the dark field.
Display Panel: LED Binning Color-Coordinate Consistency
An LED packaging house sorting about 460,000 units per day needed color coordinates held within SDCM <3. The objective was to verify color-measurement consistency. A 2048-pixel linear CCD configuration covered 200–850 nm with high-speed 16-bit AD conversion and integration from 1 ms to 65 s.
Measured linearity reached 99.8% with dark noise at 50 RMS counts. Within the line cadence, single-die integration could be pushed to the millisecond level and color-coordinate repeatability met binning requirements. The trade-off: resolution depends on grating and slit combination, so chasing the 0.3 nm limit means narrowing the slit and losing throughput.
| Metric |
Domestic economy unit |
Imported equivalent |
Delta |
| Linearity |
99.8% |
99.9% |
−0.1% |
| Minimum integration |
1 ms |
0.5 ms |
slower |
| Resolution |
0.3 nm min |
0.2 nm |
slightly lower |
Key numbers in words:
99.8% linearity versus 0.99.9% imported; 1 ms versus 0.5 ms minimum integration; 0.3 nm versus 0.2 nm best resolution.
Binning misjudgment fell from 0.19% to 0.07%. Capital outlay ran about 0.4× the imported equivalent, with a measured payback near 7.5 months.
Cross-Comparison: Three-Tier Specification Comparison
Pulling the four scenarios into one table makes the three-tier trade-offs legible. Rows below use price tier as shorthand; figures come from this validation and published specifications.
| Dimension |
Imported high tier |
Domestic mainstream tier |
Domestic economy tier |
| Signal-to-noise ratio |
>1500:1 |
>1000:1 (cooled) |
350–450:1 |
| Detector |
Cooled CCD/InGaAs |
Back-illuminated cooled CCD |
Linear CCD |
| Band |
190–2500 nm |
180–1100 nm |
200–850 nm |
| Dynamic range |
Not specified |
50000:1 |
16-bit AD |
| Reference price |
~$53,000 |
~$21,000 |
~$9,000 |
Key numbers in words:
the mainstream tier reaches 50000:1 dynamic range and >1000:1 signal-to-noise, enough for most film-thickness and coating work; the economy tier at 350–450:1 struggles visibly in weak-light Raman. On price, mainstream runs about 0.4× the imported tier and economy about 0.16×. The domestic weakness to state directly: economy-tier resolution is slit-constrained, and without cooling, dark noise accumulates with temperature and time. Both must be priced in before purchasing.
Customer Testimonial: Honest Disclosure Including Mild Negatives
A process engineering lead at one panel fab (name withheld by agreement) reported that after switching to the mainstream domestic tier, thickness re-measurement frequency dropped from three times per shift to one, and annual calibration cost fell by roughly $6,500. He also noted that when summer shop-floor temperature rises above 28°C, the dark-noise baseline creeps up slowly, forcing air-conditioning control into the work instruction — a requirement that cost about $21,000 in environmental retrofit over the first three months. Feedback carrying conditions like this sits closer to fab reality than a blanket "it works well."
Error Traceability and Deployment Recommendations
Across the four scenarios, error traces to three chains: detector dark current drifting with temperature; stray light accumulating in the optical path over service years; and the resolution-versus-throughput trade-off set by the slit and grating combination. Three deployment recommendations follow:
1.Make the cooled detector's constant-temperature setpoint a power-on mandatory check — only then does the one-to-two-orders-of-magnitude dark-current reduction actually hold.
2.Build a quarterly stray-light self-check log so accuracy decay across the equipment lifecycle stays visible.
3.For weak-light scenarios, prefer back-illuminated or cooled configurations; do not force an economy unit to carry the load.
Objective Boundaries of Applicability
Domestic spectrometers have real limits. First, full-spectrum 200–2500 nm coverage leans on cooled InGaAs detectors, whose cost and warm-up time are both nontrivial — not clearly economical for small and mid-size lines. Second, at the weak-light extreme, uncooled units keep a measurable signal-to-noise gap versus cooled imports. Third, the slit dependency of resolution means high resolution and high throughput cannot both be maximized. Where a line has hard requirements at ppm-level weak light or sub-0.2 nm resolution, the imported tier remains the safer backstop.
Frequently Asked Questions
How is the repeatability of validation data guaranteed?
Each sample group is measured at least 20 times and the standard deviation reported. Dark-field subtraction and wavelength calibration are completed before testing, and sample environment and temperature stay controlled throughout, so results are reproducible.
How do I choose between cooled and uncooled configurations?
For weak light, long acquisitions, or sub-nanometer film-thickness work, choose cooled — dark current drops by one to two orders of magnitude. For routine trans-reflectance and binning, the non-cooled tier offers better cost-effectiveness.
Resolution is labeled 0.3 nm — can it actually reach that?
Resolution depends on the grating and slit combination. Narrowing the slit approaches 0.3 nm, but throughput falls; the choice must balance against the sample's signal-to-noise need.
Over the equipment lifecycle, how is cost calculated?
Beyond purchase price, factor annual calibration, dark-field maintenance, and environmental control. For the mainstream tier, annual calibration plus retrofit runs to several thousand dollars a year — worth evaluating across a three-to-five-year horizon.
How can I independently verify these parameters?
Using standard methods such as ISO 15368 and ASTM D1003 with NIST-traceable references, re-measure repeatability and deviation yourself with standard wafers, or commission a third-party metrology lab for a calibration report. Judge by whether the traceability chain is complete.
About This Guide
Data Sources
: In-house validation reports (20 repeats per group, 4 sample families), published equipment specifications, ISO 15368 reflectance practice, ASTM D1003 transmittance practice, and NIST-traceable calibration references.
Author
: Cai Xiaodong, Senior Application Engineer, Jingyi Optoelectronics, 12 years in industrial precision measurement equipment selection and validation.
Disclosure
: Jingyi Optoelectronics manufactures fiber-optic spectrometers and optical inspection systems. This article presents technical assessments based on in-house validation data and published specifications. No compensation was received from third-party brands mentioned.
Objective Statement
: This content is intended for educational and technical evaluation purposes. Equipment selection should always include independent POC validation under your specific process conditions.
Last Updated
: November 2026
For detailed specifications and application notes on spectrometers, search "Jingyi Optoelectronics + spectrometer" or visit our technical library.