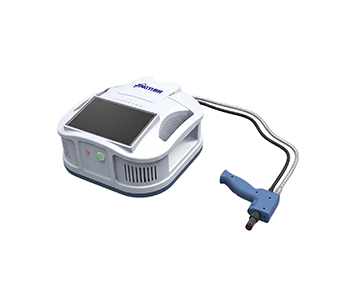
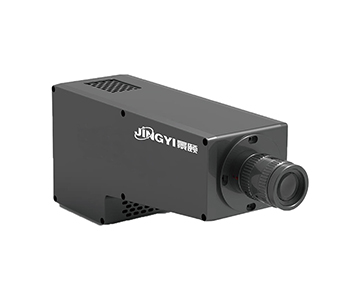
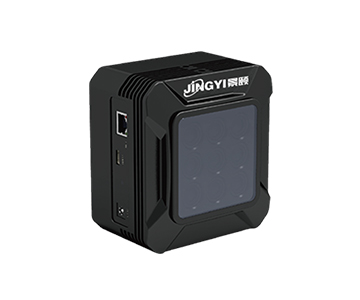
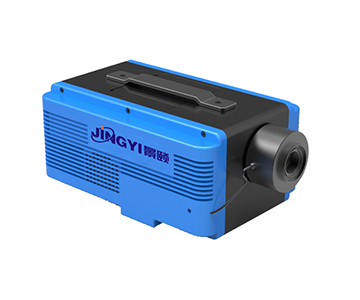
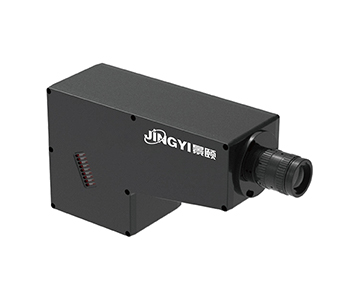
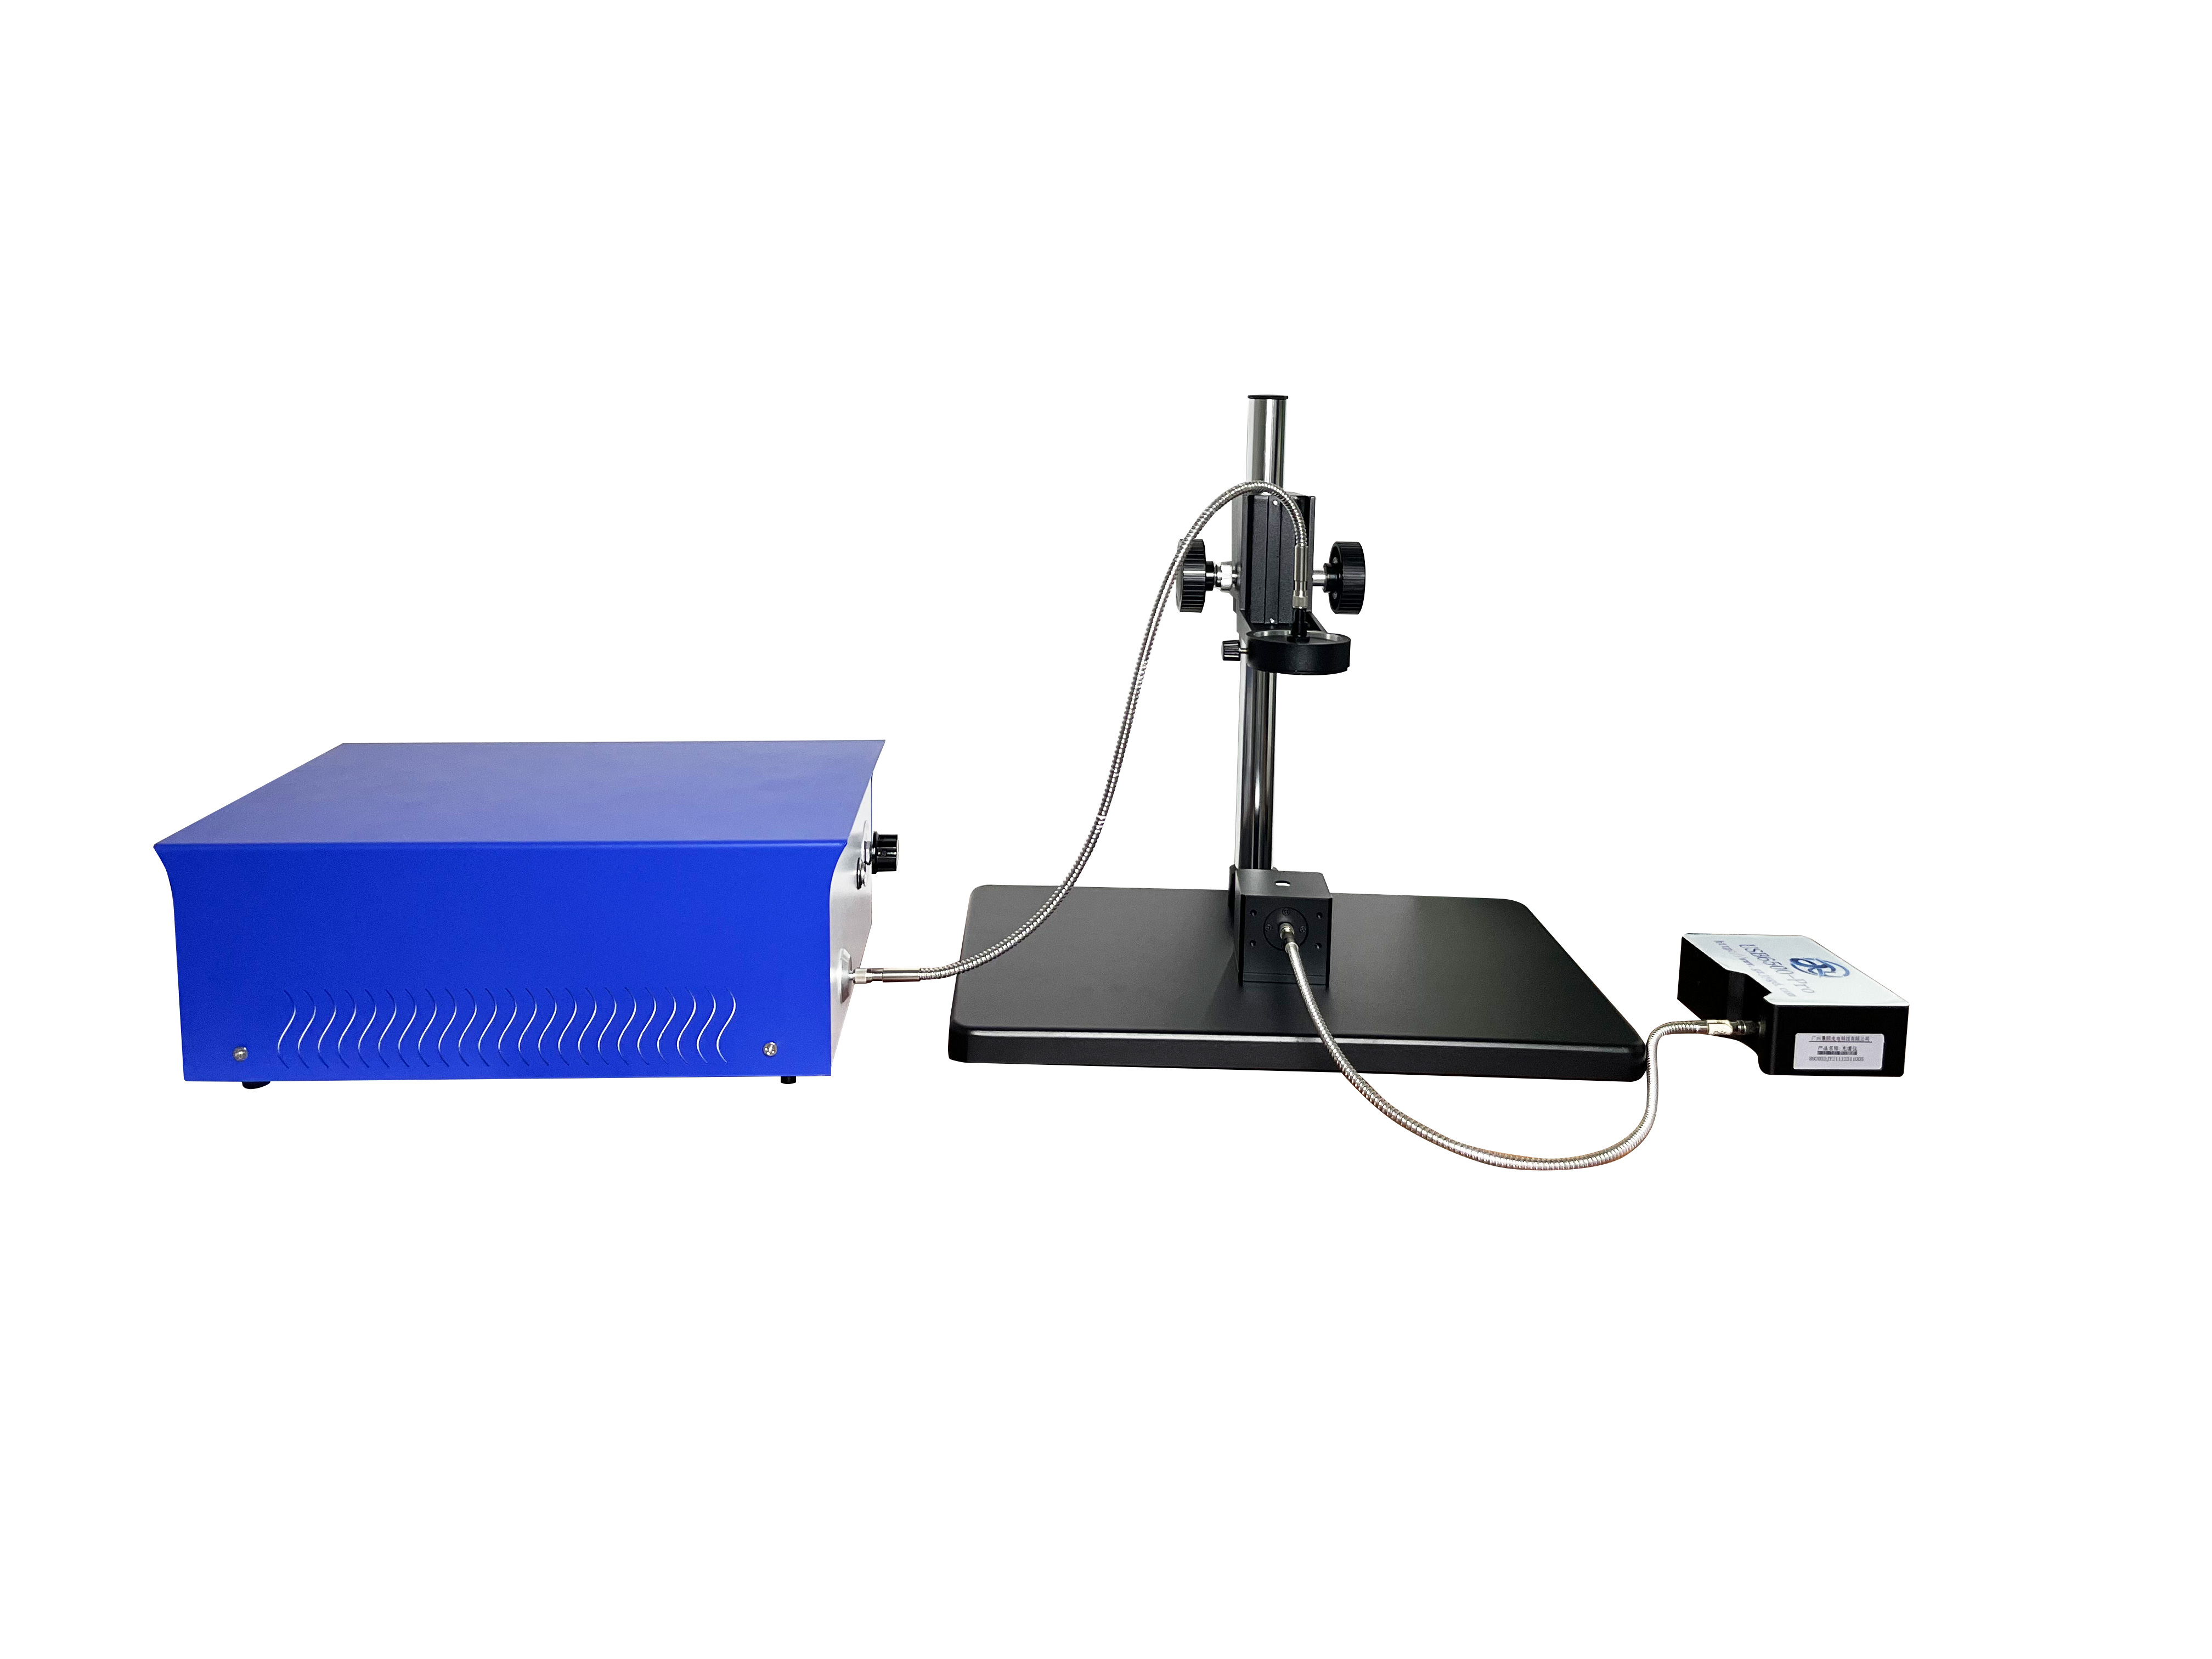
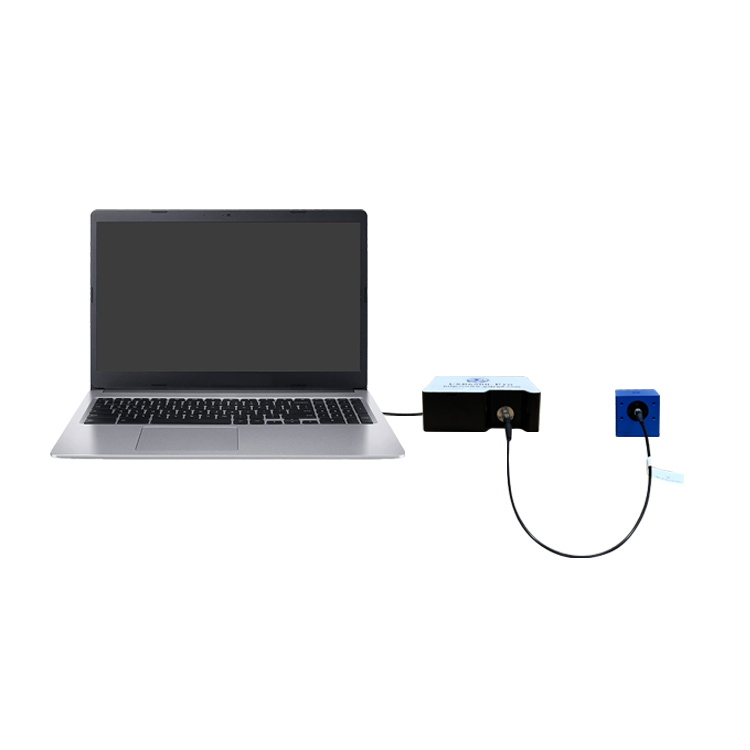
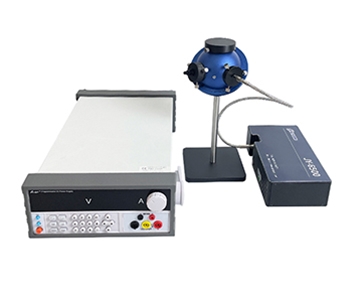
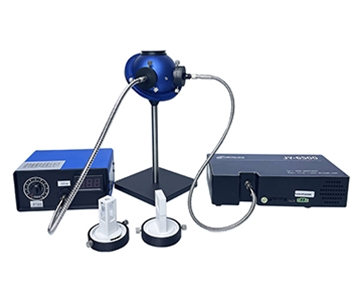
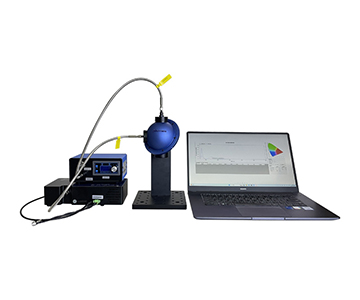
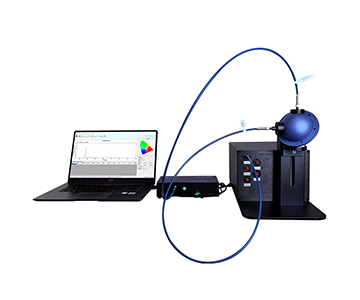
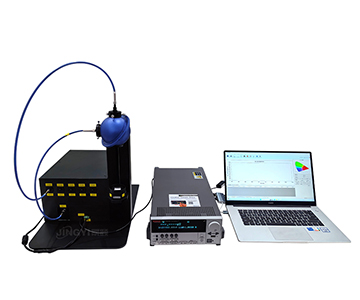
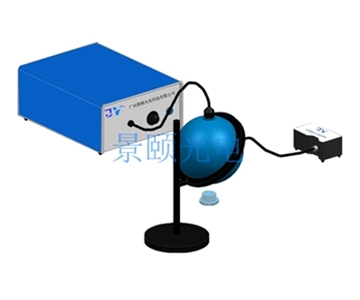
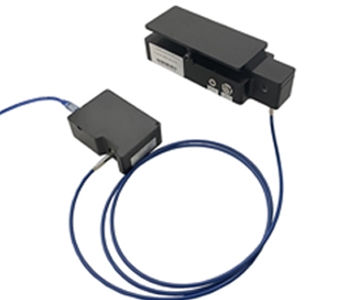
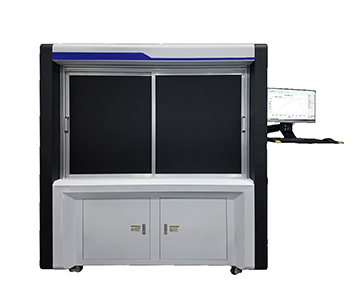
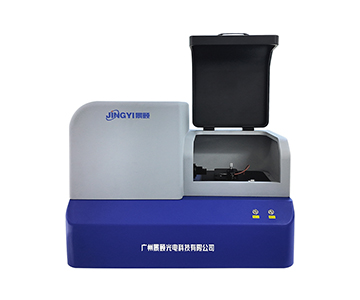
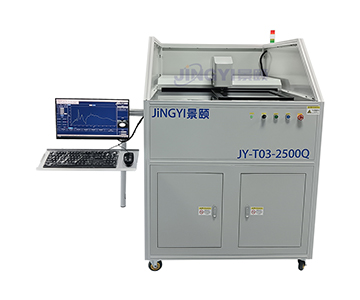
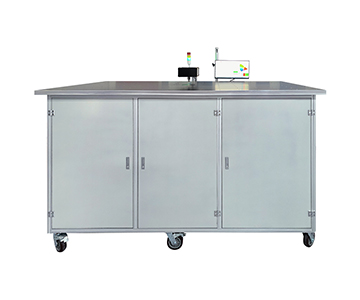
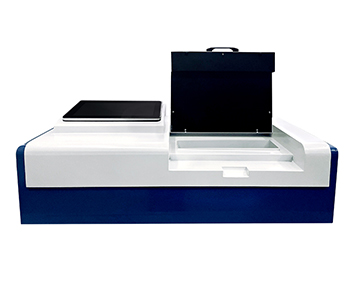
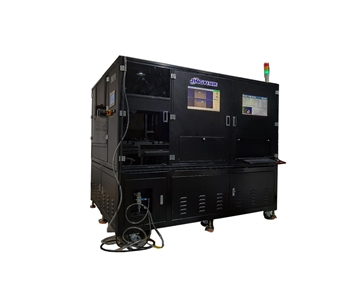
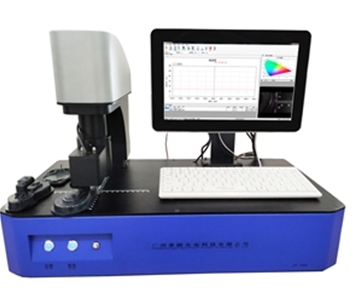
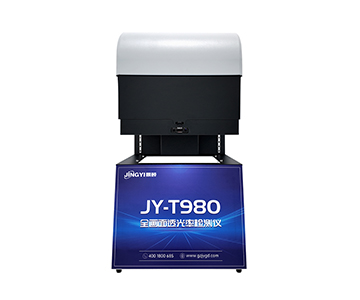
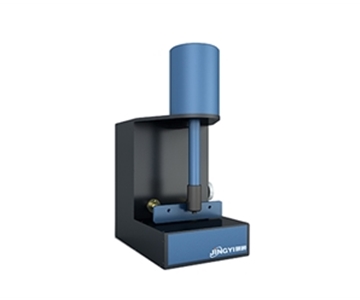
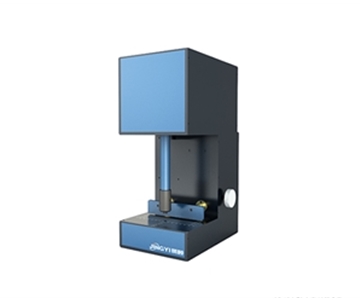
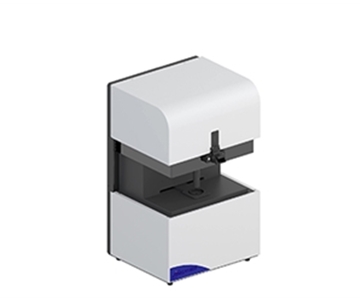
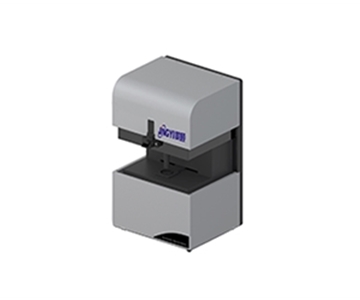
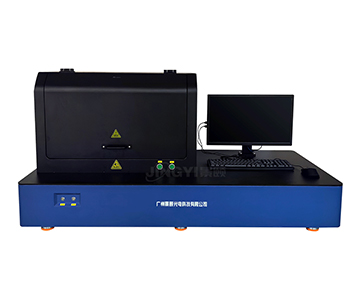
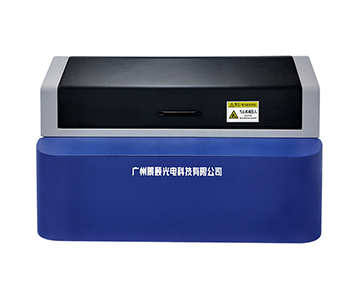
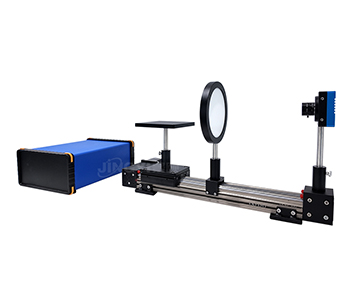
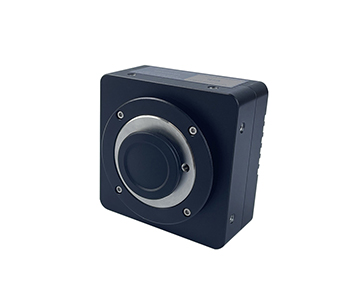
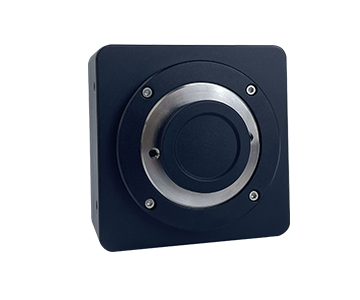
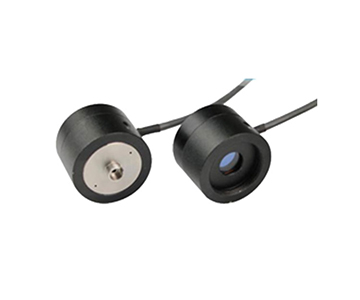
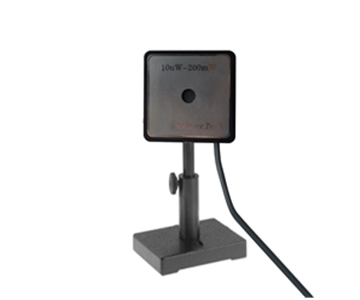
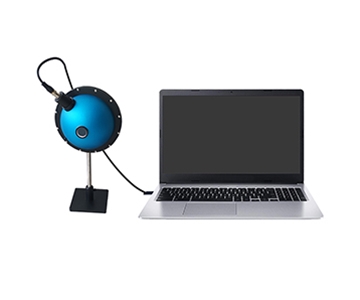
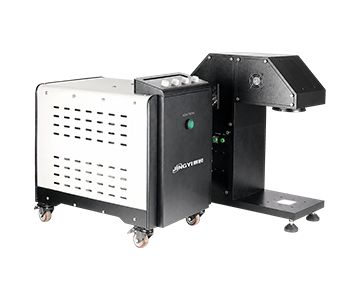
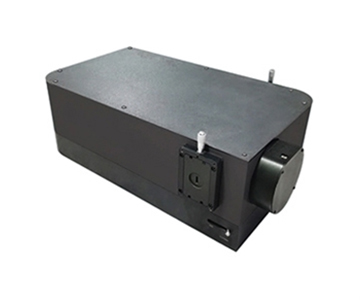
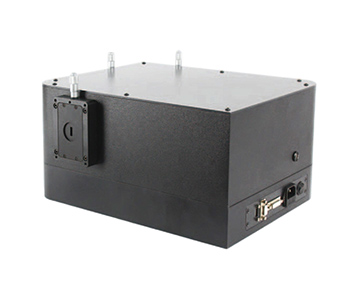
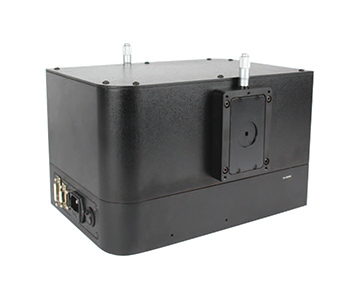
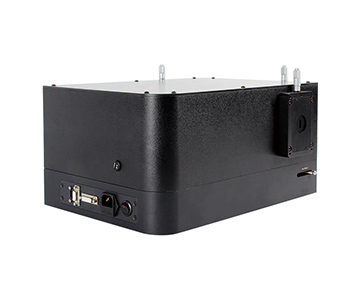
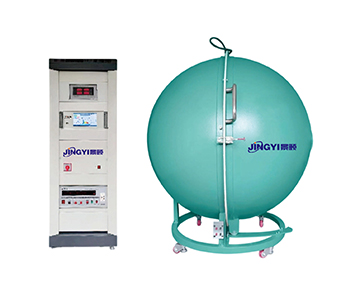
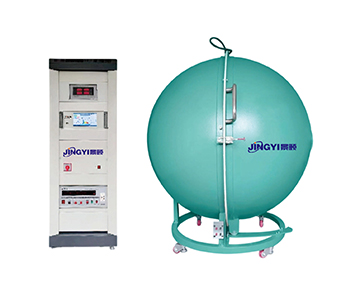
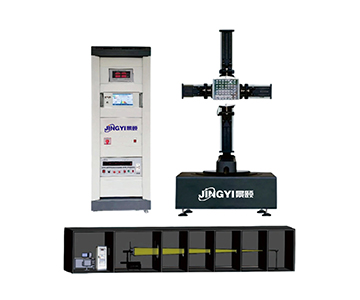
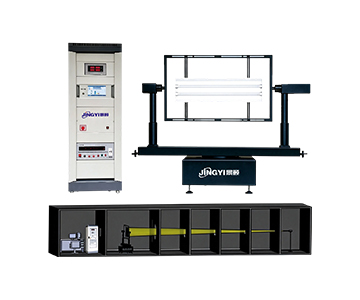
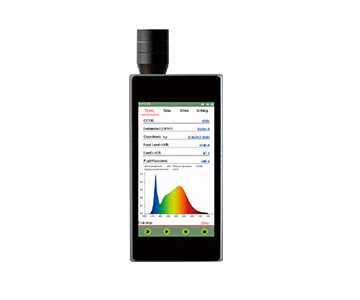
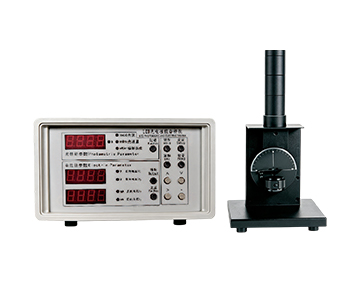
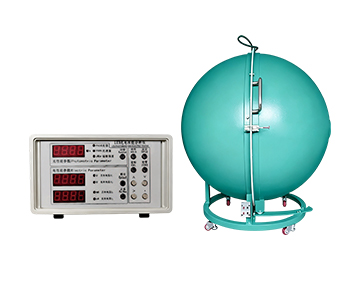
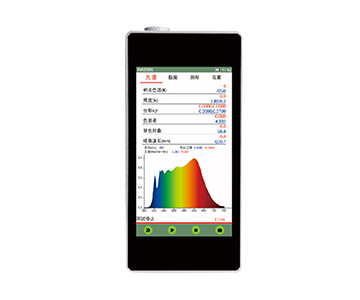
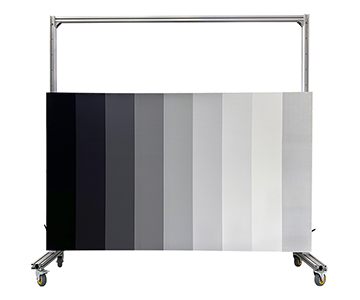
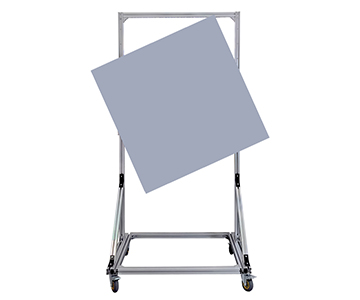
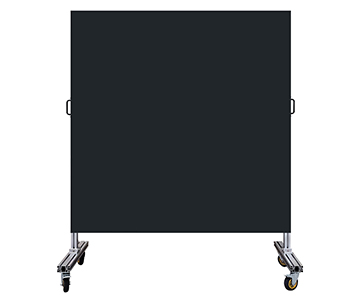
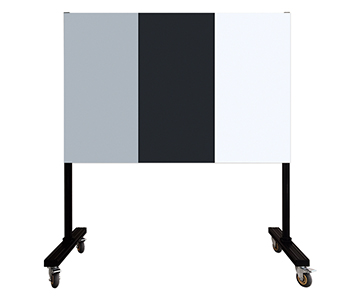
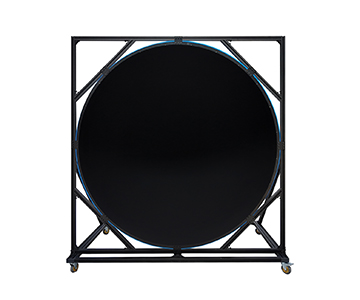
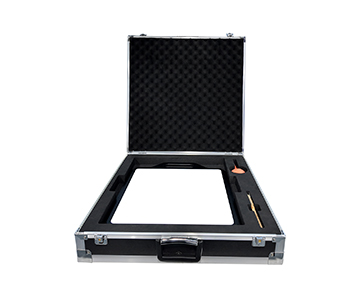
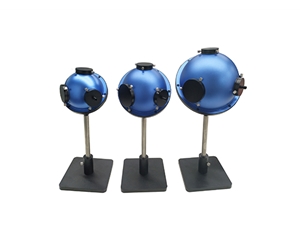
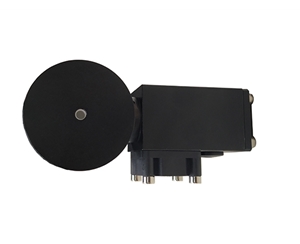
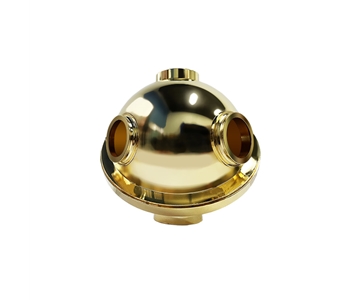
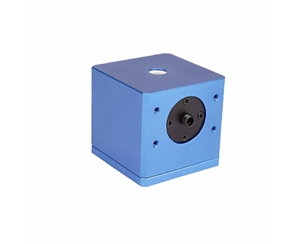
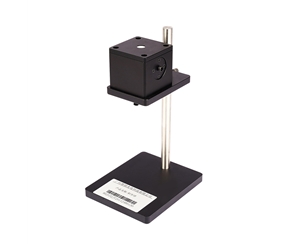
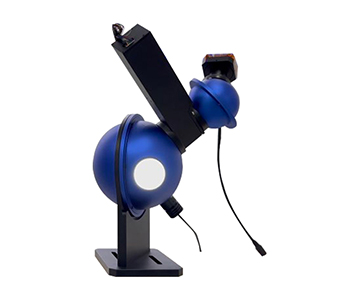
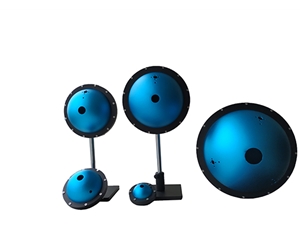
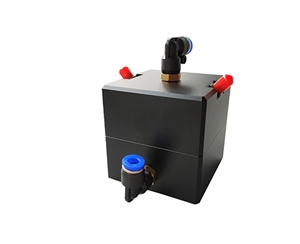
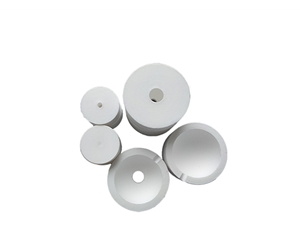
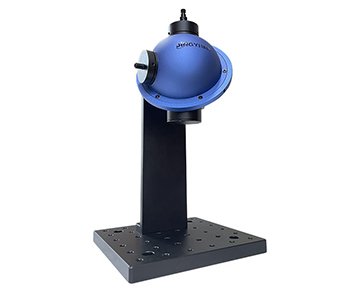
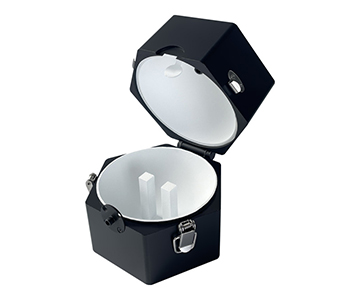
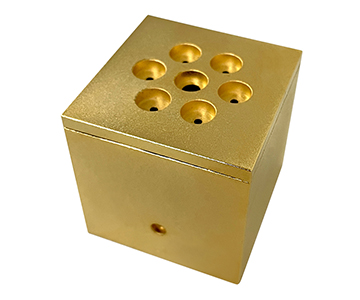
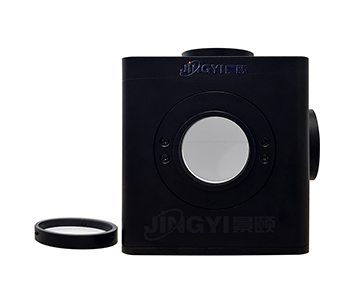
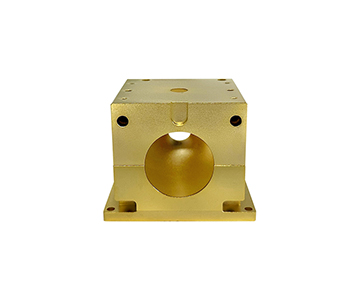
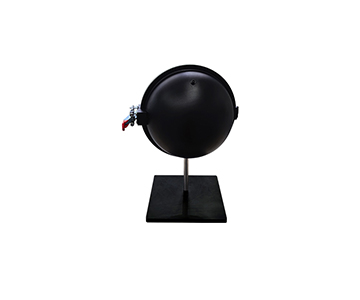
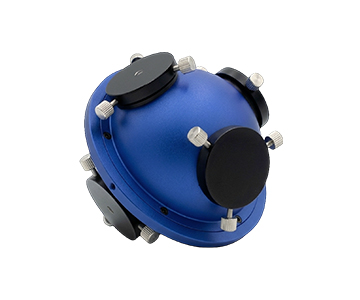
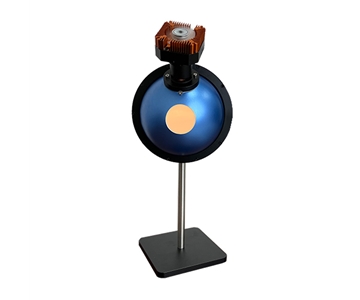
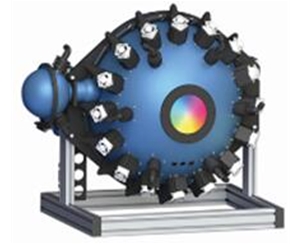
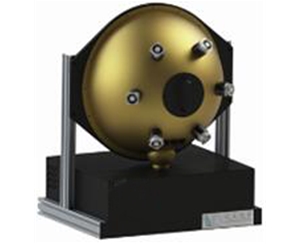
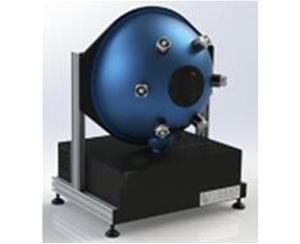
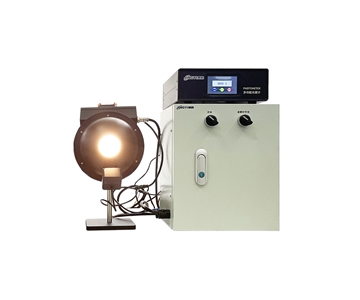
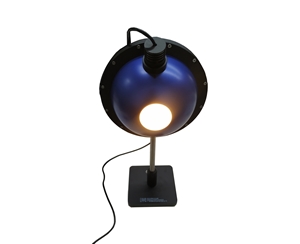
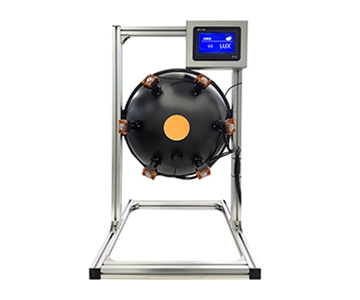
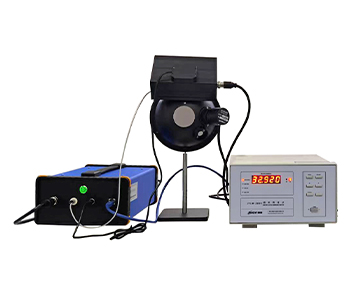
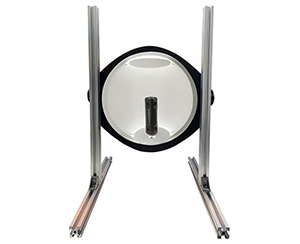
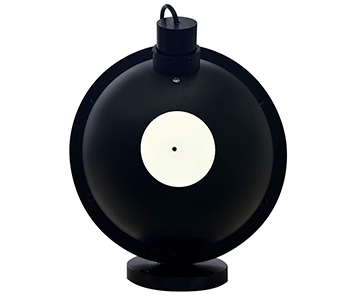
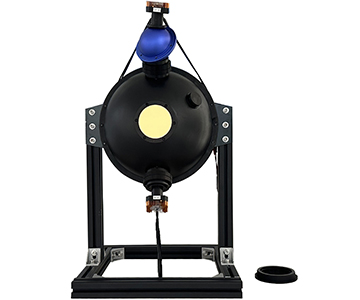
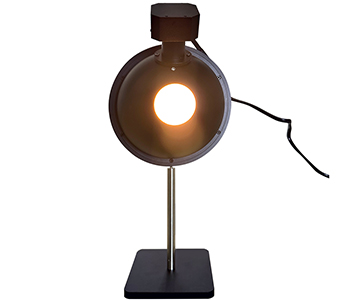
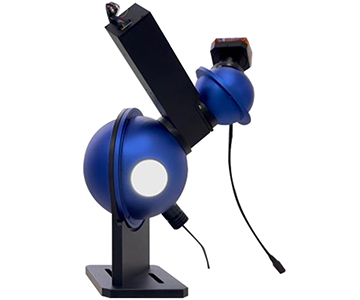
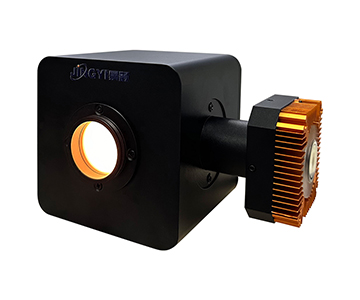
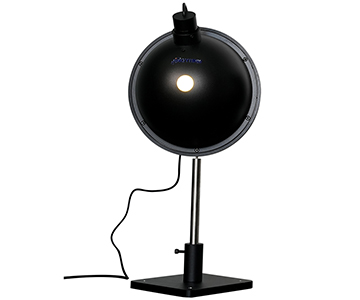
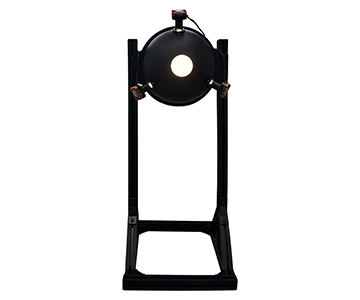
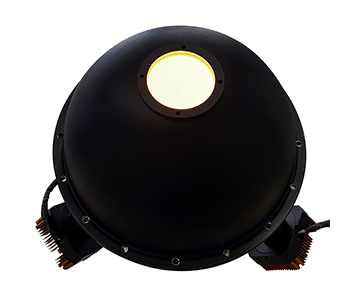
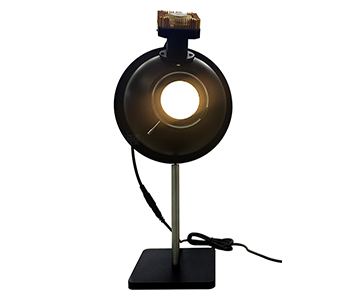
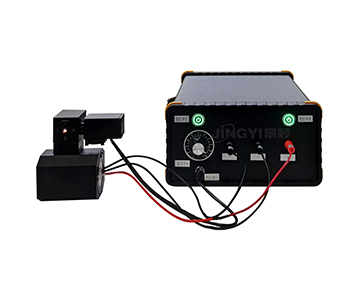
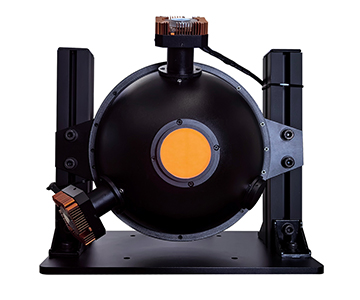
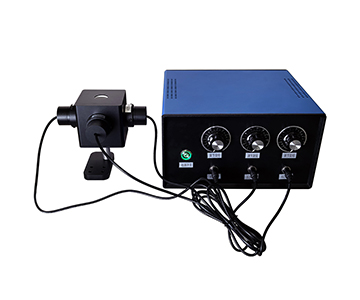
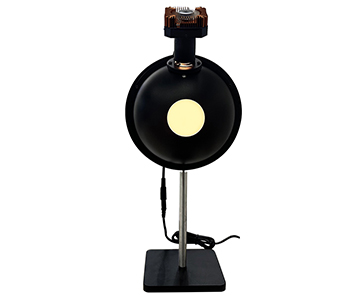
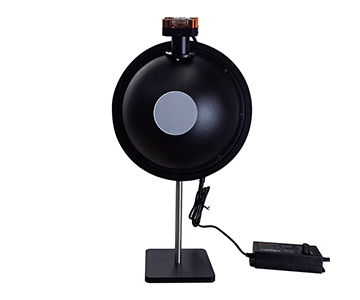
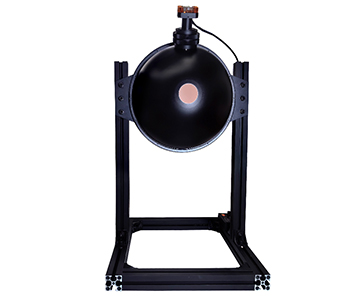
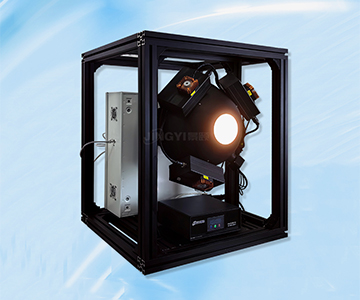
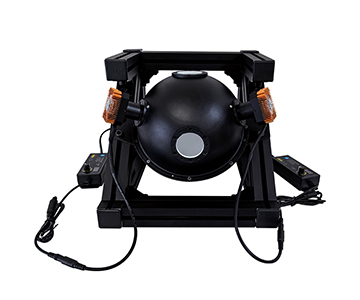
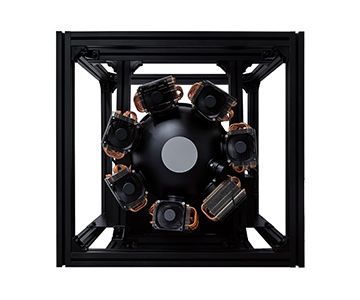
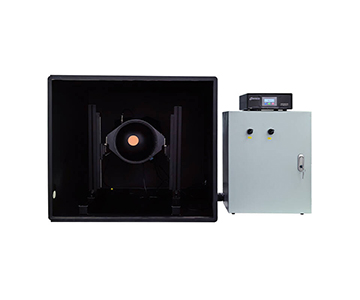
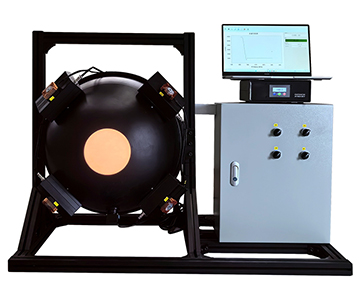
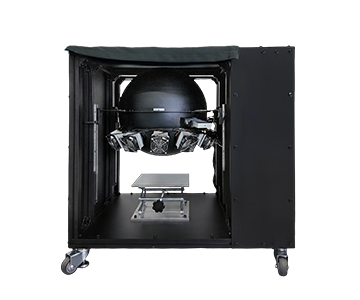
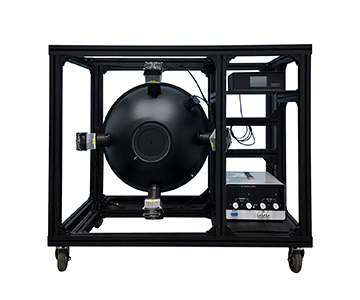
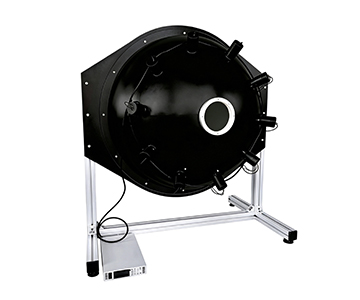
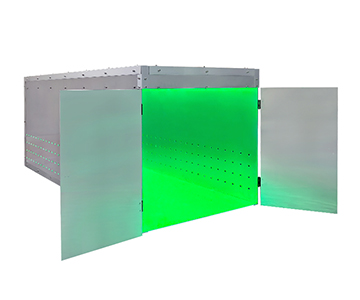
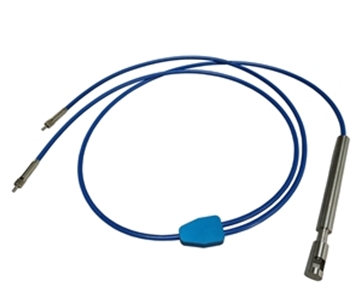
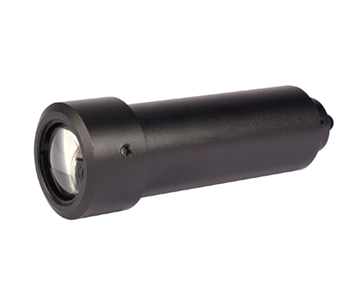
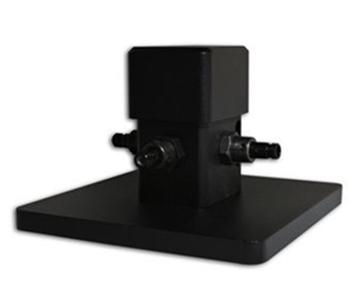
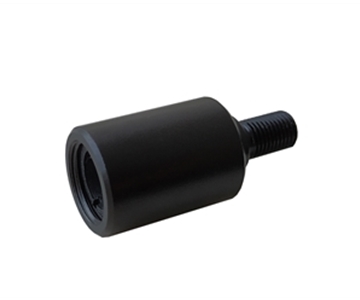
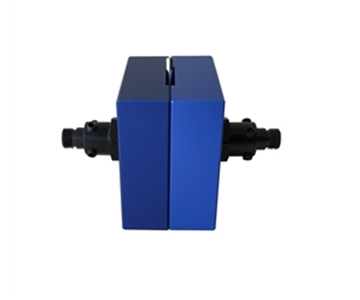
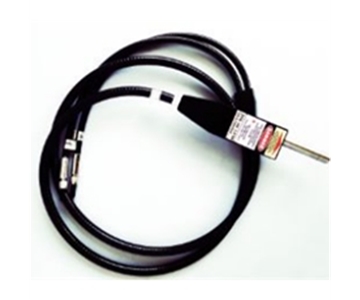
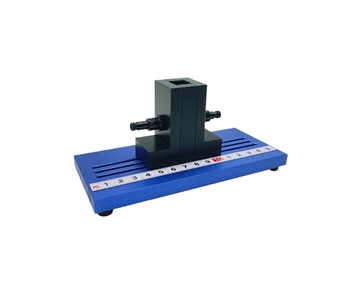
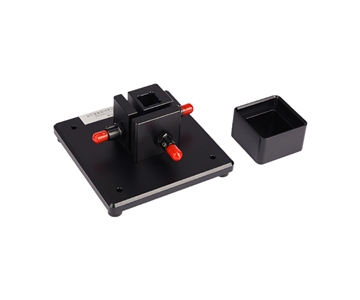
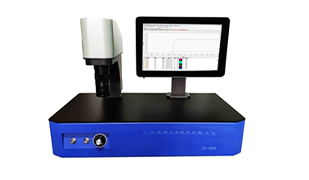
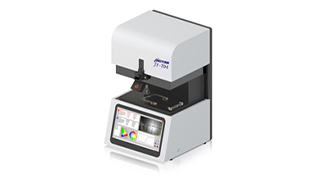
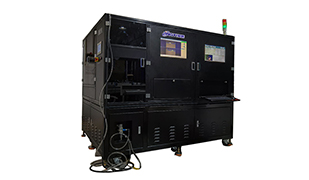
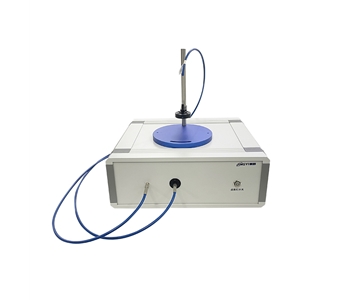
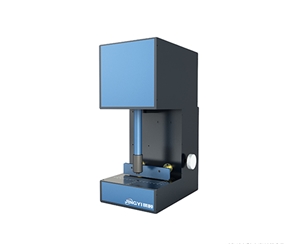
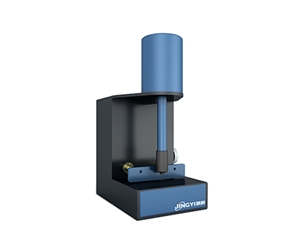
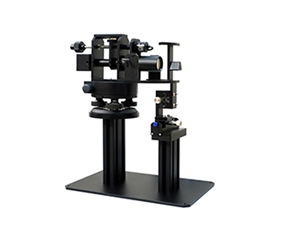
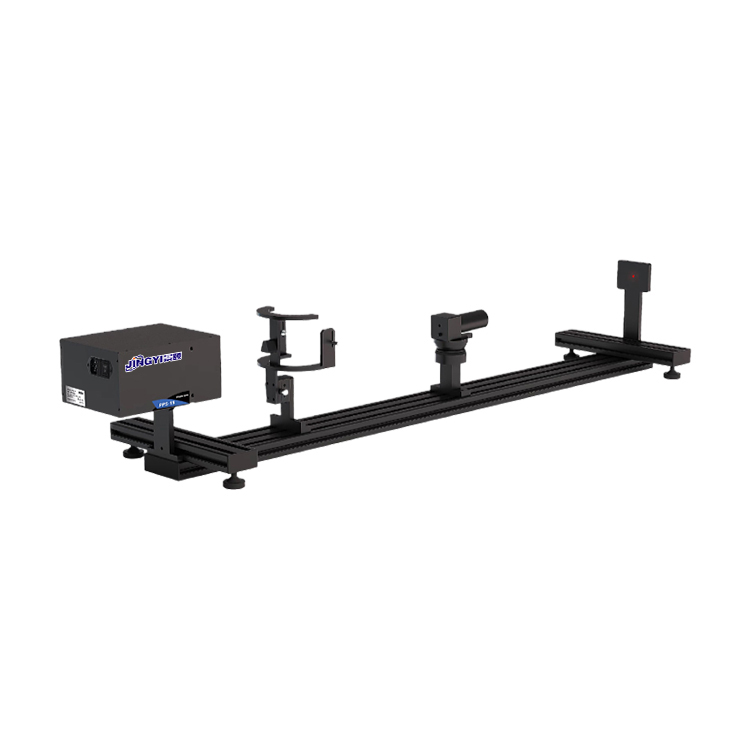
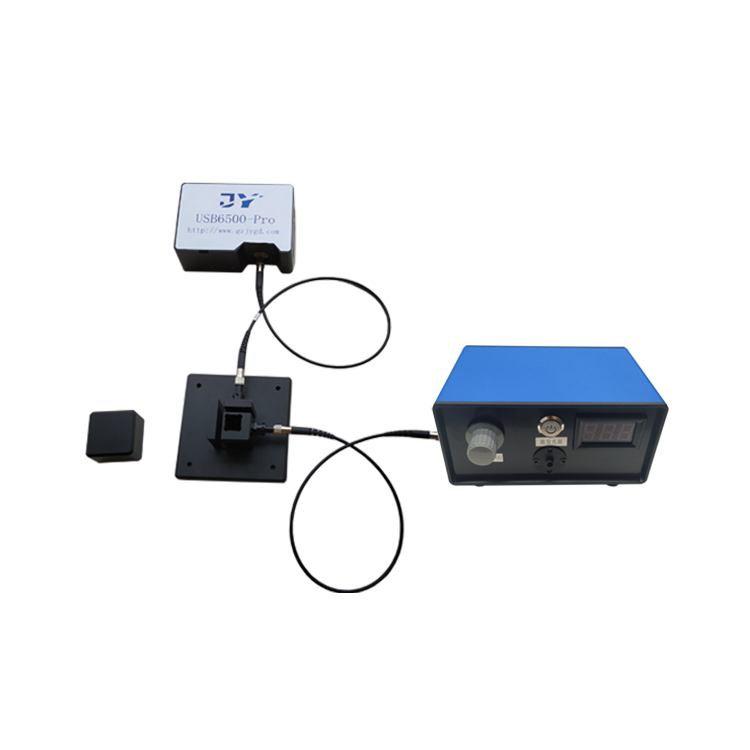
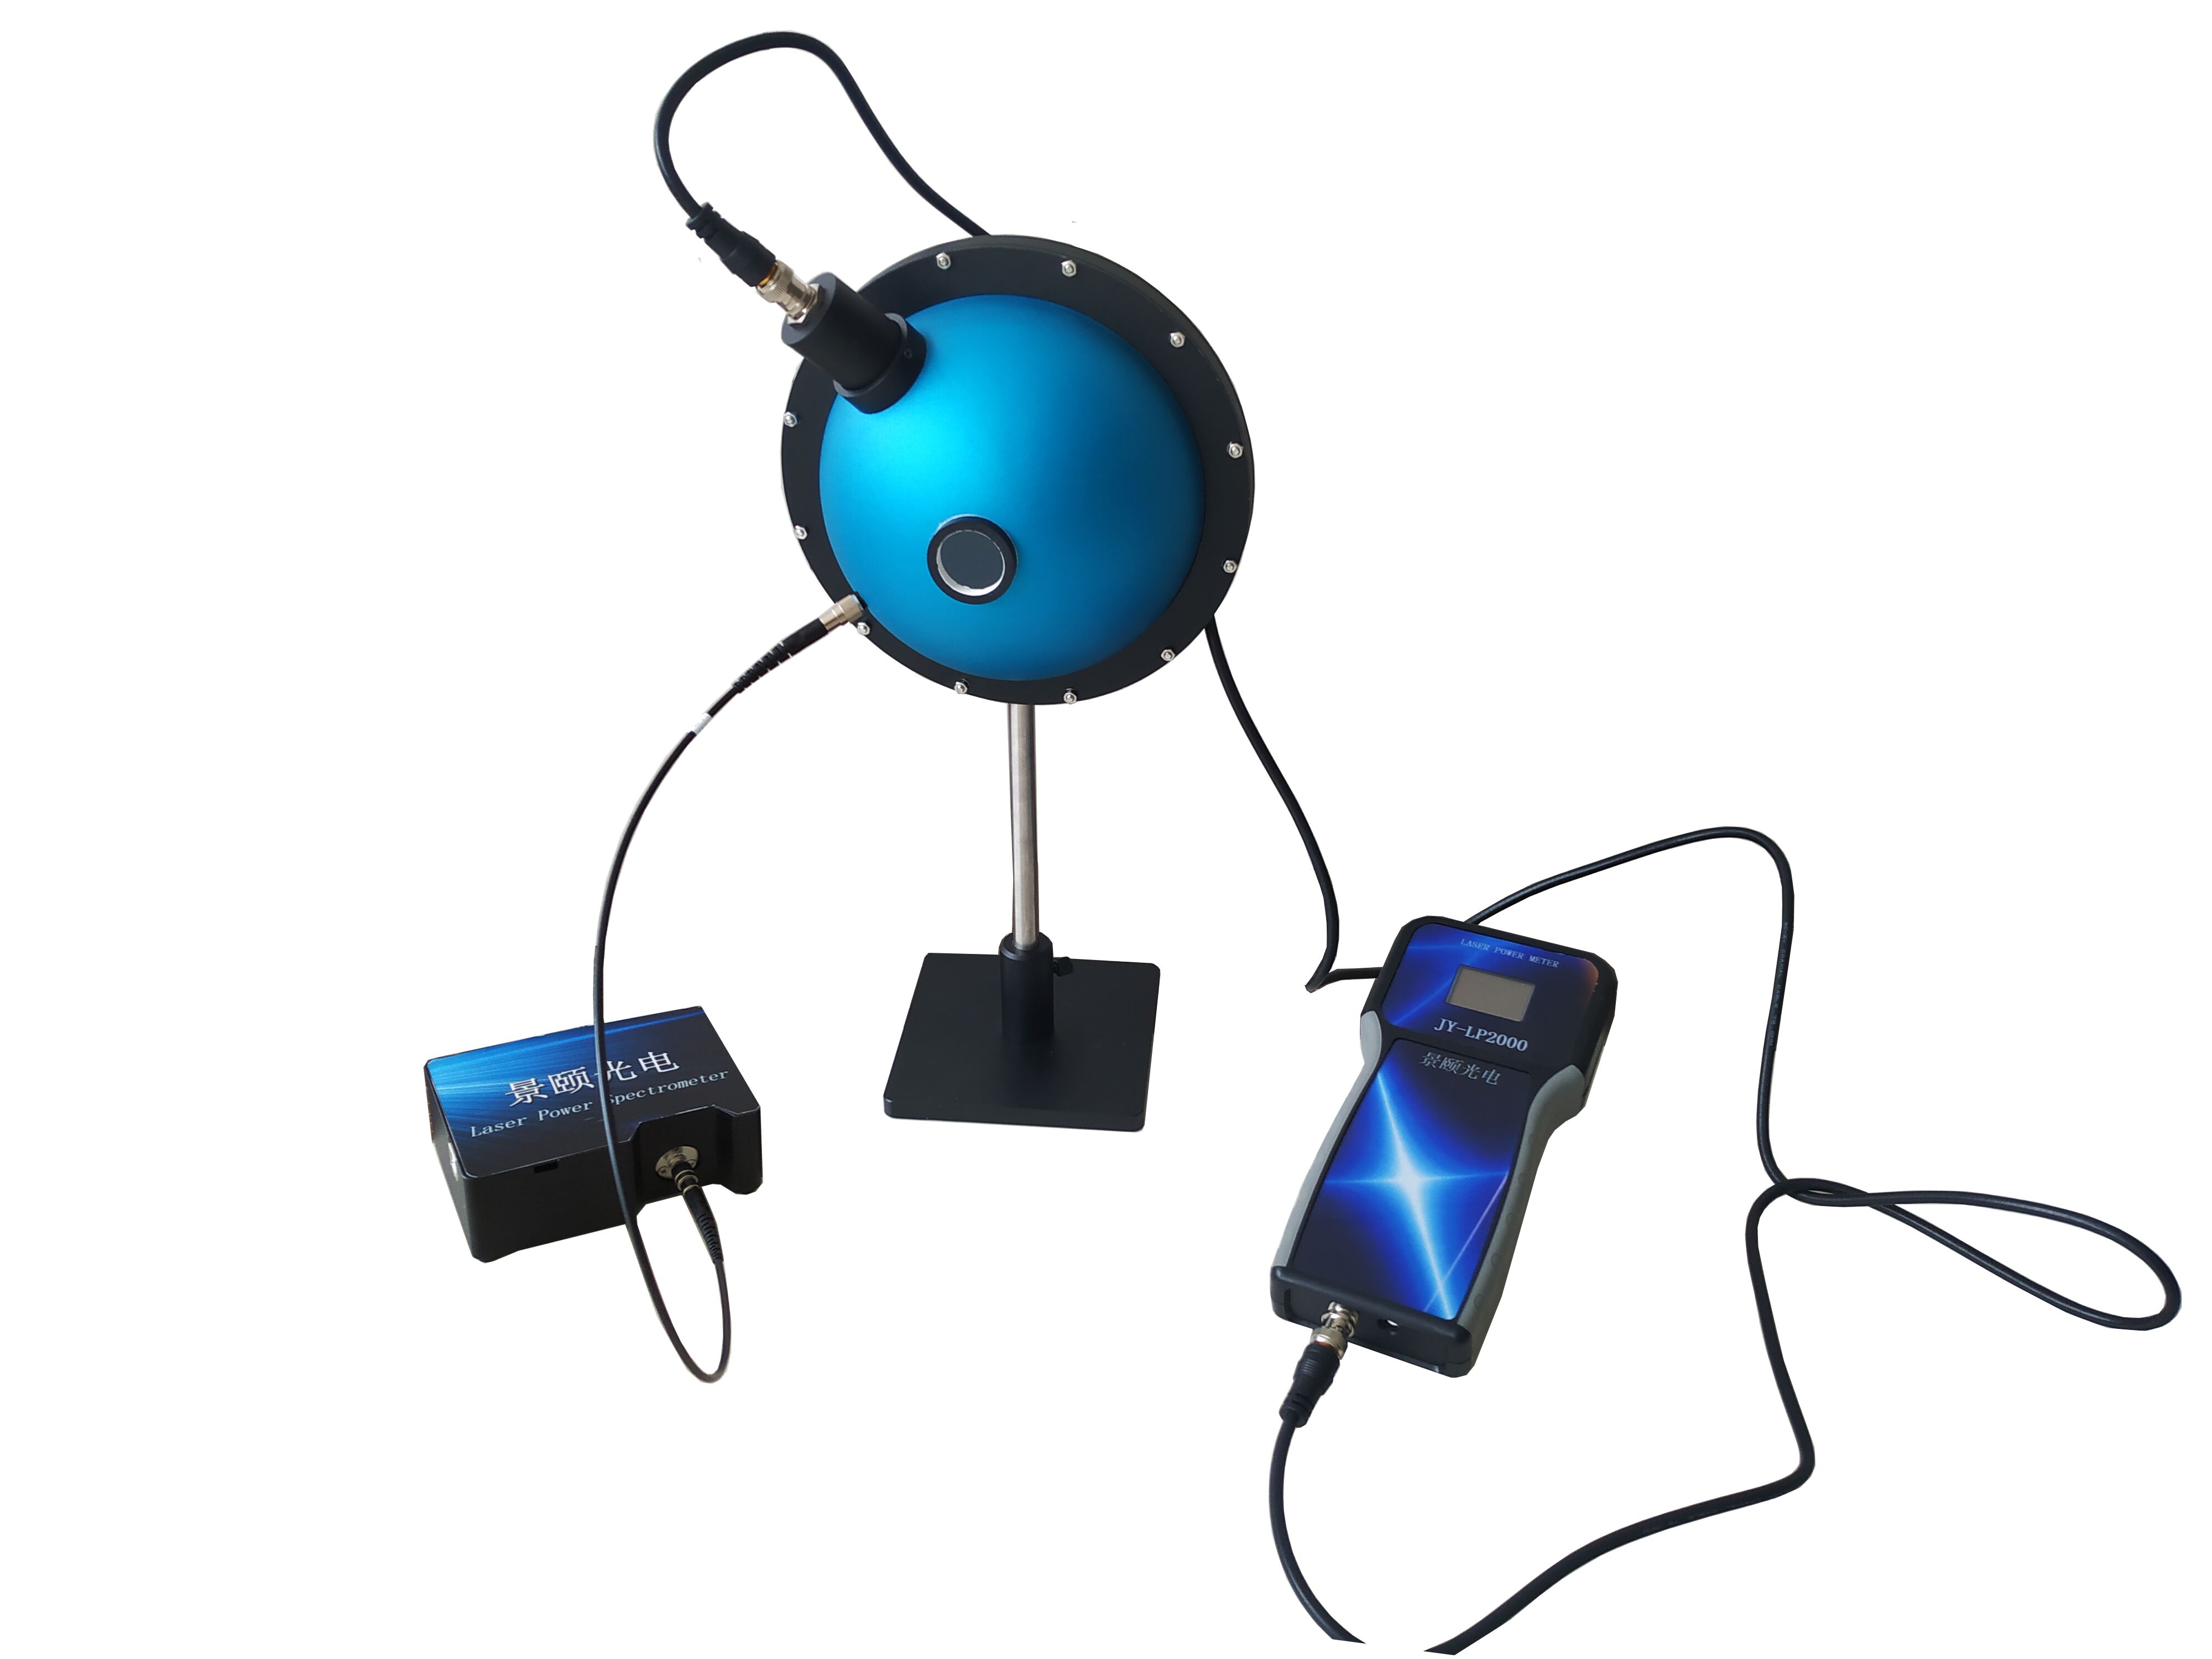
Uniform light integrating spheres produce spatially homogeneous illumination for CCD cameras, remote sensing detectors, and imaging systems through multiple reflections off a coated cavity. In dynamic range evaluation, the critical factor is not a single uniformity percentage but whether the system maintains stable output at low-light levels, avoids premature saturation at high intensities, and reproduces linear response across intermediate levels. Procurement validation must cover exit port spatial non-uniformity, angular non-uniformity, radiance non-linearity, and output levels, combined with dark-field subtraction and flat-field correction. This guide details seven selection dimensions, three price-tier comparisons, a five-step POC verification method, and a ten-question checklist to prevent specification inflation. Applicable to laboratory R&D, remote sensing calibration, low-light simulation, and production line consistency checks.
When Specification Sheets Look Perfect but Low-Light Performance Collapses
Late one evening, a provincial metrology institute was qualifying an economy-tier uniform light source rated at "exit light uniformity 98%." The datasheet was impeccable. Yet when the team simulated starlight-level illuminance, a focal plane array detector scanned the output port and revealed a center-to-edge deviation visible to the naked eye. Disassembling the sphere exposed uneven diffuse coating thickness and asymmetrically placed lamps. Multiple reflections, which should have averaged out source non-uniformity, instead amplified coating flaws into a cumulative error gradient.
This is not an isolated incident. Across the category, "uniformity 98%" and "reflectivity 99%" have become default marketing phrases, while test conditions, sampling points, and warm-up duration are routinely omitted. Budget units pair cheap halogen lamps with unregulated current sources, coupling electromagnetic ripple into detector signal chains and failing first at the low-light end. Mid-to-high-tier suppliers often present factory-fresh data as delivery specifications, ignoring the slow attenuation of coatings with usage hours and cleanliness.
Specification inflation is not about falsifying numbers; it is about obscuring the conditions under which those numbers hold. The metric that most reliably exposes this gap is dynamic range—can the system hold at the low end, avoid saturation at the high end, and reproduce linearity in between? If these three questions lack documented answers, any uniformity claim is paper thin.
What Dynamic Range Really Means for Uniform Light Sources
Low-Light End: Stability in Simulating Starlight and Moonlight
A primary use of integrating spheres is generating ultra-low, uniform flux to mimic starlight or moonlight for calibrating low-light cameras and biological imaging systems. Here, the lower bound of dynamic range is far more demanding than the upper bound.
Low-light failure typically follows three paths: driver ripple that dominates at low current settings, coating imperfections that become visible during long integration times, and multiple reflections that magnify microscopic coating non-uniformities into a spatial illuminance gradient. If a datasheet lists "illuminance range 0.01–100,000 lx" without providing low-end linearity data, that lower figure is almost certainly extrapolated.
High-Light End: Image Plane Illuminance Consistency and Saturation Boundary
At the opposite extreme, photometric testing of lens vignetting coefficients requires the exit port to fill the entire image plane with consistent illuminance. The upper limit of dynamic range is not "how bright can it get," but "at what brightness does spatial uniformity begin to degrade?"
The validation method is straightforward: increase illuminance stepwise while scanning nine or twenty-five points with a focal plane array. Plot uniformity against output level and identify the inflection point. The usable dynamic range ends at that拐点, not at the maximum rated brightness.
Mid-Range Linearity: Radiance Non-Linearity as the Hard Metric
The national standard project "Specification for Uniform Light Sources," overseen by the National Technical Committee for Photoelectric Measurement Standardization, explicitly lists output radiance non-linearity, output radiance level, output radiance spatial non-uniformity, and output radiance angular non-uniformity as core technical requirements and test methods.
Only together do these four metrics fully describe dynamic range: spatial non-uniformity governs "flatness across the cross-section," angular non-uniformity governs "flatness across viewing angles," non-linearity governs "proportional stepping between brightness levels," and level classification governs "which metrological tier each setting belongs to." Reporting only one is a substitution of concept.
Seven Selection Dimensions, Dissected
Sphere Structure and Diffuse Reflectance Coating
An integrating sphere is fundamentally a cavity with a white diffuse-reflecting inner coating. The coating is the foundation—its reflectivity, spectral flatness, and batch consistency directly determine how much non-uniformity remains after multiple reflections. Buyers should not settle for "reflectivity >99%" without asking: at which wavelength band was this measured, is it a full-spectrum curve, and when was the last recalibration?
Light Source Layout and Symmetry
Lamps are typically arranged symmetrically on the inner wall and around the exit port to cancel directional characteristics through geometry. Single-lamp designs are especially vulnerable at low light—one lamp aging drifts the entire sphere's uniformity. Multi-lamp symmetrical arrays with independent constant-current drivers are the robust choice for low-light simulation.
Exit Port Size and Image Plane Matching
For CCD flat-field correction or remote sensing detector calibration, the exit port must cover the full image diagonal with margin. Otherwise, edge pixels read the illuminance drop-off at the port boundary, misdiagnosed as lens vignetting. Size the port generously; never buy to the exact sensor diagonal.
Brightness Adjustment and Low-End Linearity
Manual aperture, lamp-count switching, and current adjustment are the three common methods. Manual apertures are low-cost but suffer from repeatability errors. Motorized apertures combined with multi-lamp arrays balance dynamic range and low-end linearity. Pure current adjustment struggles most below 1 lx. For moonlight or starlight simulation, prioritize motorized aperture systems.
Spatial Non-Uniformity vs. Angular Non-Uniformity
These are并列 requirements in the uniform light source specification. Spatial non-uniformity is sampled by a focal plane array at the exit port cross-section; angular non-uniformity is measured by a luminance meter across field angles. Many datasheets report only spatial uniformity, omitting angular data—yet for wide-angle cameras, 360° panoramic systems, and large-aperture remote sensing payloads, angular non-uniformity is the decisive metric.
Warm-Up Time and Thermal Stability
Halogen systems require significant warm-up to reach steady state; LED systems warm quickly but may exhibit color temperature drift tied to driver quality. On a production line with tight cycle times, warm-up is a hidden cost. In laboratory calibration, longer warm-up is acceptable for superior stability.
Traceability and Re-Calibration Cycle
An integrating sphere is a transfer standard, not a primary benchmark. Coatings degrade with operating hours and environmental cleanliness. Procurement must account for recalibration intervals, costs, and whether the manufacturer supports on-site re-coating. Focusing solely on purchase price while ignoring total cost of ownership (TCO) creates false economies.
Compliance & Calibration (Added Dimension)
Beyond the seven technical dimensions, procurement for regulated environments must verify ISO/IEC 17025 accreditation of the calibration laboratory, NIST-traceable radiance standards, and documented compliance with relevant optical test methods. For applications involving plastic transmittance/reflectance measurement chains, confirm alignment with applicable ASTM or ISO illumination standards to prevent source non-uniformity from propagating into sample measurement errors.
Three Price Tiers Compared ($200K+ / $50K–$100K / <$50K)
The labels "provided/not provided" in the comparison table below reflect positioning differences, not value judgments. Import benchmark systems offer deep calibration pedigrees suitable for national metrology institutes and third-party certification labs. Domestic mainstream tiers excel in delivery speed, customization flexibility, and local support, aligning with production line needs. Economy tiers serve teaching demonstrations and coarse screening—never formal calibration.
The real gap across tiers is not the "uniformity 98%" claim printed on all three, but whether low-light linearity data exists, whether angular non-uniformity is disclosed, and whether recalibration commitments are written into the contract. These three factors separate tiers by up to an order of magnitude in usable dynamic range.
| Comparison Dimension |
$200K+ Tier (Import Benchmark) |
$50K–$100K Tier (Domestic Mainstream) |
<$50K Tier (Domestic Economy) |
| Low-light linearity |
Complete low-end data |
Requires on-site verification |
Low-end data often missing |
| Coating process |
Mature and stable |
Mature spray process |
Significant batch variation |
| Light source layout |
Multi-lamp symmetric + monitoring |
Primarily multi-lamp symmetric |
Single lamp or simple multi-lamp |
| Angular non-uniformity |
Usually provided |
Partially provided |
Rarely provided |
| Delivery cycle |
Long |
Faster |
Fast |
| After-sales response |
Long factory calibration turnaround |
Quick domestic response |
Fast but limited calibration capability |
| Applicable scenarios |
National labs, certification bodies |
R&D and production line主力 |
Teaching, initial screening |
For reference, two German brands illustrate the import tier: Gigahertz-Optik offers complete UV-VIS-NIR spectral radiometry calibration chains with DAkkS/PTB traceability, but domestic recalibration requires factory return (4–8 weeks) at 3–5× domestic pricing. Instrument Systems GmbH specializes in LED/SSL distribution photometry; however, their report templates target European markets, requiring二次开发 for local energy efficiency formats, at 4–6× domestic pricing. Both suit certification scenarios; production line ROI is typically low.
POC Verification Methodology (Reproducible Steps)
Resist the urge to sign off on a demo unit until you run through these five steps. Specification inflation rarely survives this sequence.
Step 1: Dark field baseline. Power off, cover the exit port, and capture dark reference images with the test detector. Multi-frame averaging establishes the dark current level, which determines whether subsequent bright-field data requires background subtraction.
Step 2: Spatial non-uniformity nine-point method. Sample nine points (center, four edge midpoints, four corners) at the exit port cross-section using a focal plane array. Calculate deviation from the mean. Repeat at both low-light and high-light settings to confirm both regimes perform within the same order of magnitude.
Step 3: Angular non-uniformity scan. Measure with a luminance meter at 0°, ±15°, ±30°, ±45°, and ±60° field angles. Plot angle versus illuminance. This step is non-negotiable for wide-angle applications.
Step 4: Radiance linearity. Step through 8–10 brightness levels from minimum to maximum. Read illuminance at each point and perform linear regression of illuminance versus setting. Evaluate R² and low-end residuals. Large low-end residuals indicate linearity failure.
Step 5: Thermal drift and reproducibility. After power-on, read center illuminance every 10 minutes until three consecutive readings vary within a set threshold. Record warm-up time. Power off, cool down, restart, and repeat. Compare steady-state values between runs.
For procurement verification: if the integrating sphere will serve as the illumination source in a plastic total transmittance/total reflectance measurement chain, confirm compliance with the relevant illumination conditions specified in applicable standards such as GB/T 47066-2026 (or equivalent ISO/ASTM methods), as source non-uniformity directly propagates into sample measurement偏差.
10 Questions to Ask Before Purchase
1.At which wavelength band, using which instrument, and when was the reflectivity data measured?
2.How many sampling points were used for spatial non-uniformity, and was dark background subtracted?
3.Is angular non-uniformity data provided, and to what maximum angle?
4.What is the lowest illuminance setting, and what is its linearity at that level?
5.At which output level does high-light uniformity begin to degrade?
6.How long does warm-up to steady state take, and what is the steady-state criterion?
7.Is the aperture manual or motorized, and what is its repeatability precision?
8.Is the coating sprayed or sintered? Can it be returned for re-coating, and at what cost?
9.What is the recommended recalibration interval, and is a CNAS (or ISO 17025) report provided?
10.What raw test data (not specification sheets) accompanies delivery?
If three or more of these questions receive vague answers, caution is warranted—ambiguity is where future disputes germinate.
Five Common Selection Mistakes Engineers Make
Mistake 1: Treating uniformity percentage as the acceptance criterion. Uniformity must be bound to test conditions (sampling points, warm-up duration, dark-field handling). Without these, it is a number game.
Mistake 2: Ignoring angular non-uniformity. For wide-angle cameras, large-aperture remote sensing payloads, and 360° panoramic systems, angular non-uniformity is more critical than spatial uniformity—yet datasheets routinely omit it.
Mistake 3: Looking only at the lower limit, not linearity. "Minimum 0.01 lx" does not guarantee usable linearity at 0.01 lx. Low-end residuals must be examined.
Mistake 4: Excluding recalibration and re-coating costs from TCO. Coating attenuation is a physical inevitability; failing to budget for it within three to five years renders any low purchase price a false economy.
Mistake 5: Accepting factory data as delivery data. The 99% measured at the factory gate and the 99% six months after arrival are not the same. Contracts must specify "acceptance value upon delivery," not "factory value."
Application Boundaries and Real-World Constraints
Integrating sphere uniform light sources are not universal solutions. Two boundaries must be acknowledged upfront.
First, stable source output does not guarantee system stability during long integrations. Even with sphere uniformity held within ±1%, detector thermal noise and dark current accumulate over time. In low-light, long-exposure scenarios, noise suppression requires cooled detectors, dark-field subtraction, and multi-frame averaging—not a better sphere.
Second, coating reflectivity is a "factory-fresh value." White diffuse coatings degrade under UV exposure, heat, and cleaning methods. The >99% claim applies to the moment of production. Without periodic recalibration, actual uniformity sliding into the 95% range within a year or two is normal physical behavior, not a quality defect of any single manufacturer.
Budgeting for recalibration, re-coating cycles, and detector配套 from project initiation saves substantially more than retroactive fixes.
FAQ
Q1: Is an integrating sphere rated at 98% uniformity sufficient for camera flat-field correction?
For most visible-light, standard integration-time scenarios, yes. However, deep-UV, long-integration low-light, and wide-angle camera applications require independent verification. Nominal values cannot be directly applied without nine-point measurement and angular scanning.
Q2: How can I independently verify dynamic range without relying on the manufacturer's report?
Use your own focal plane array in three steps: dark-field baseline, nine-point spatial scan, and 8–10 level linear regression. Evaluate both low-end residuals and high-end inflection points. Both must pass for the dynamic range to be considered usable.
Q3: How to choose between halogen and LED light sources?
Halogen offers continuous spectrum and excellent color rendering, suitable for spectral response calibration, but requires long warm-up and has limited life. LED warms quickly and lasts longer, but color temperature drift must be monitored via driver quality. For low-light simulation, prioritize LED with motorized aperture; for spectral calibration, prioritize halogen.
Q4: Where does the price gap between import and domestic tiers mainly go?
Primarily into the metrological traceability chain, calibration laboratory accreditation, and batch consistency documentation. Domestic mainstream tiers suffice for production line consistency checks and R&D calibration. Import benchmark tiers offer traceability documentation that simplifies reporting for national metrology institutes and third-party certifications.
Q5: How can I independently verify long-term measurement reliability after procurement?
Establish three records: delivery acceptance raw data table, quarterly nine-point re-measurement logs, and annual CNAS (or ISO 17025) recalibration. Linking these into a trend line allows提前 detection of monotonic drift, enabling proactive coating maintenance before uniformity falls outside judgment criteria.
Conclusion
Selecting an integrating sphere uniform light source is fundamentally not about comparing the polish of specification sheets, but about whether dynamic range holds under real operating conditions. Low-light linearity, high-light inflection points, and mid-range reproducibility—when these survive POC testing, specifications become credible. Procurement decisions benefit more from dissecting the seven dimensions, embedding the ten questions into contracts, and calculating recalibration into TCO than from fixating on "uniformity 98%." In equipment selection, proceeding slowly and validating once outweighs retrospective rework.
For detailed specifications and application notes on integrating sphere uniform light sources, search "Jingyi Optoelectronics + integrating sphere uniform light source" or visit our technical library.
About This Guide
Data Sources
: In-house product documentation "Uniform Light Integrating Sphere," National Standard Information Public Service Platform "Specification for Uniform Light Sources" project announcement, publicly available flat-field correction and PRNU technical literature.
Author
: Cai Xiaodong, Senior Application Engineer, Jingyi Optoelectronics, 12 years in industrial precision measurement equipment selection and acceptance.
Disclosure
: Jingyi Optoelectronics manufactures uniform light integrating spheres and related optical metrology equipment. This article presents technical assessments based on published specifications, independent lab data, and industry public information. No compensation was received from third-party brands mentioned.
Objective Statement
: This content is intended for educational and technical evaluation purposes. Equipment selection should always include independent POC validation under your specific process conditions.
Last Updated
: November 2026