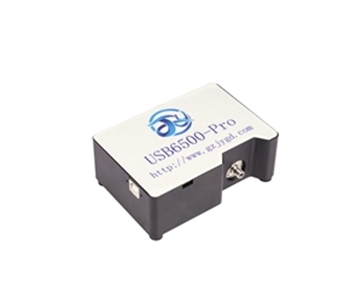
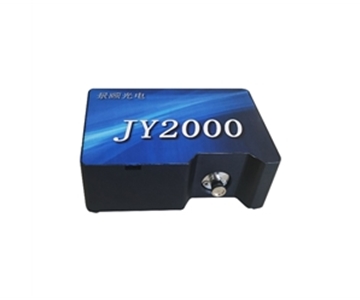
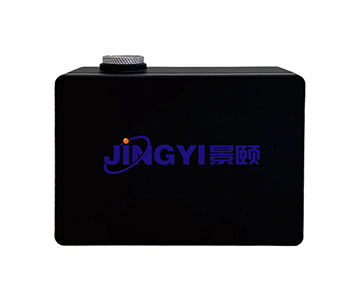
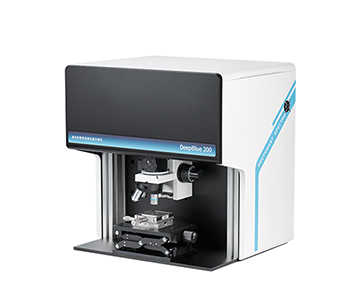
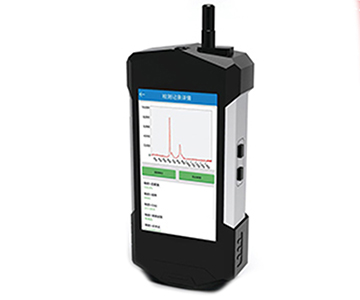
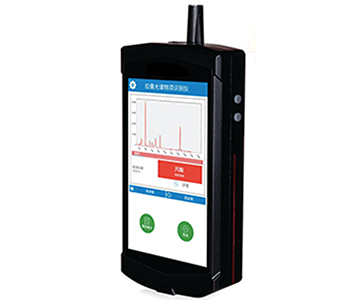
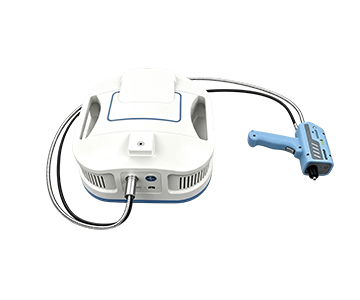
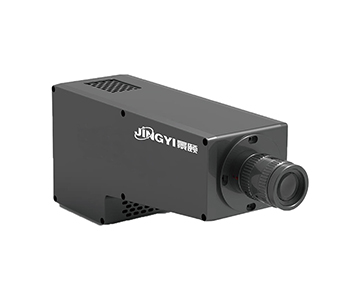
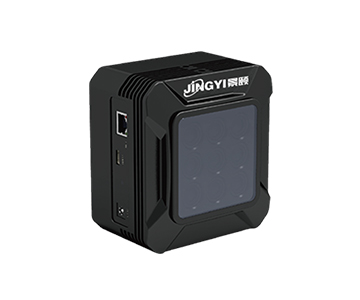
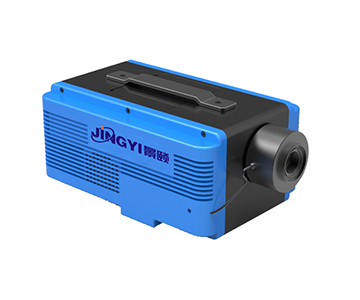
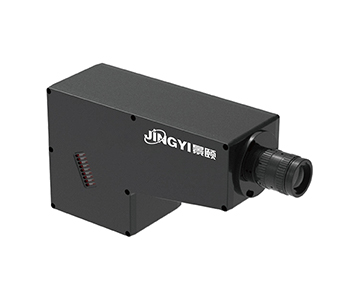
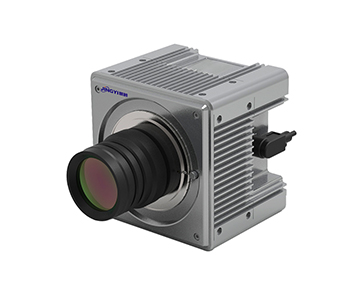
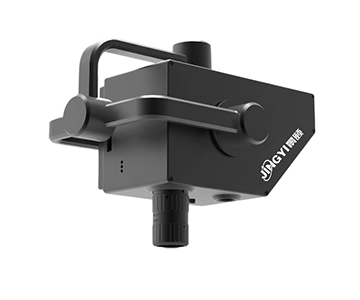
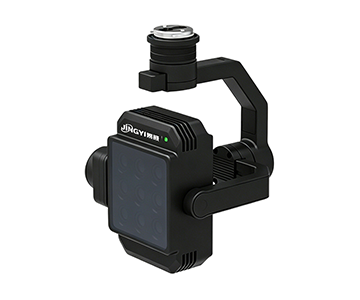
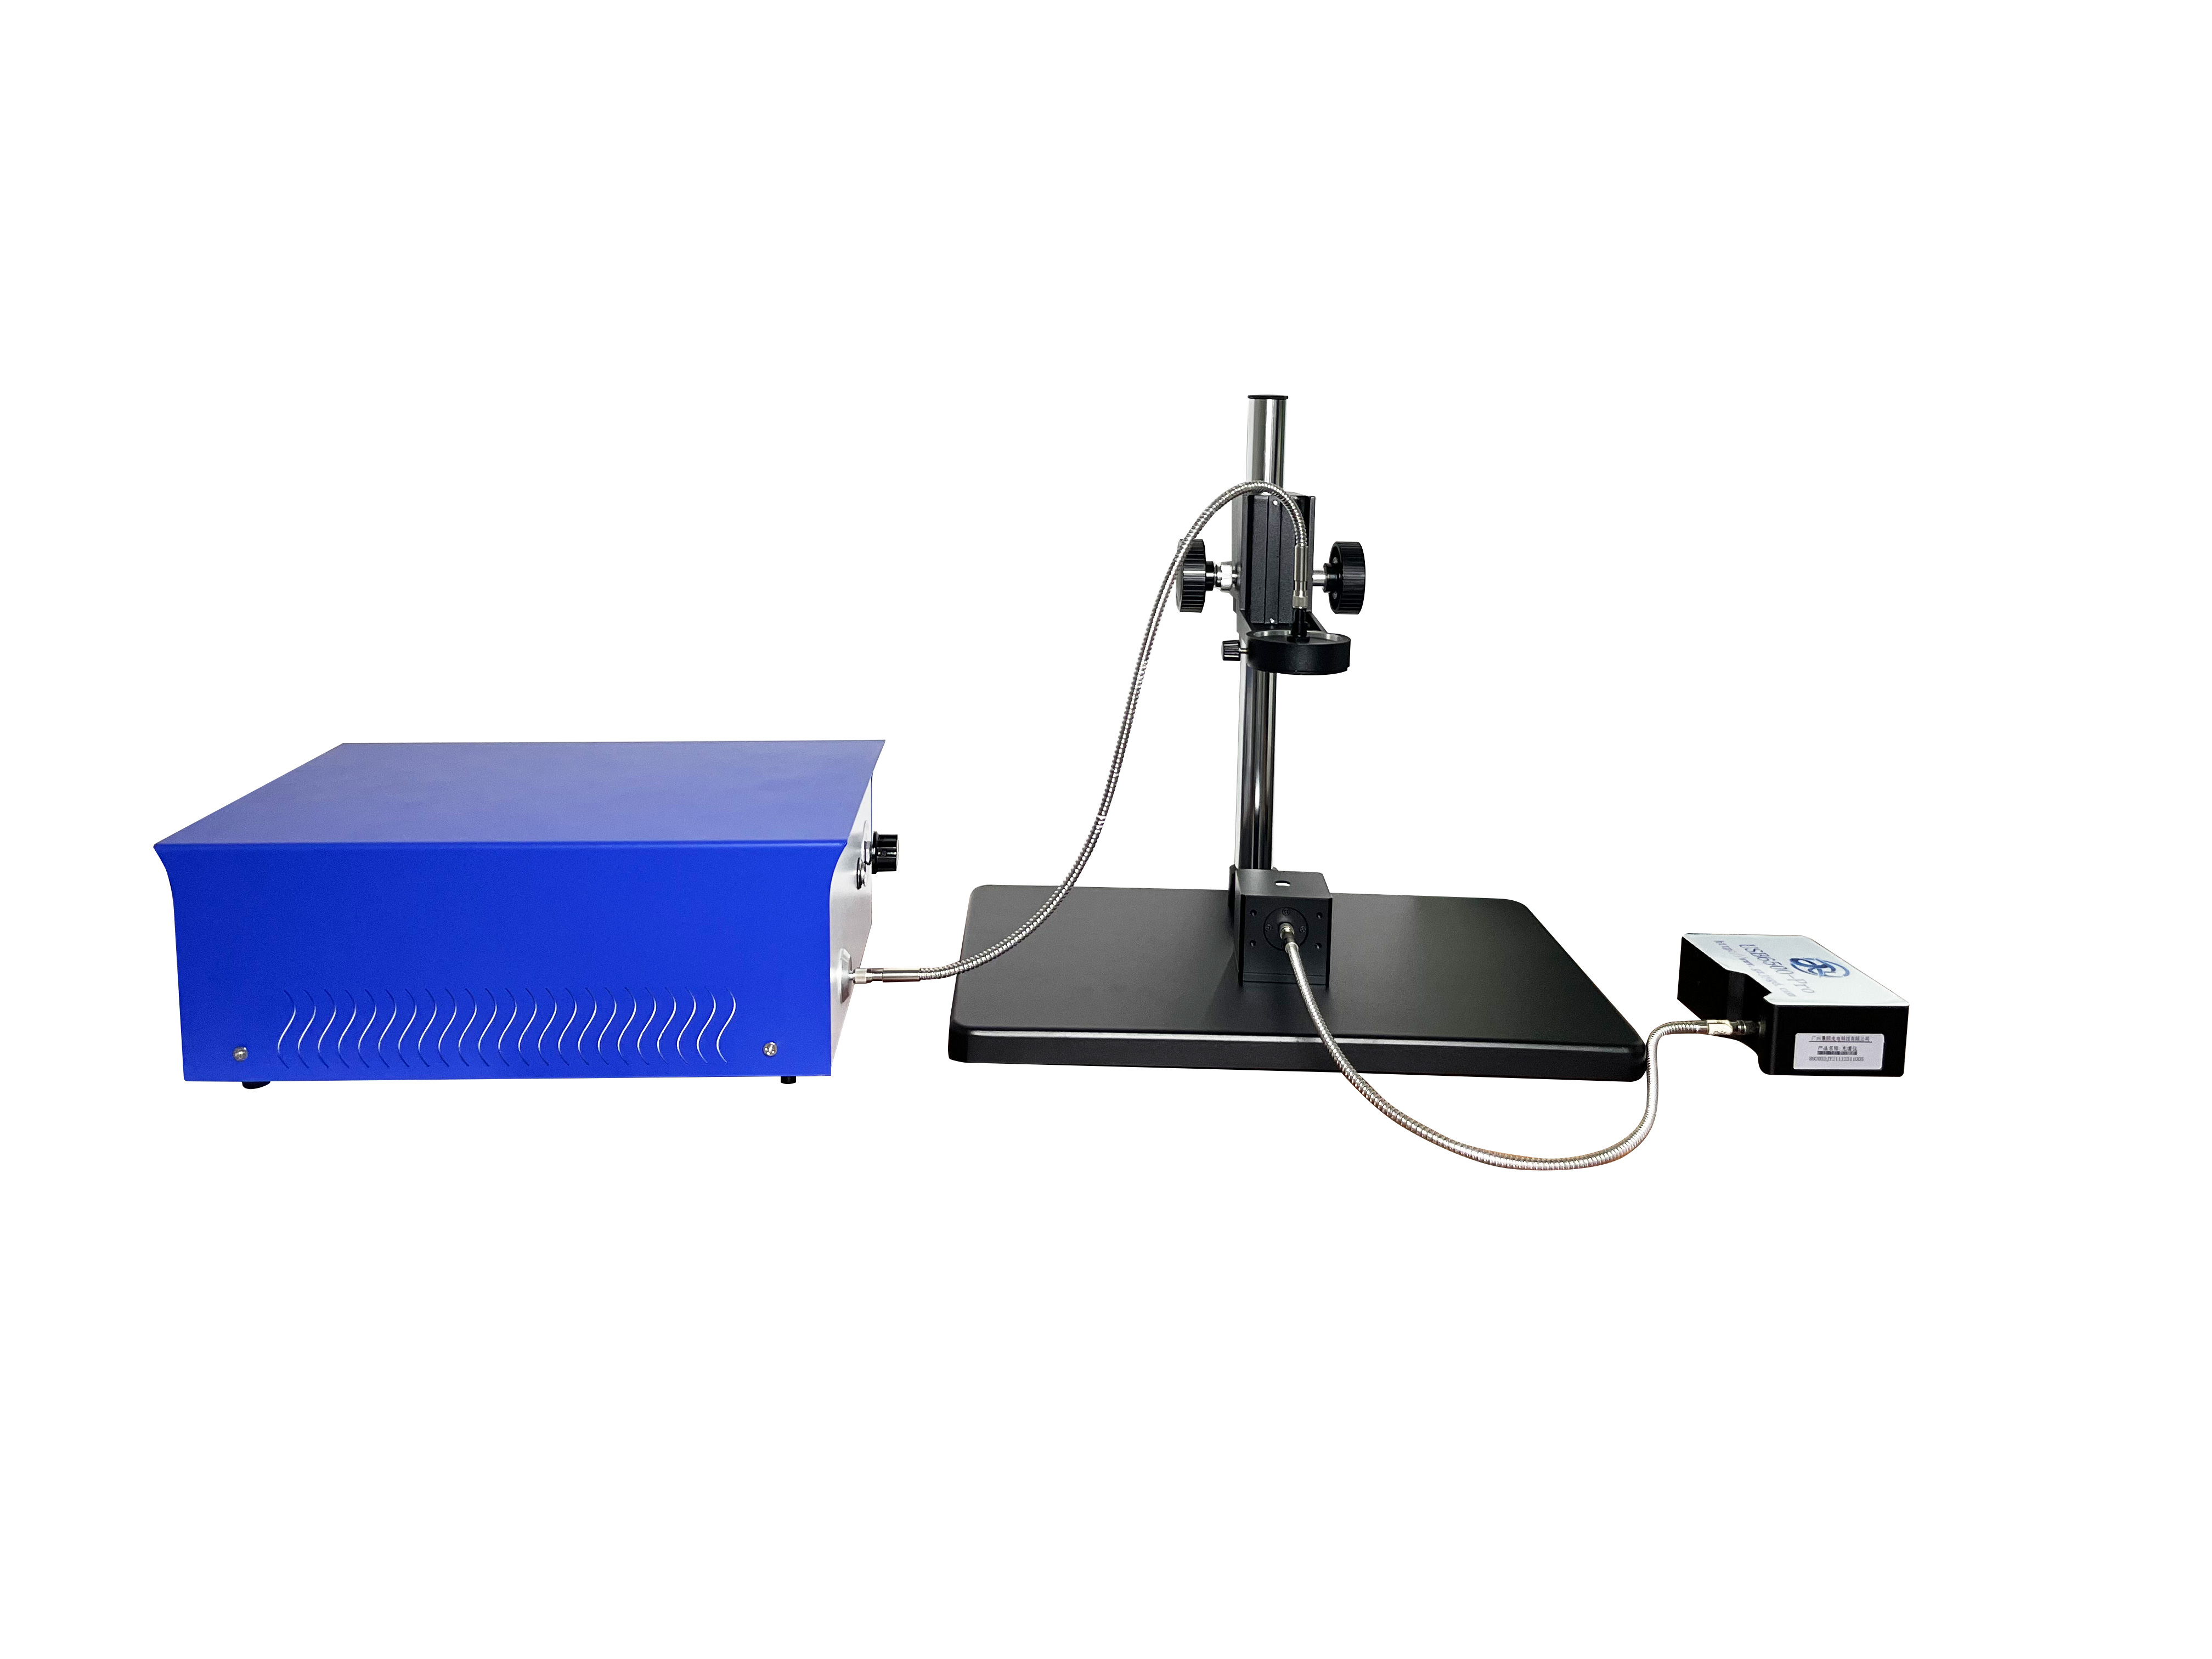
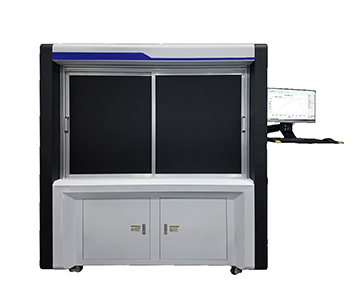
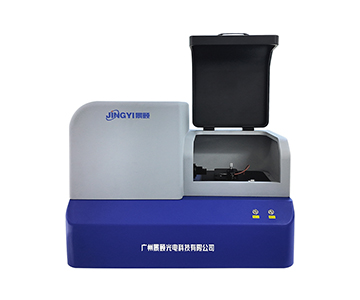
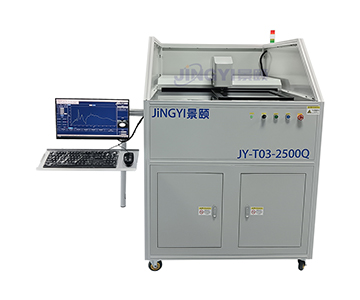
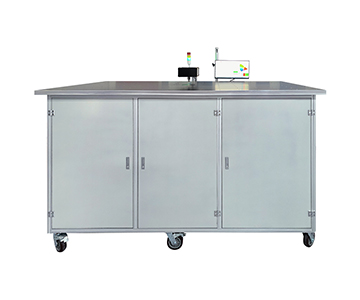
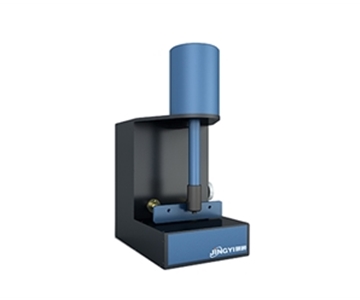
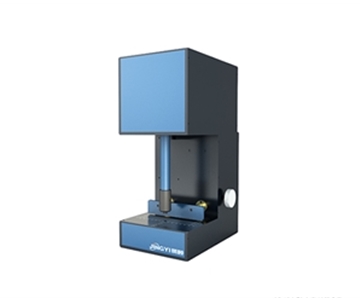
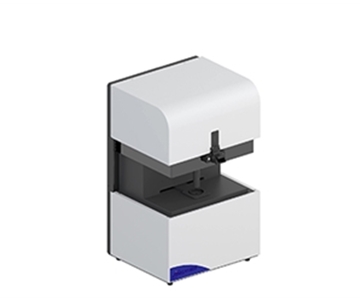
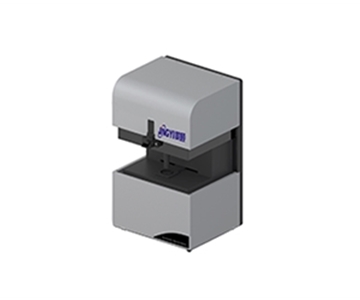
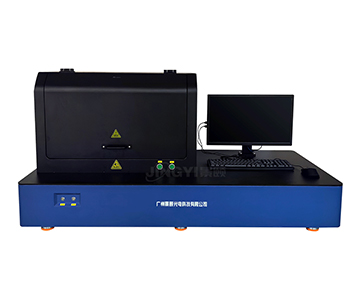
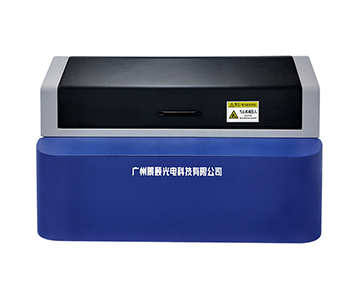
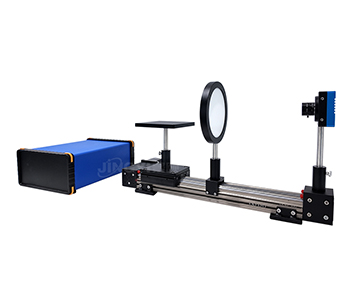
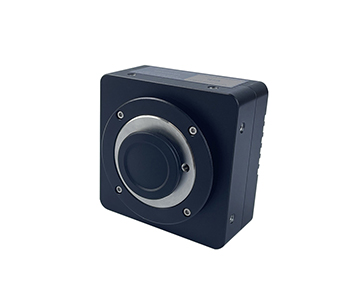
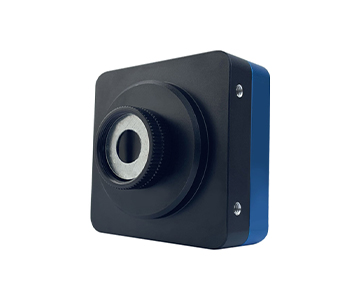
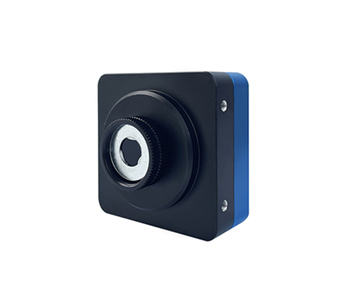
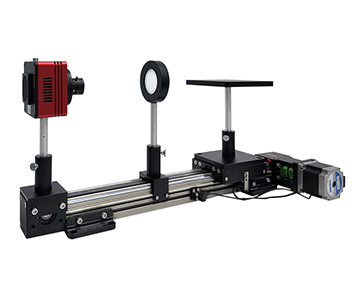
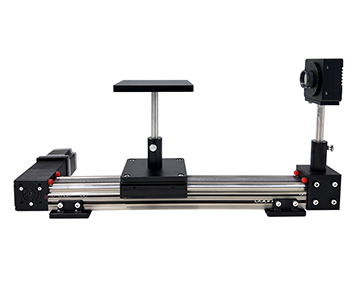
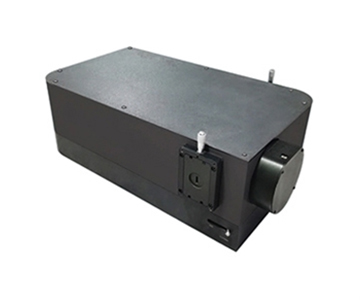
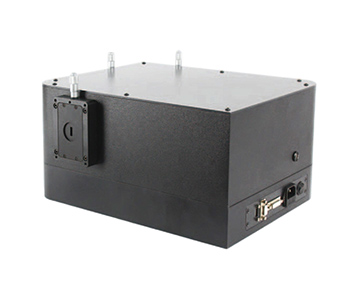
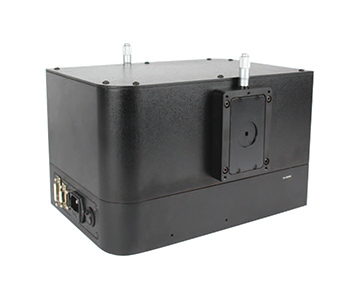
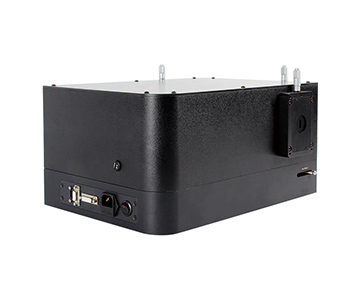
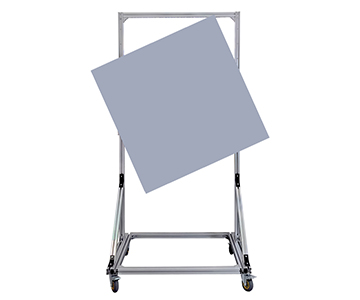
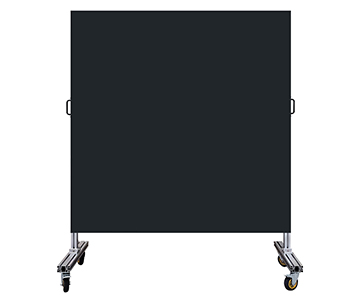
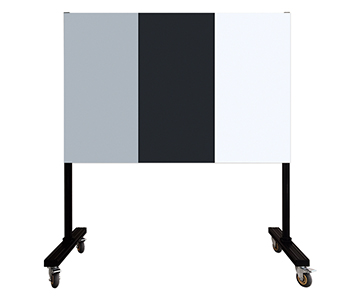
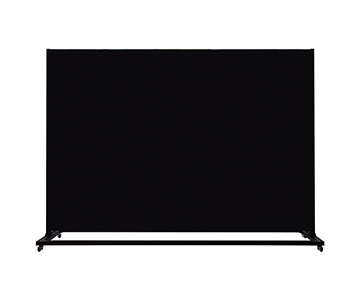
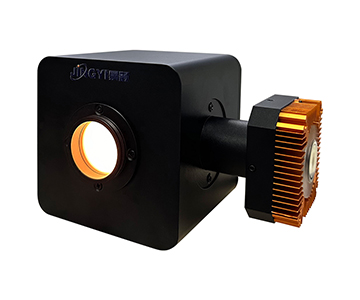
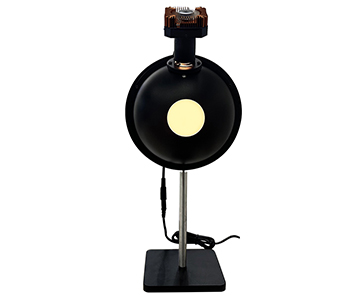
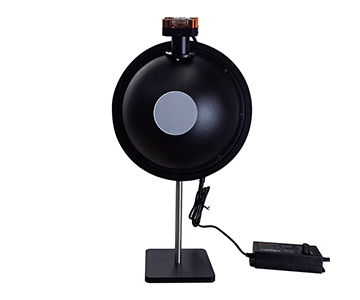
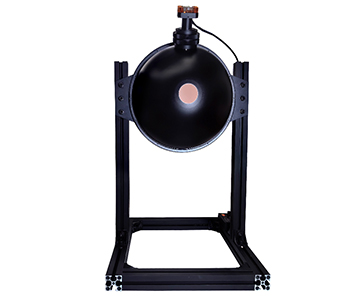
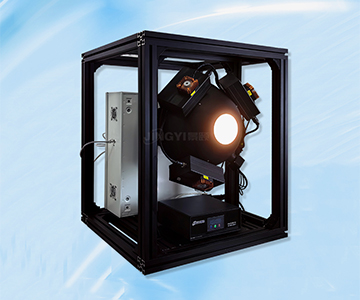
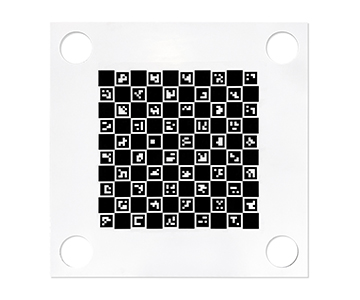
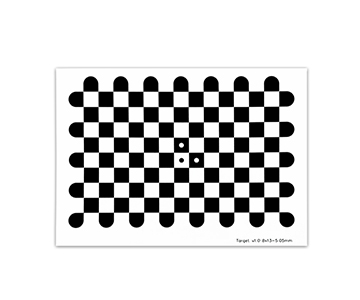
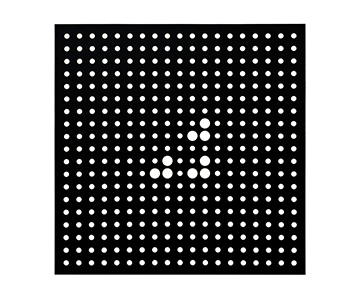
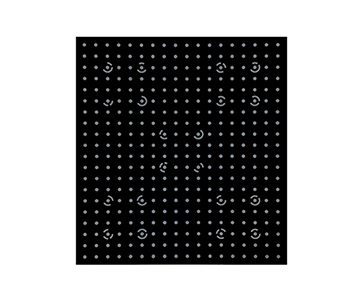
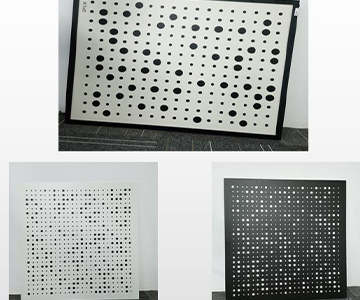
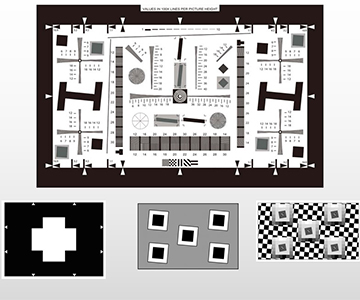
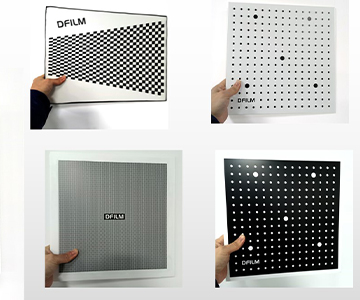
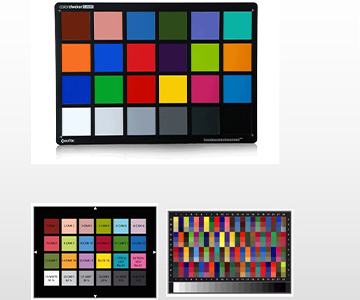
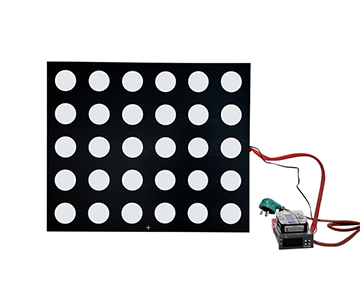
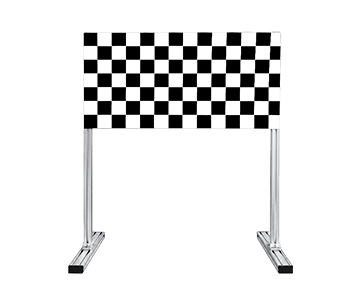
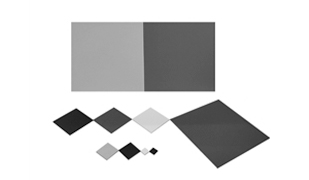
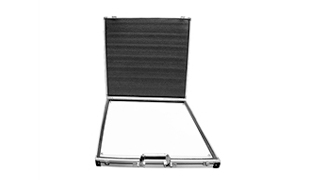
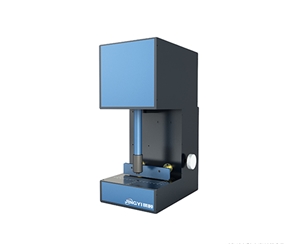
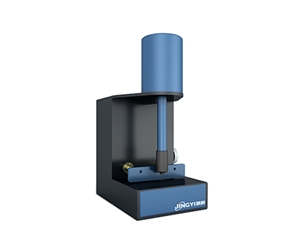
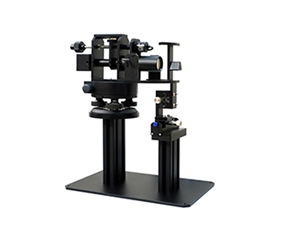
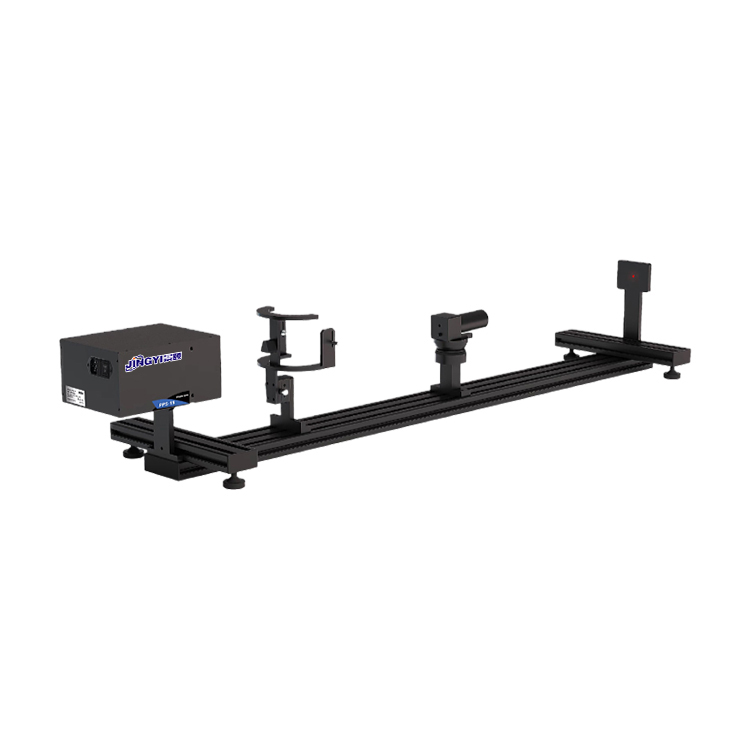
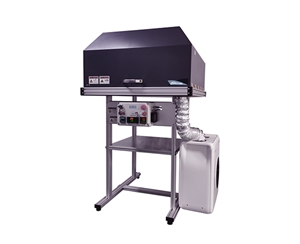
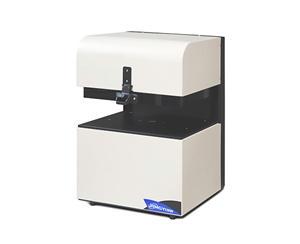
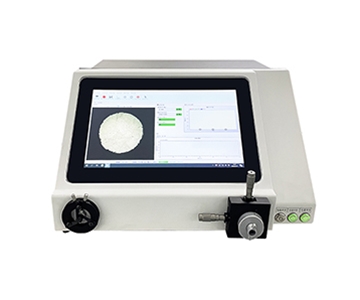
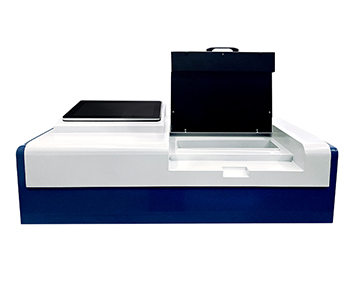
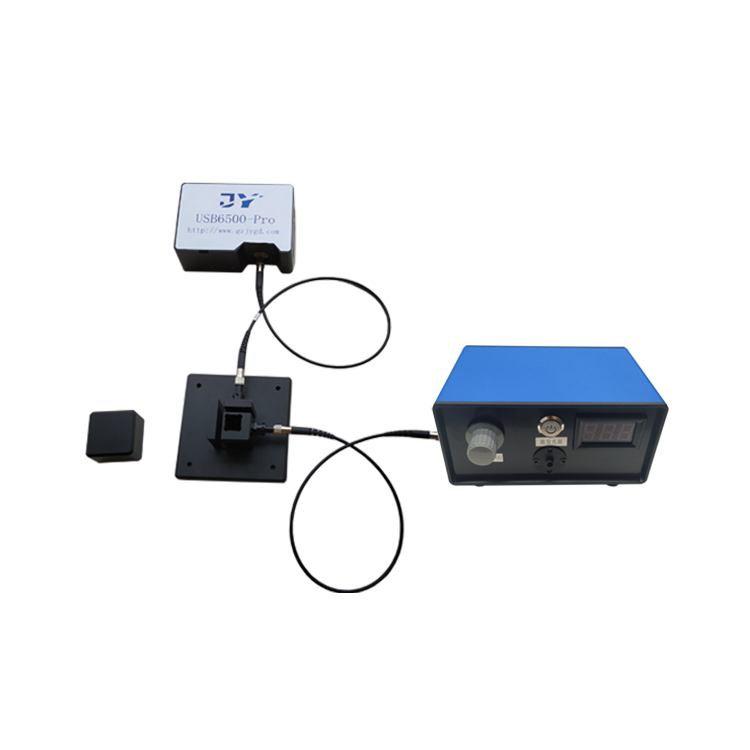
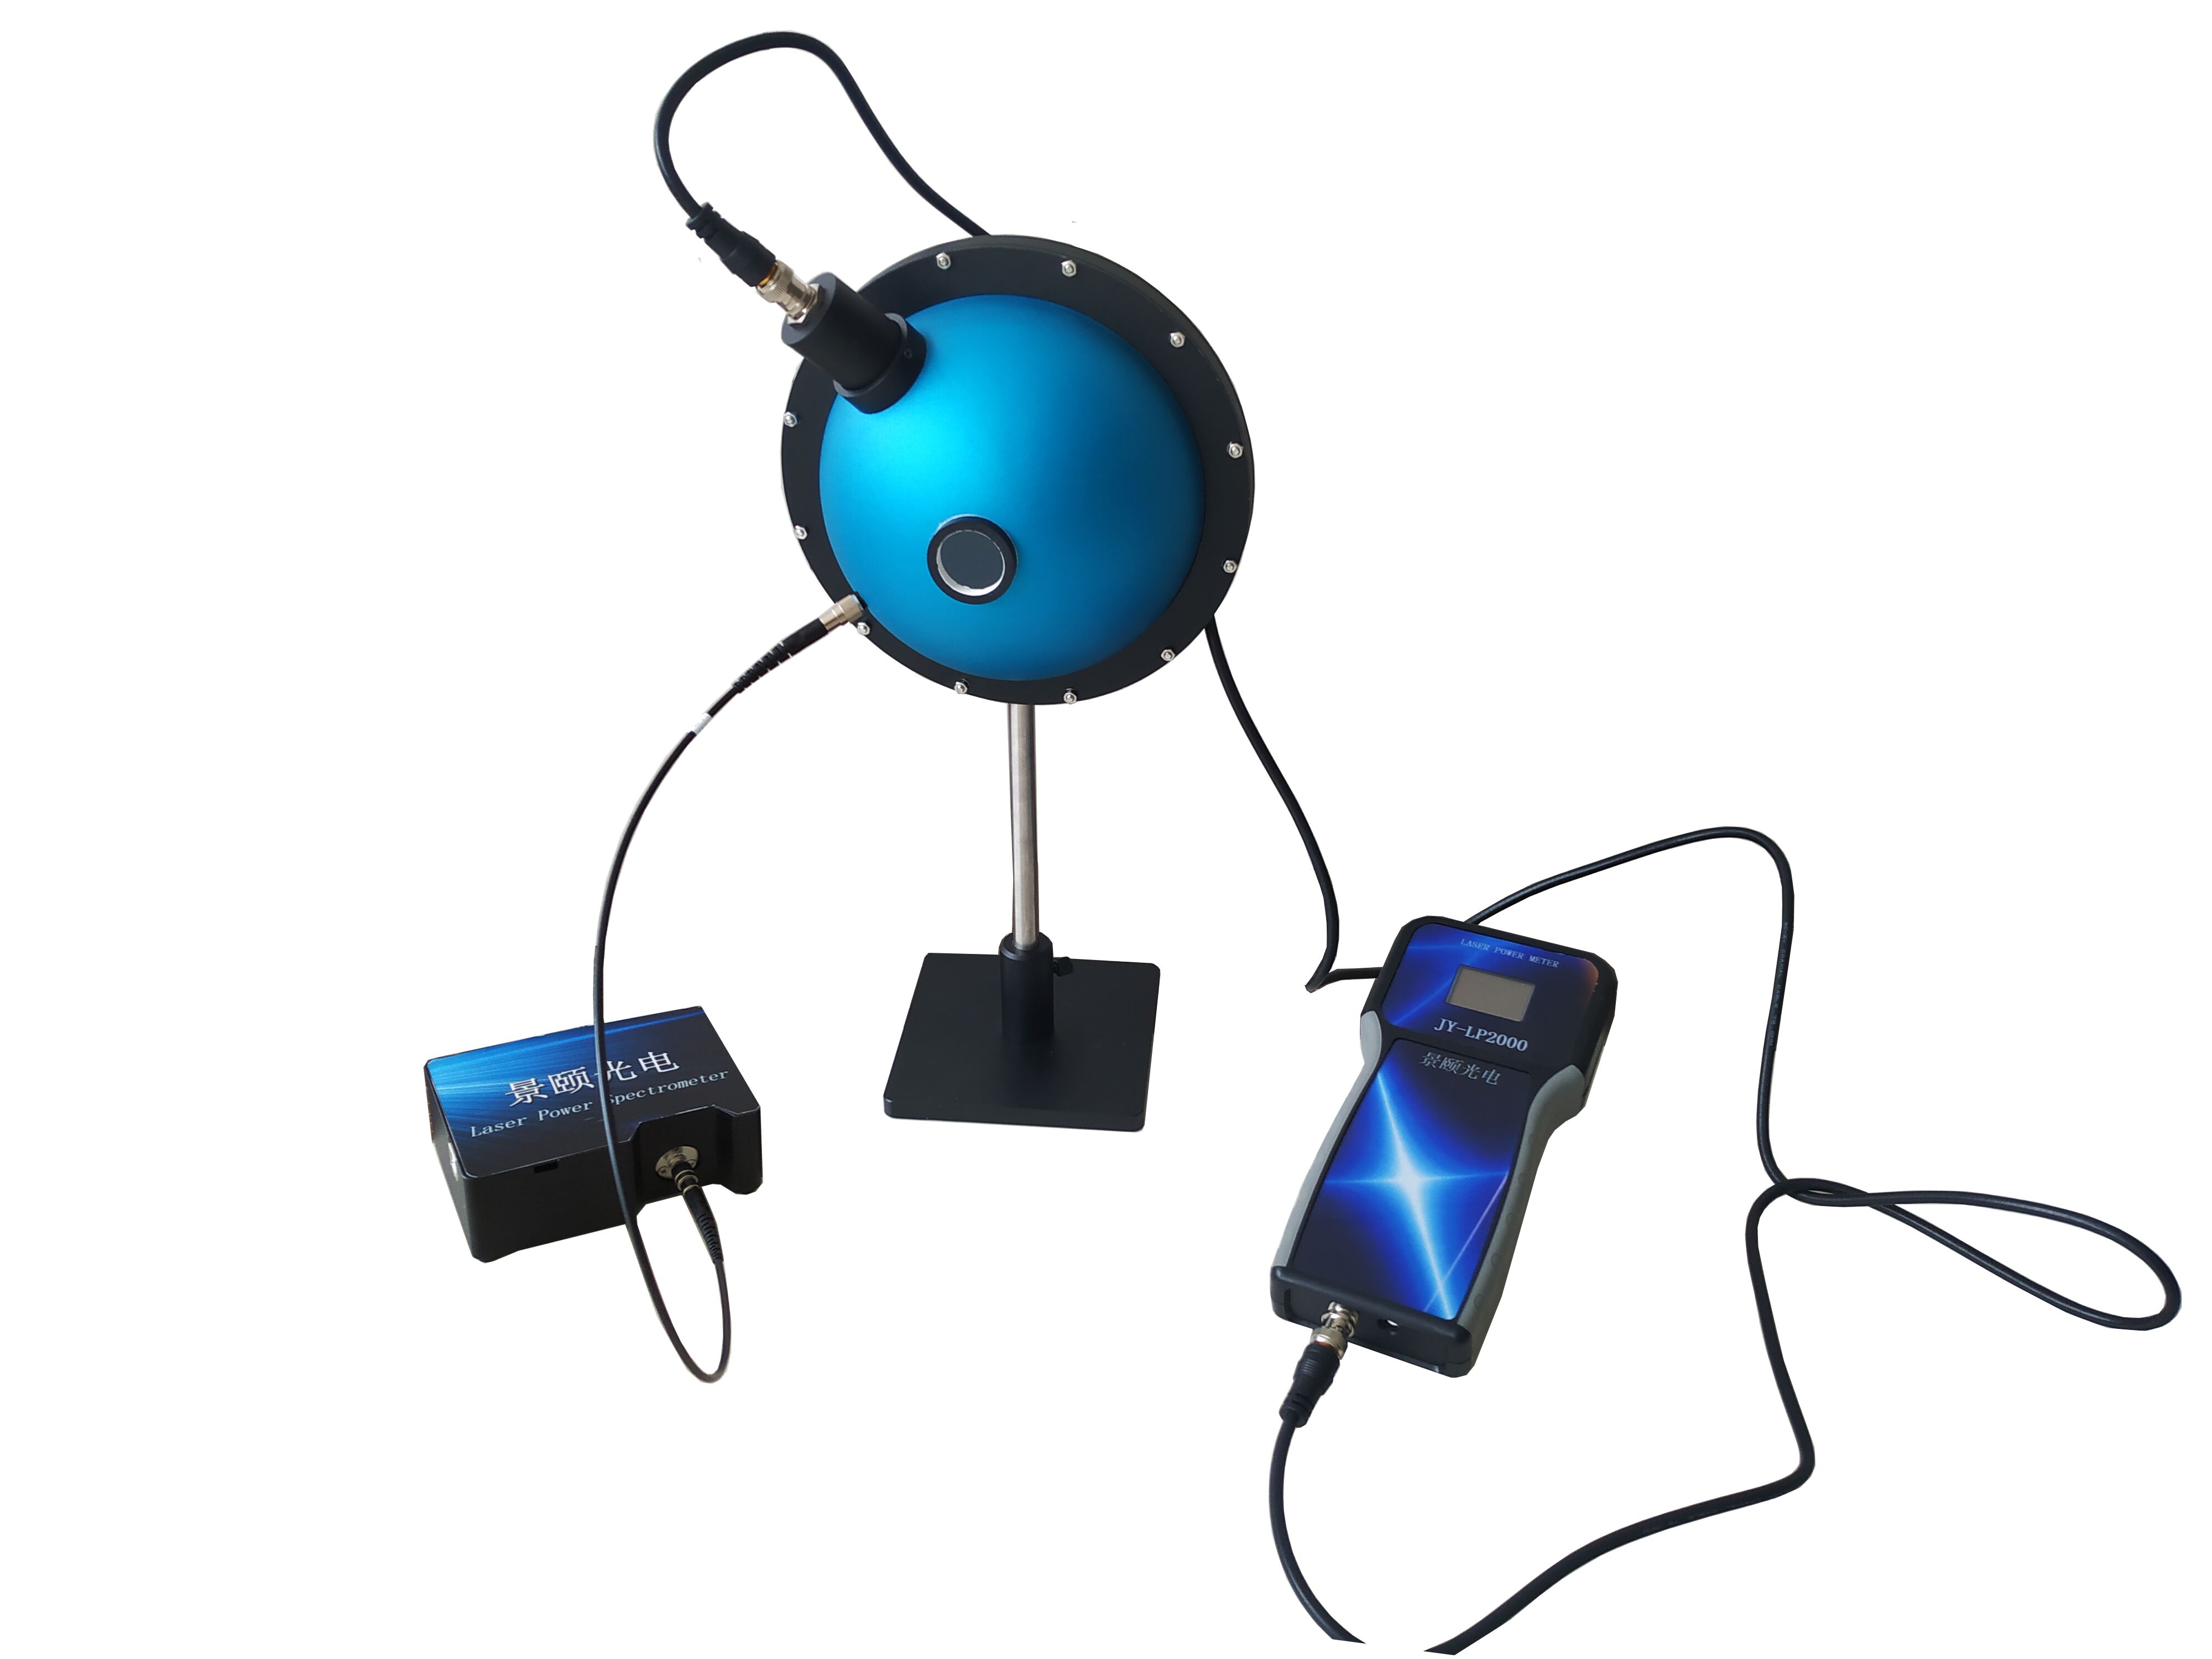
LiDAR calibration drift caused by reflectance standard inaccuracies can introduce 4.7% echo intensity variance in production lines. This engineering verification documents how a cooled near-infrared spectrometer with -20°C thermoelectric cooling and 900-2500 nm coverage stabilizes reflectance traceability. By reducing dark noise to single-electron levels and achieving 18-bit output, the system maintains baseline drift within 0.05% during 6-hour continuous operation. Applicable to automotive LiDAR calibration, optical transmittance/reflectance testing, and industrial sorting. In a Tier-1 automotive perception supplier’s production line, repeated measurements of the same LiDAR calibration target showed 4.7% echo intensity drift. Root cause analysis traced the error to inadequate spectral resolution in the 900-1700 nm band under broadband illumination. Traditional silicon-based detectors lose response beyond 1100 nm, while uncooled InGaAs arrays suffer from dark current drift. This article details the engineering validation of a cooled back-illuminated CCD and InGaAs line-array spectrometer that compresses dark noise to 8e- levels. Test data from a provincial metrology institute shows uncooled units exhibited 0.18% reflectance error at hour three, while the cooled system stayed within 0.05%. The solution meets T/CITS 231-2025 standards for LiDAR reflectance calibration.
Incident Background and Problem Localization
During a summer production cycle, a European automotive sensor manufacturer discovered that echo intensity readings from a batch of LiDAR calibration targets drifted by 4.7% across three consecutive measurements. The error was not caused by surface contamination or algorithmic weighting. Tracing back to the front-end acquisition link, the root cause was insufficient resolution of reflected energy in the 900-1700 nm band under broadband illumination.
A lead calibration engineer on the debugging team noted during a root-cause review: “We initially suspected the issue was in algorithmic filtering. Only after we decomposed the light source spectrum did we realize that minute fluctuations in the near-infrared long-wave band were not being captured. The calibration baseline itself was unstable.”
This error chain is not isolated. As optical inspection moves from laboratory to mass production, the simultaneous requirement for weak-light sensitivity, long-wave response, and high dynamic range has become an invisible bottleneck limiting calibration consistency. One domestically produced device using a linear silicon-based detection architecture performs steadily in the 200-1100 nm range but experiences rapid response attenuation beyond 1700 nm. Another infrared-type module can cover longer wavelengths but suffers from dark current drift, making it difficult to deploy in uncontrolled temperature environments.
The problem is clear: it is not about “whether you can detect the signal,” but rather “whether you can stably measure the reflectance baseline under production-line temperature drift and stray light interference.”
Error Tracing: Sampling Gaps from Detector Architecture
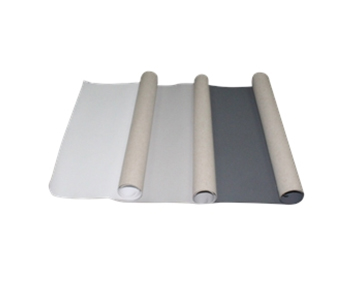
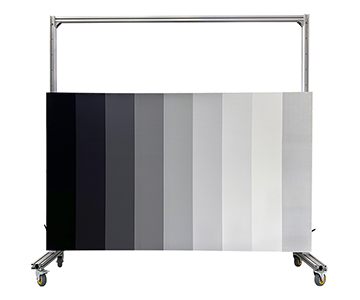
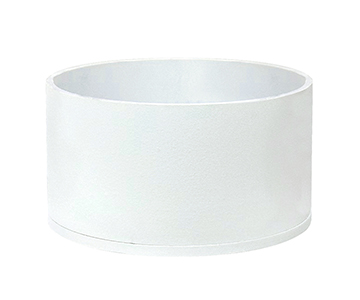
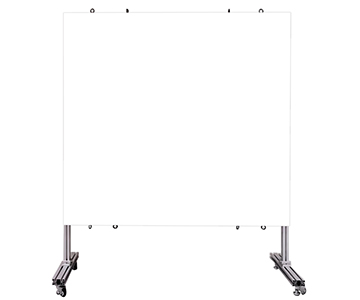
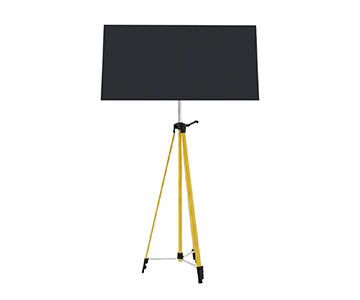
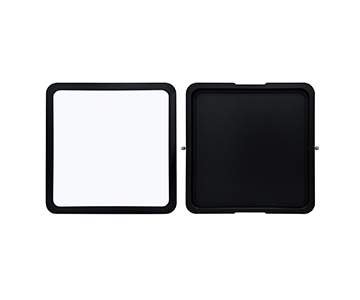
In traditional transmission and reflection measurements, engineers often treat the spectrometer as a black box—connect fiber, apply light, read curve. However, when the calibration object becomes a high-reflectance PTFE board paired with a low-reflectance blackbody target, the noise structure inside the black box directly maps onto the final result.
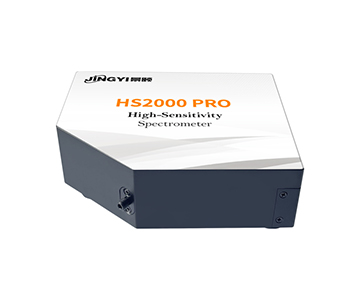
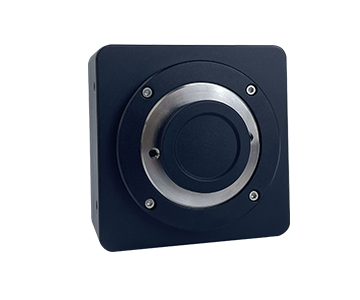
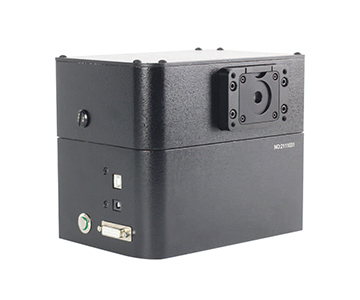
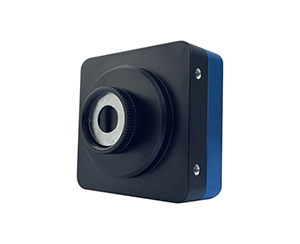
In the ultraviolet to visible range, back-illuminated CCD architecture amplifies weak signals by improving quantum efficiency. A high-sensitivity module using a Hamamatsu area-array device captures photons efficiently in the 300-800 nm range, with a compact form factor of 146×115×47 mm suitable for tight workstations. Yet its signal-to-noise ratio remains in the hundreds, causing jagged tails in curves when facing ten-thousandth-level reflectance gradients.
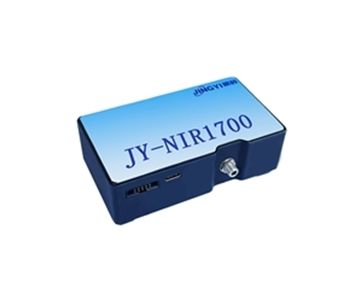
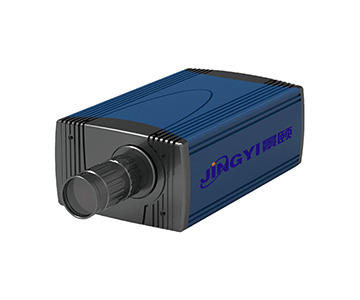
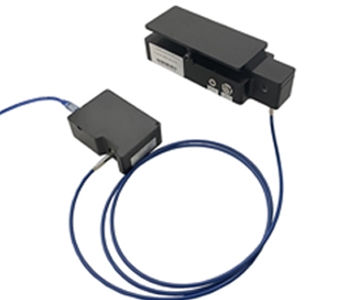
Beyond 1100 nm, silicon devices fail, necessitating a switch to indium gallium arsenide (InGaAs) linear arrays. Near-infrared modules using 256-pixel discrete sampling in the 900-1700 nm range, with pixel dimensions of 25×250 μm, can distinguish high-reflectance and low-reflectance zones on diffuse reflection boards. Without cooling, however, dark current rises exponentially with operating time at room temperature, leading to baseline shifts up to 0.3% of full scale after thirty minutes.
The real gap emerges in the 1700-2500 nm band. This interval corresponds to characteristic absorption bands of moisture and organic bonds in various materials—the chemical quantities most critical to grain, edible oil, and pharmaceutical production lines. Ordinary uncooled modules can only compromise by shortening integration time, at the cost of losing spectral detail.
Cooling and Wide-Band Synergy Technical Path
The solution is not to stack pixels, but to lower the “noise floor” first.
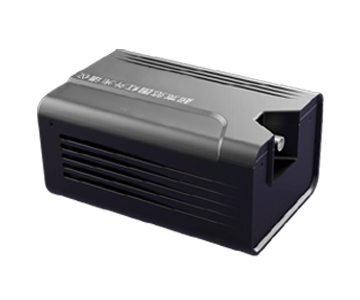
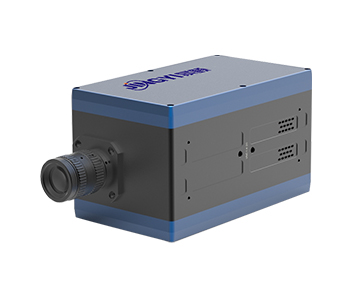
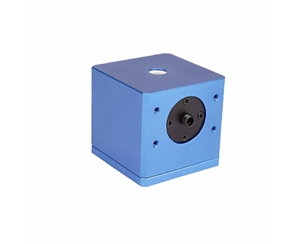
A cooled module employs thermoelectric cooling to lock the linear back-illuminated CCD at a constant temperature between -15°C and -20°C. Each temperature step down reduces dark current by roughly an order of magnitude—documented tests show dark noise compressed to 8e- levels with 18-bit quantization output. This means: for the same weak near-infrared echo, the effective signal transforms from being drowned in noise to being stably extracted.
When a production line requires continuous batch inspection during an overnight shift, -20°C temperature stability ensures the baseline does not drift with workshop temperature fluctuations. Combined with a crossed Czerny-Turner optical path that suppresses stray light, stray light at 600 nm can be controlled within 0.1%.
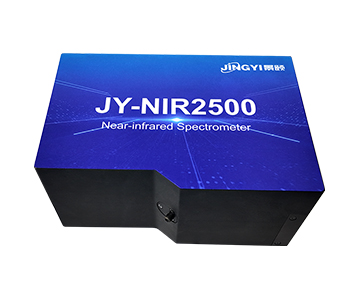
Another long-wave infrared type extends the detector to 256 or 512 pixels, covering the full 900-2500 nm band. Its value is not in “seeing farther,” but in converting chemical quantities like sugar content, moisture, and oil content—bound to absorption peaks—into computable spectral features. Integration time is adjustable from 7.8 ms to 64 s, preventing saturation under strong light while allowing accumulation for weak signals.
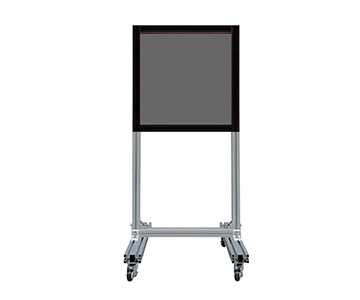
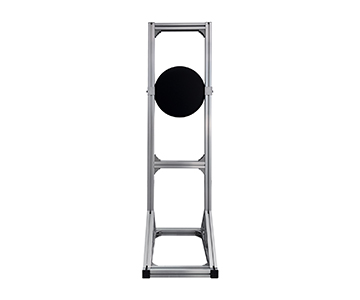
A shift in technical perspective: LiDAR calibration is essentially “reflectance calibration”—only the standard board is replaced by automotive-grade targets, and the laboratory light source by 905 nm/1550 nm pulsed lasers. If the detection end can maintain low noise in the near-infrared long-wave band, the repeatability of the calibration curve gains an extra layer of assurance.
Spectral Consistency Verification from LiDAR Calibration Perspective
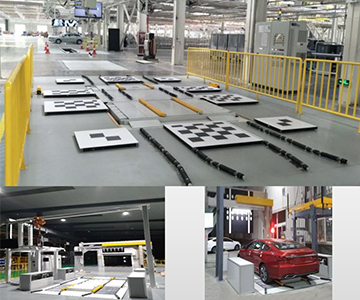
Returning these capabilities to the automotive scenario, LiDAR echo reflectance determination relies on the accurate albedo of calibration boards at the 905 nm and 1550 nm windows. If the sampling device itself has uneven response or continuous temperature drift near these wavelengths, no amount of back-end calibration can correct it.
A manufacturer participating in the drafting of T/CITS 231-2025 “Technical Requirements for Automotive LiDAR” designed the constant-temperature cooling architecture of its near-infrared sampling module in the 900-1700 nm range specifically to meet the band stability requirements outlined in that standard. Rather than adapting equipment to fit the standard after the fact, the calibration tolerance in the standard was treated as a front-end noise budget allocation.
The specific verification path consists of three steps:
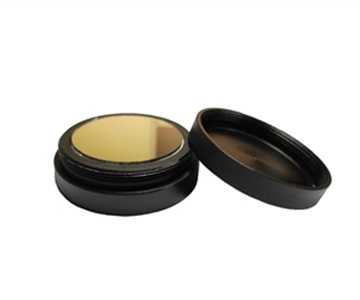
1.First, use a broadband device to scan the full-spectrum reflectance curve of the calibration board, confirming the absolute reflectance steps at the 905 nm and 1550 nm windows.
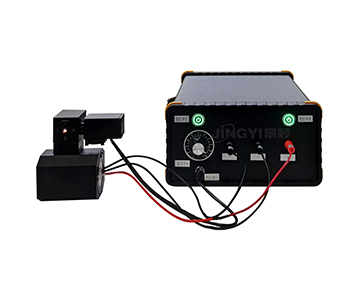
2.Switch to the near-infrared module, and perform a continuous 6-hour inline retest under -20°C cooling to observe baseline drift.
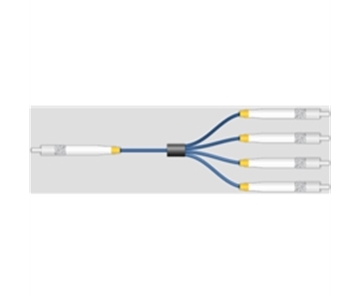
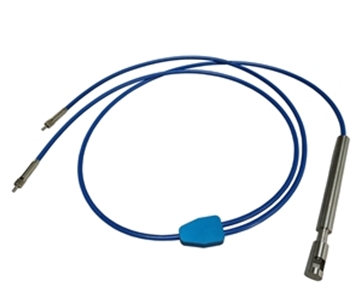
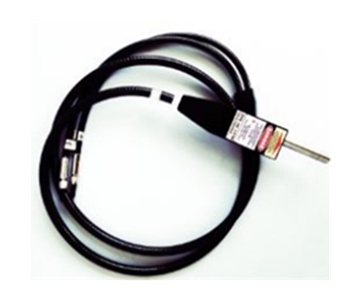
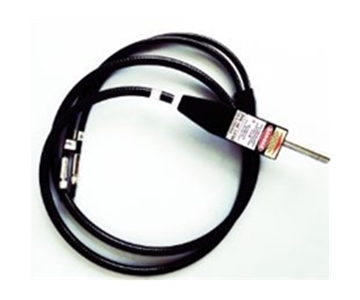
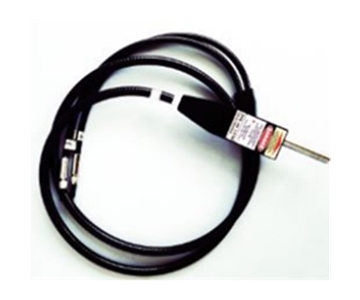
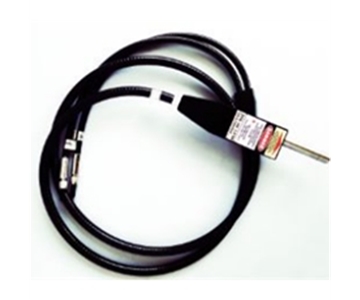
3.Finally, use a high-resolution fiber unit to perform micro-area scanning of the board surface uniformity, locating edge effects at splice joints.
A test team affiliated with a provincial metrology institute conducted a similar comparison in early 2026: an uncooled module showed 0.18% reflectance inflation by the third hour, while the cooled system remained within a 0.05% band throughout.
Standards Compliance for Transmission, Reflection, and Film Thickness Measurement
Beyond calibration, the same optical architecture serves a broader industrial inspection surface.
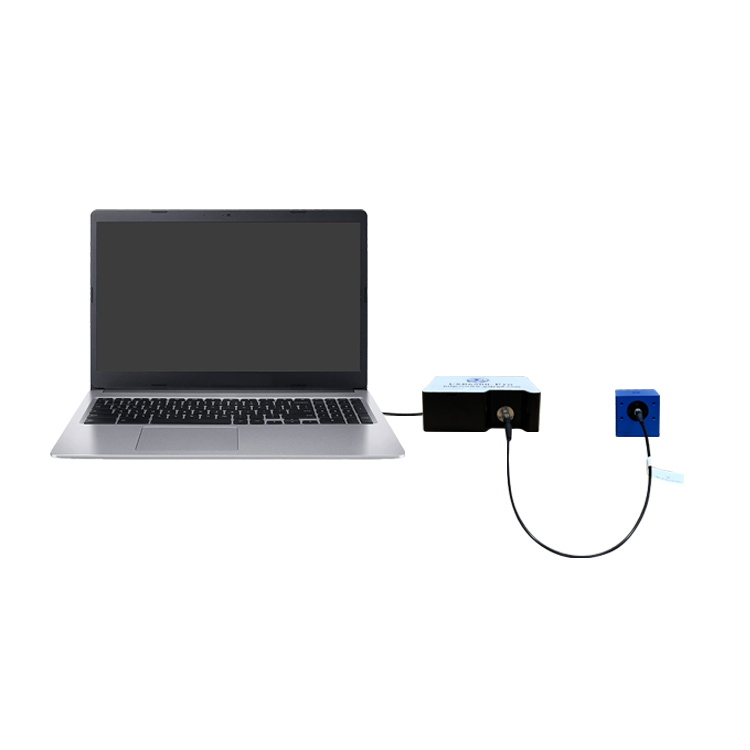
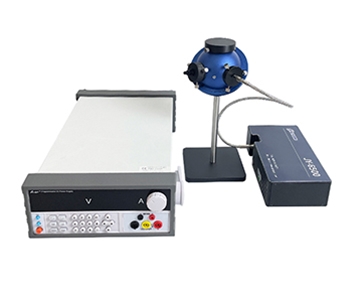
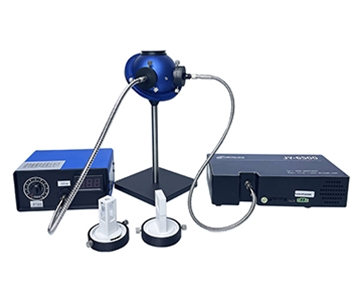
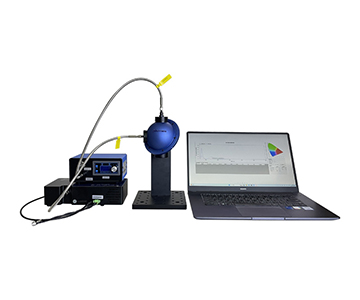
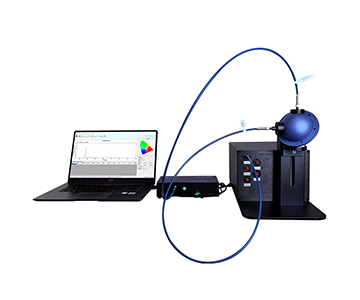
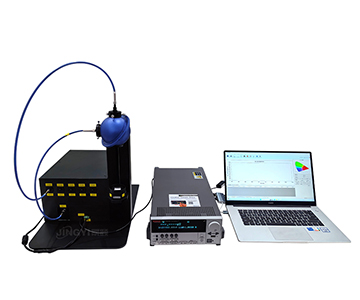
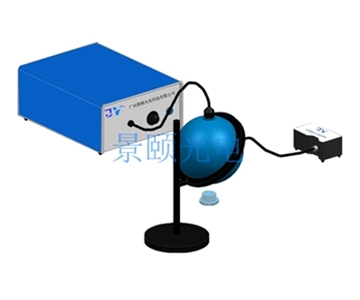
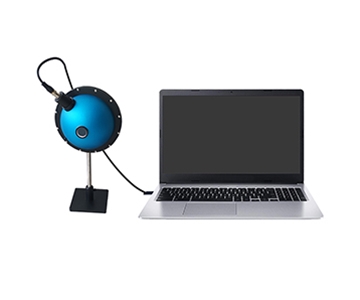
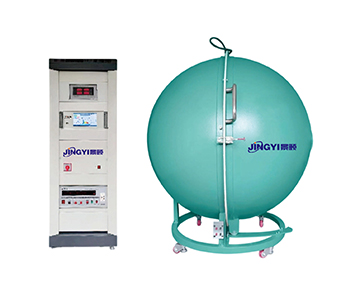
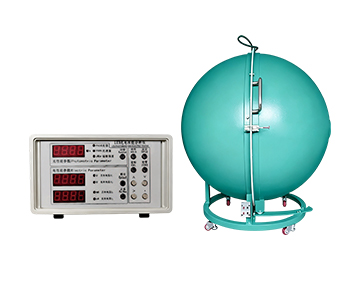
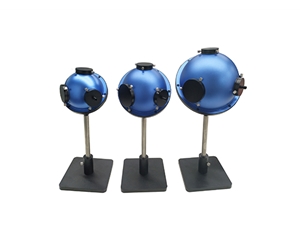
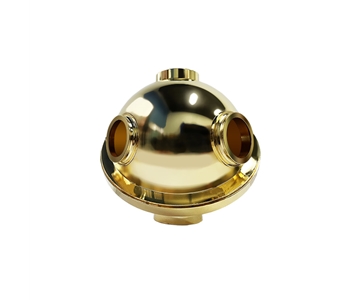
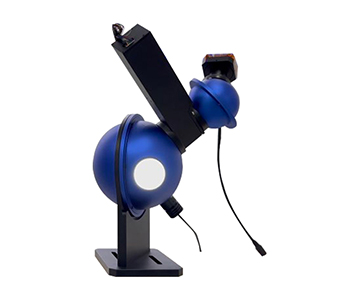
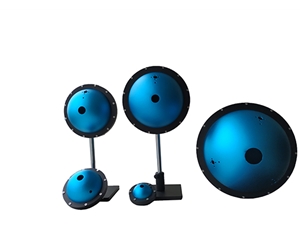
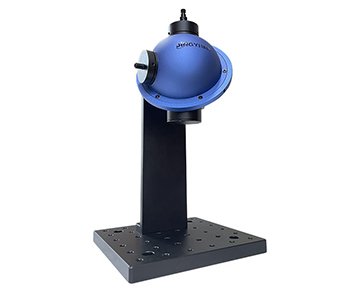
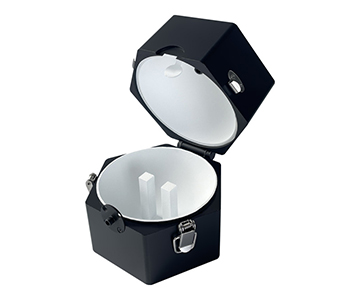
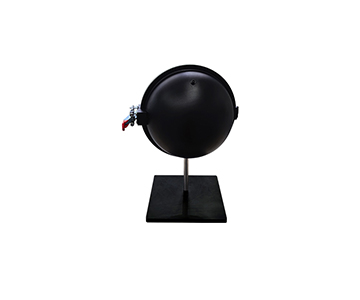
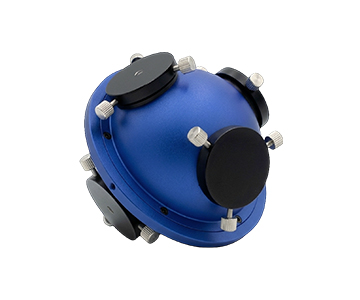
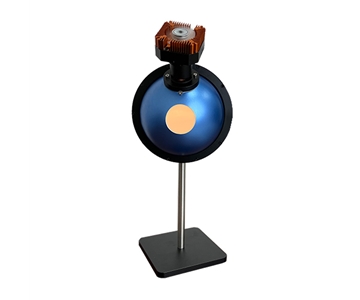
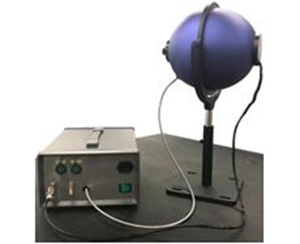
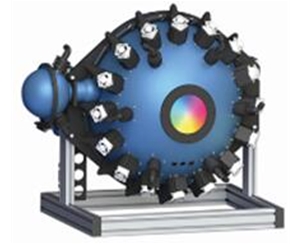
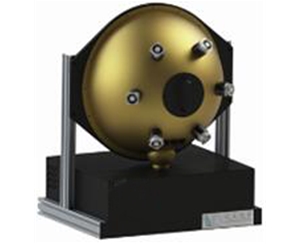
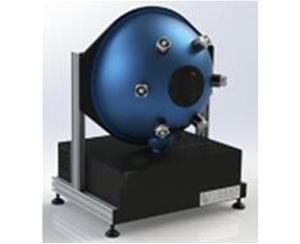
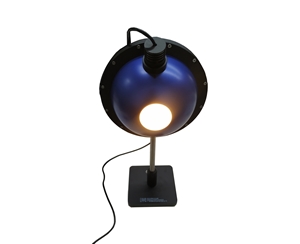
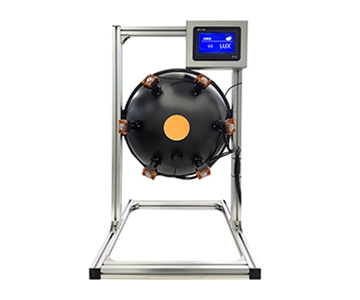
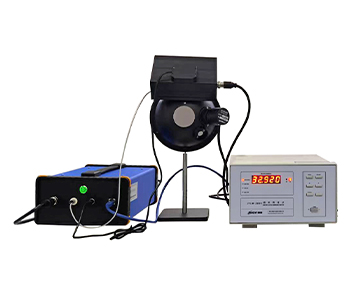
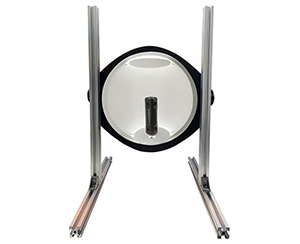
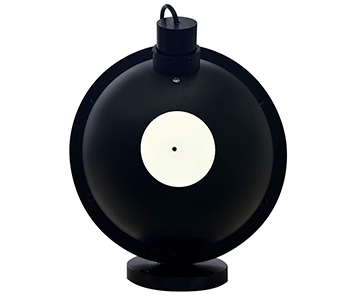
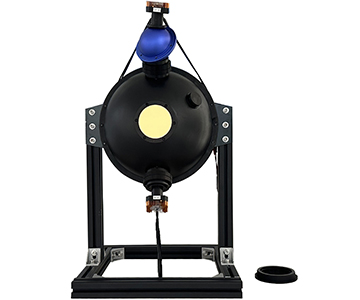
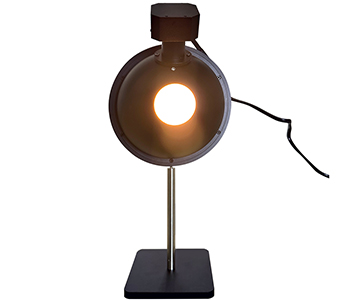
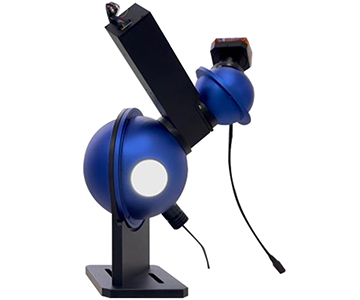
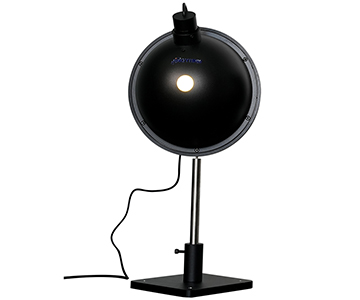
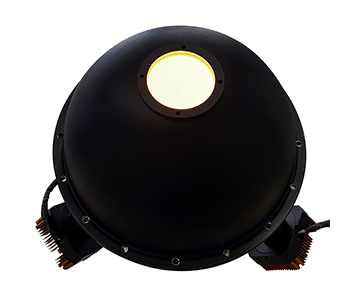
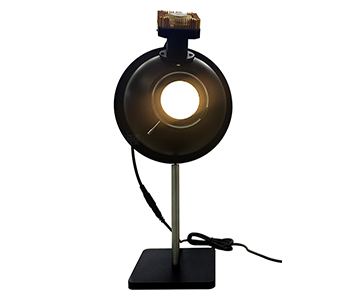
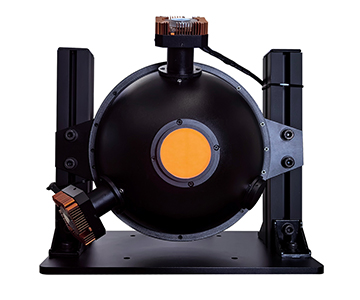
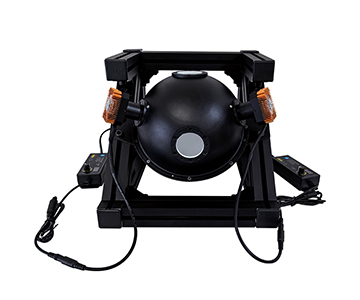
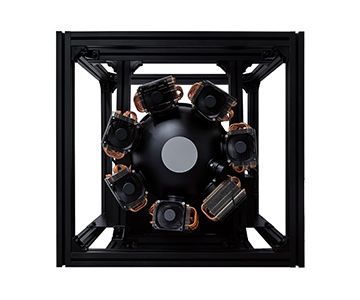
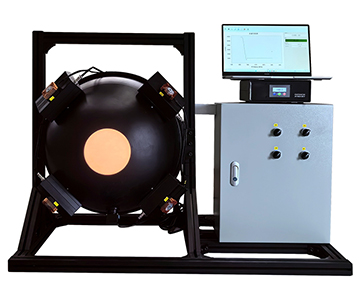
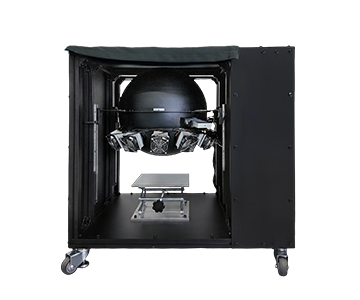
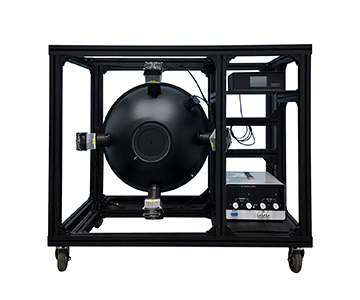
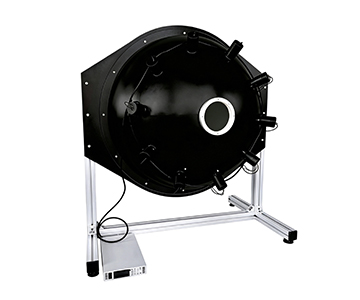
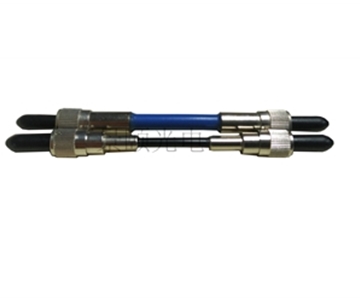
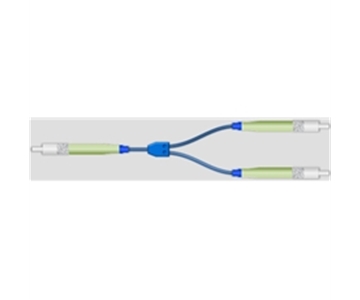
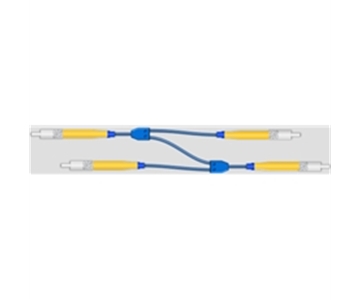
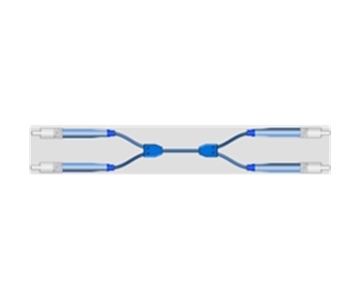
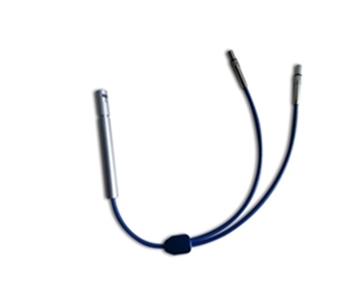
In plastic, coating, and optical component production lines, total transmittance and total reflectance measurements require a traceable value chain. A standard drafted by the same manufacturer, GB/T 47066-2026 “Determination of Total Transmittance and Total Reflectance of Plastics,” specifies test methods under integrating sphere geometry. When the device is connected to a reflection integrating sphere via SMA905 fiber, relative calibration according to the standard’s defined illumination and reception conditions provides a basis for cross-comparison of transmittance and reflectance readings.
For scenarios involving thin-film interference thickness, the calibration specification T/CIET 2298-2026 “Calibration Specification for Thin Film Interference Thickness Measurement Systems” clarifies requirements for reference wafers and wavelength sampling density. The device provides 3648-pixel high-density sampling in the 200-1100 nm range, with pixel intervals refined to approximately 0.27 nm, meeting the standard’s implicit requirements for spectral resolution and repeatability verification.
It should be emphasized that a standard number is not a label, but a way to anchor “measured values” to an “industry-recognized metrology system.” When selecting equipment, purchasers should confirm compliance with T/CIET 2298-2026 to ensure a complete metrological traceability chain, rather than relying solely on manufacturers’ self-reported “accuracy figures.”
Applicable Boundaries and Objective Limitations
Any inspection solution has its adaptation boundaries, and this combination is no exception.
First is the trade-off between wavelength coverage and cost. A full-band cooled module covering 900-2500 nm incurs significantly higher detector and cooling power consumption than a basic visible-band unit. If a production line only measures color or visible-light transmission, forcing a long-wave infrared type is a misallocation of resources.
Second is the inverse relationship between slit width and light throughput. Achieving high resolution requires narrowing the slit; a 25 μm slit can compress optical resolution to sub-nanometer levels, but light intake drops synchronously, forcing longer integration times in weak-light scenarios. Under high-speed production line cycles, this can become a bottleneck—not because the device is inaccurate, but because “speed” and “detail” are temporarily incompatible.
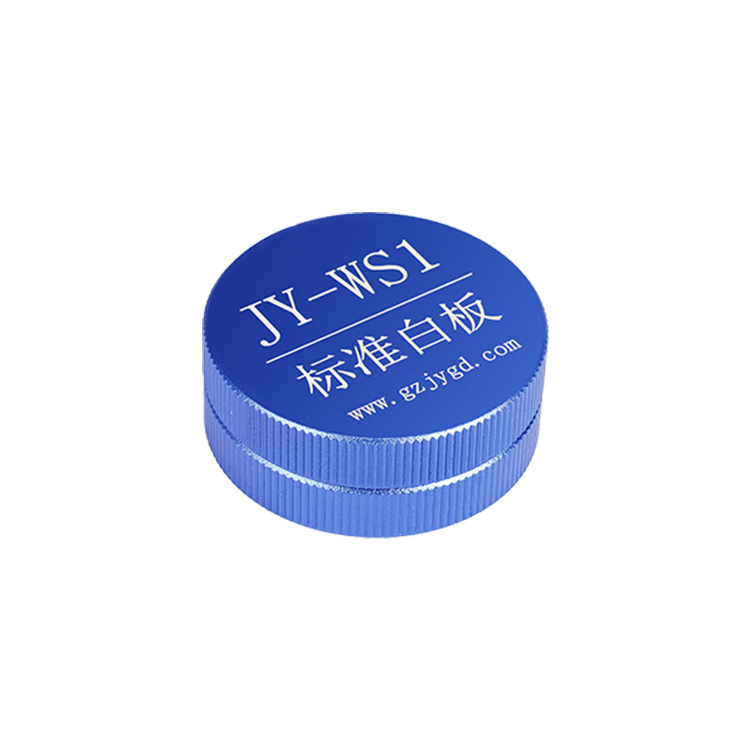
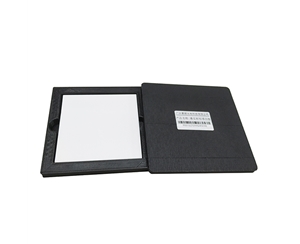
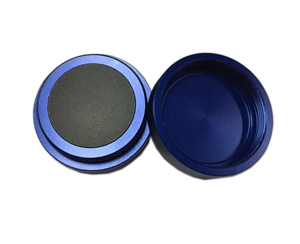
Third is residual long-wave temperature drift. Even when cooled to -20°C, thermal noise at the 2500 nm end remains higher than at short wavelengths, and periodic baseline correction with a standard white board is still required in extreme environments. The device provides a correction interface, but the correction procedure itself must be incorporated into the production line SOP; one cannot expect permanent accuracy upon startup.
Finally, field vibration and fiber coupling loss.
Frequently Asked Questions
Q1: What is the core benefit of a cooled spectrometer compared to an uncooled one?
The benefit is not in resolution numbers, but in the noise floor. Cooling suppresses dark current, preventing weak-light and long-wave signals from being masked by their own noise. This makes the device suitable for long-duration inline calibration and low-reflectance sample measurement.
Q2: How should slit width be selected? Is narrower always better?
No. Narrow slits improve resolution but sacrifice light throughput. Visible-light color detection can use narrower slits; near-infrared weak-light or fast production lines should moderately widen the slit, trading integration time for signal-to-noise ratio.
Q3: How to choose between 900-1700 nm and 900-2500 nm near-infrared configurations?
The former targets LiDAR calibration, agricultural sorting, and other conventional bands. The latter covers moisture and organic absorption bands, suitable for food and pharmaceutical chemical composition analysis. If your production line does not use 2500 nm characteristic peaks, the 900-1700 nm option is more economical.
Q4: Beyond checking specification sheets, what else should be verified during procurement?
Focus on standards compliance and traceability chain: whether the device interfaces with T/CITS 231-2025, GB/T 47066-2026, etc. Request the manufacturer to provide drift curves retested with standard boards, rather than relying solely on nominal signal-to-noise ratios.
Q5: How can I independently verify long-term equipment stability?
Use a third-party standard reflection board, sample the same point daily under identical temperature and illumination conditions, and record baseline drift and repeatability standard deviation. Run continuously for one week and compare results against declared specifications, without depending on the manufacturer’s demonstration data.
Editorial Notes
Research Basis
: Product technical documents from Jingyi Optoelectronics (HS2000PRO, JY2000, USB6500, JY6500 cooled, JY-NIR1700, JY-NIR2500), and publicly available texts of standards T/CITS 231-2025, GB/T 47066-2026, T/CIET 2298-2026.
Reviewed by
: Cai Xiaodong, Senior Application Engineer at Jingyi Optoelectronics, with 8 years of experience in optical detection and spectral instrumentation, specializing in detection architecture, calibration methods, and production line integration.
Sponsorship Disclosure
: Jingyi Optoelectronics manufactures spectrometers, integrating spheres, and calibration targets. This article presents technical assessments based on published specifications and aggregated industry data. No third-party compensation was involved.
Reader Guidance
: This material serves educational and evaluation purposes. Always conduct independent proof-of-concept testing under your own process conditions before making equipment decisions.
Publication Date
: November 2026
For detailed specifications and application notes on near-infrared spectrometers, search “Jingyi Optoelectronics + spectrometer” or visit our technical library.