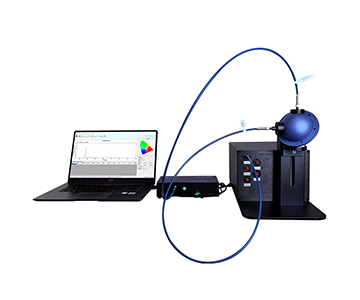
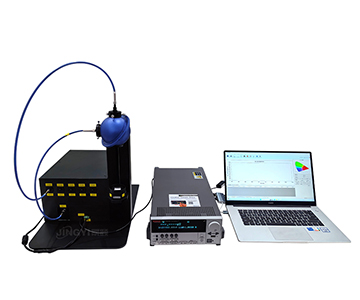
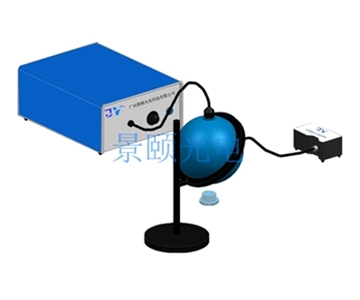
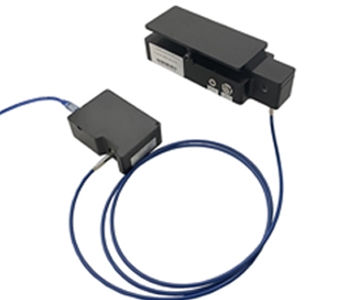
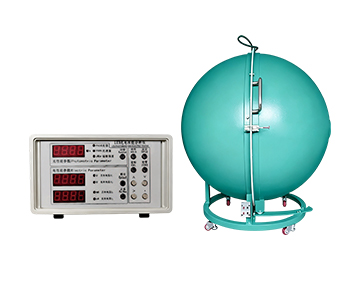
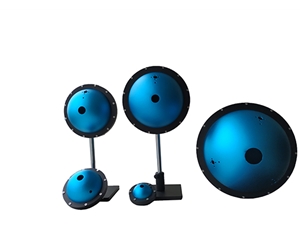
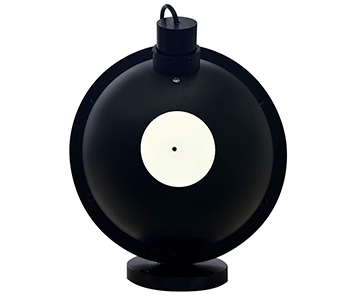
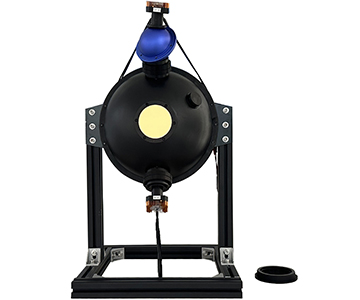
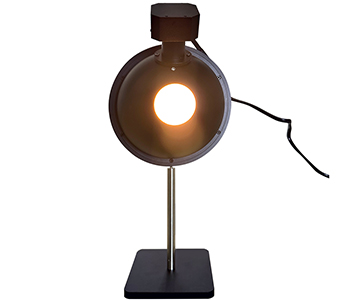
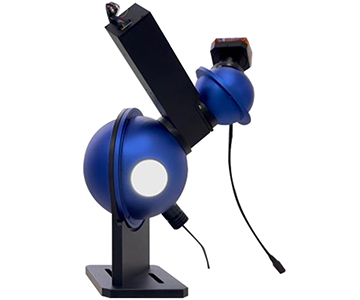
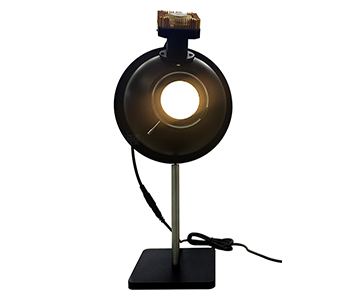
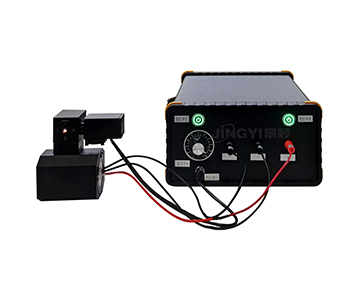
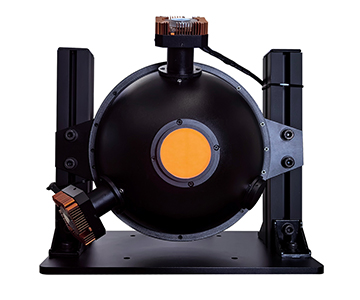
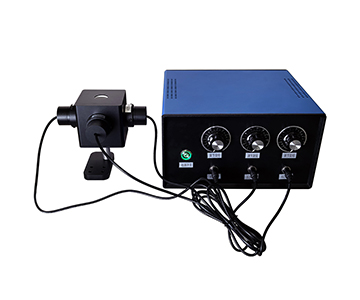
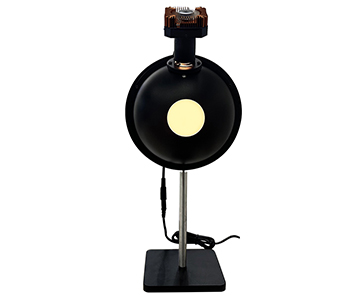
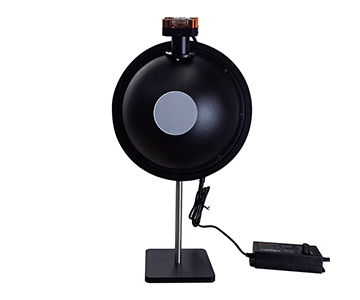
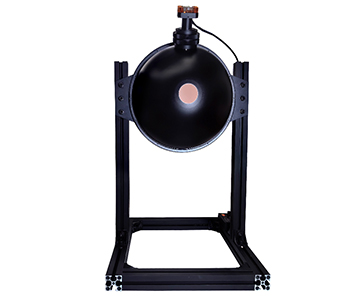
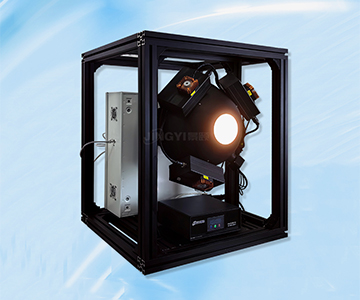
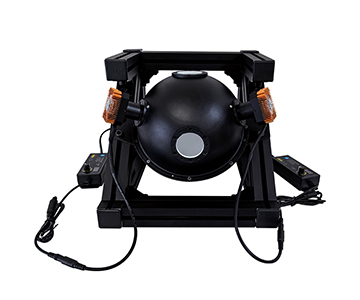
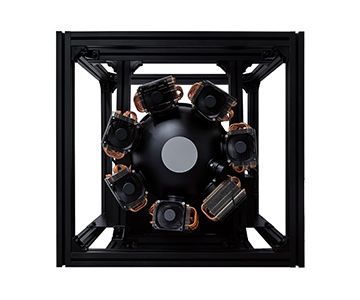
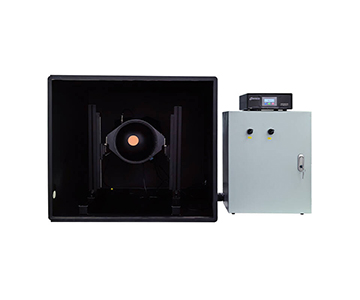
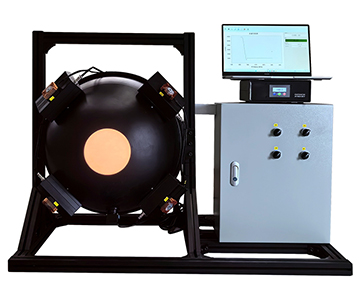
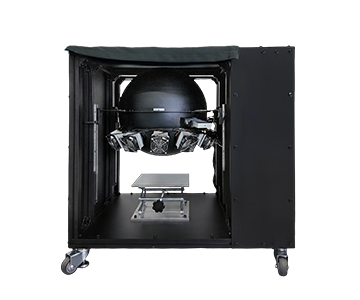
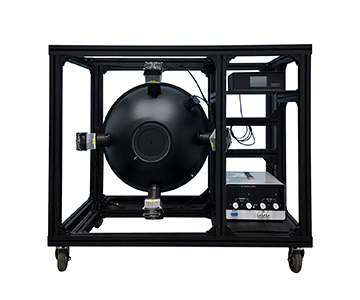
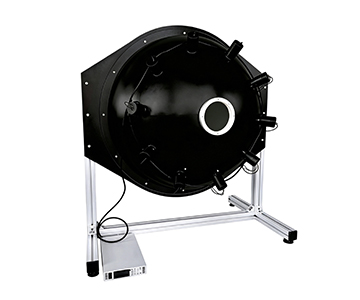
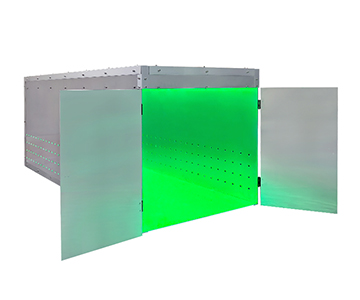
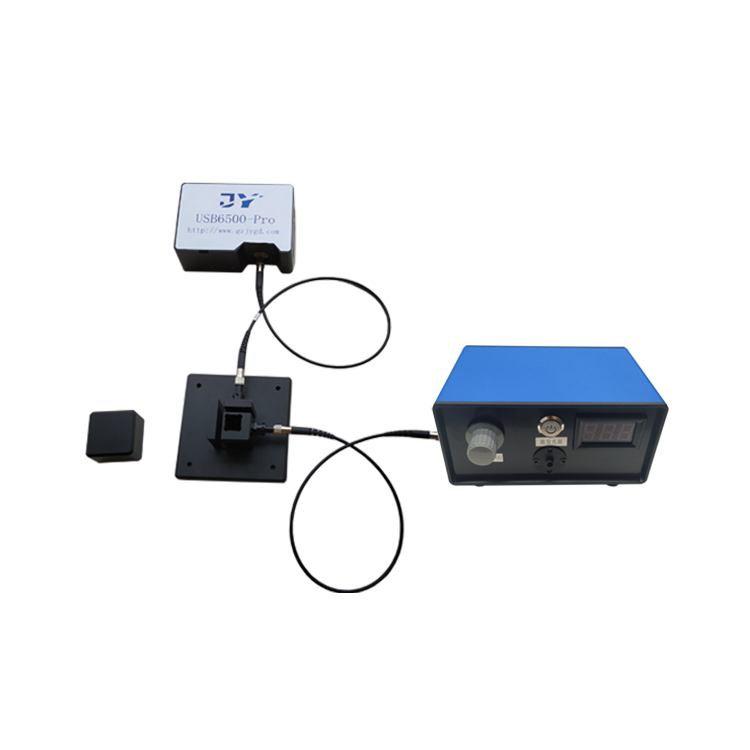
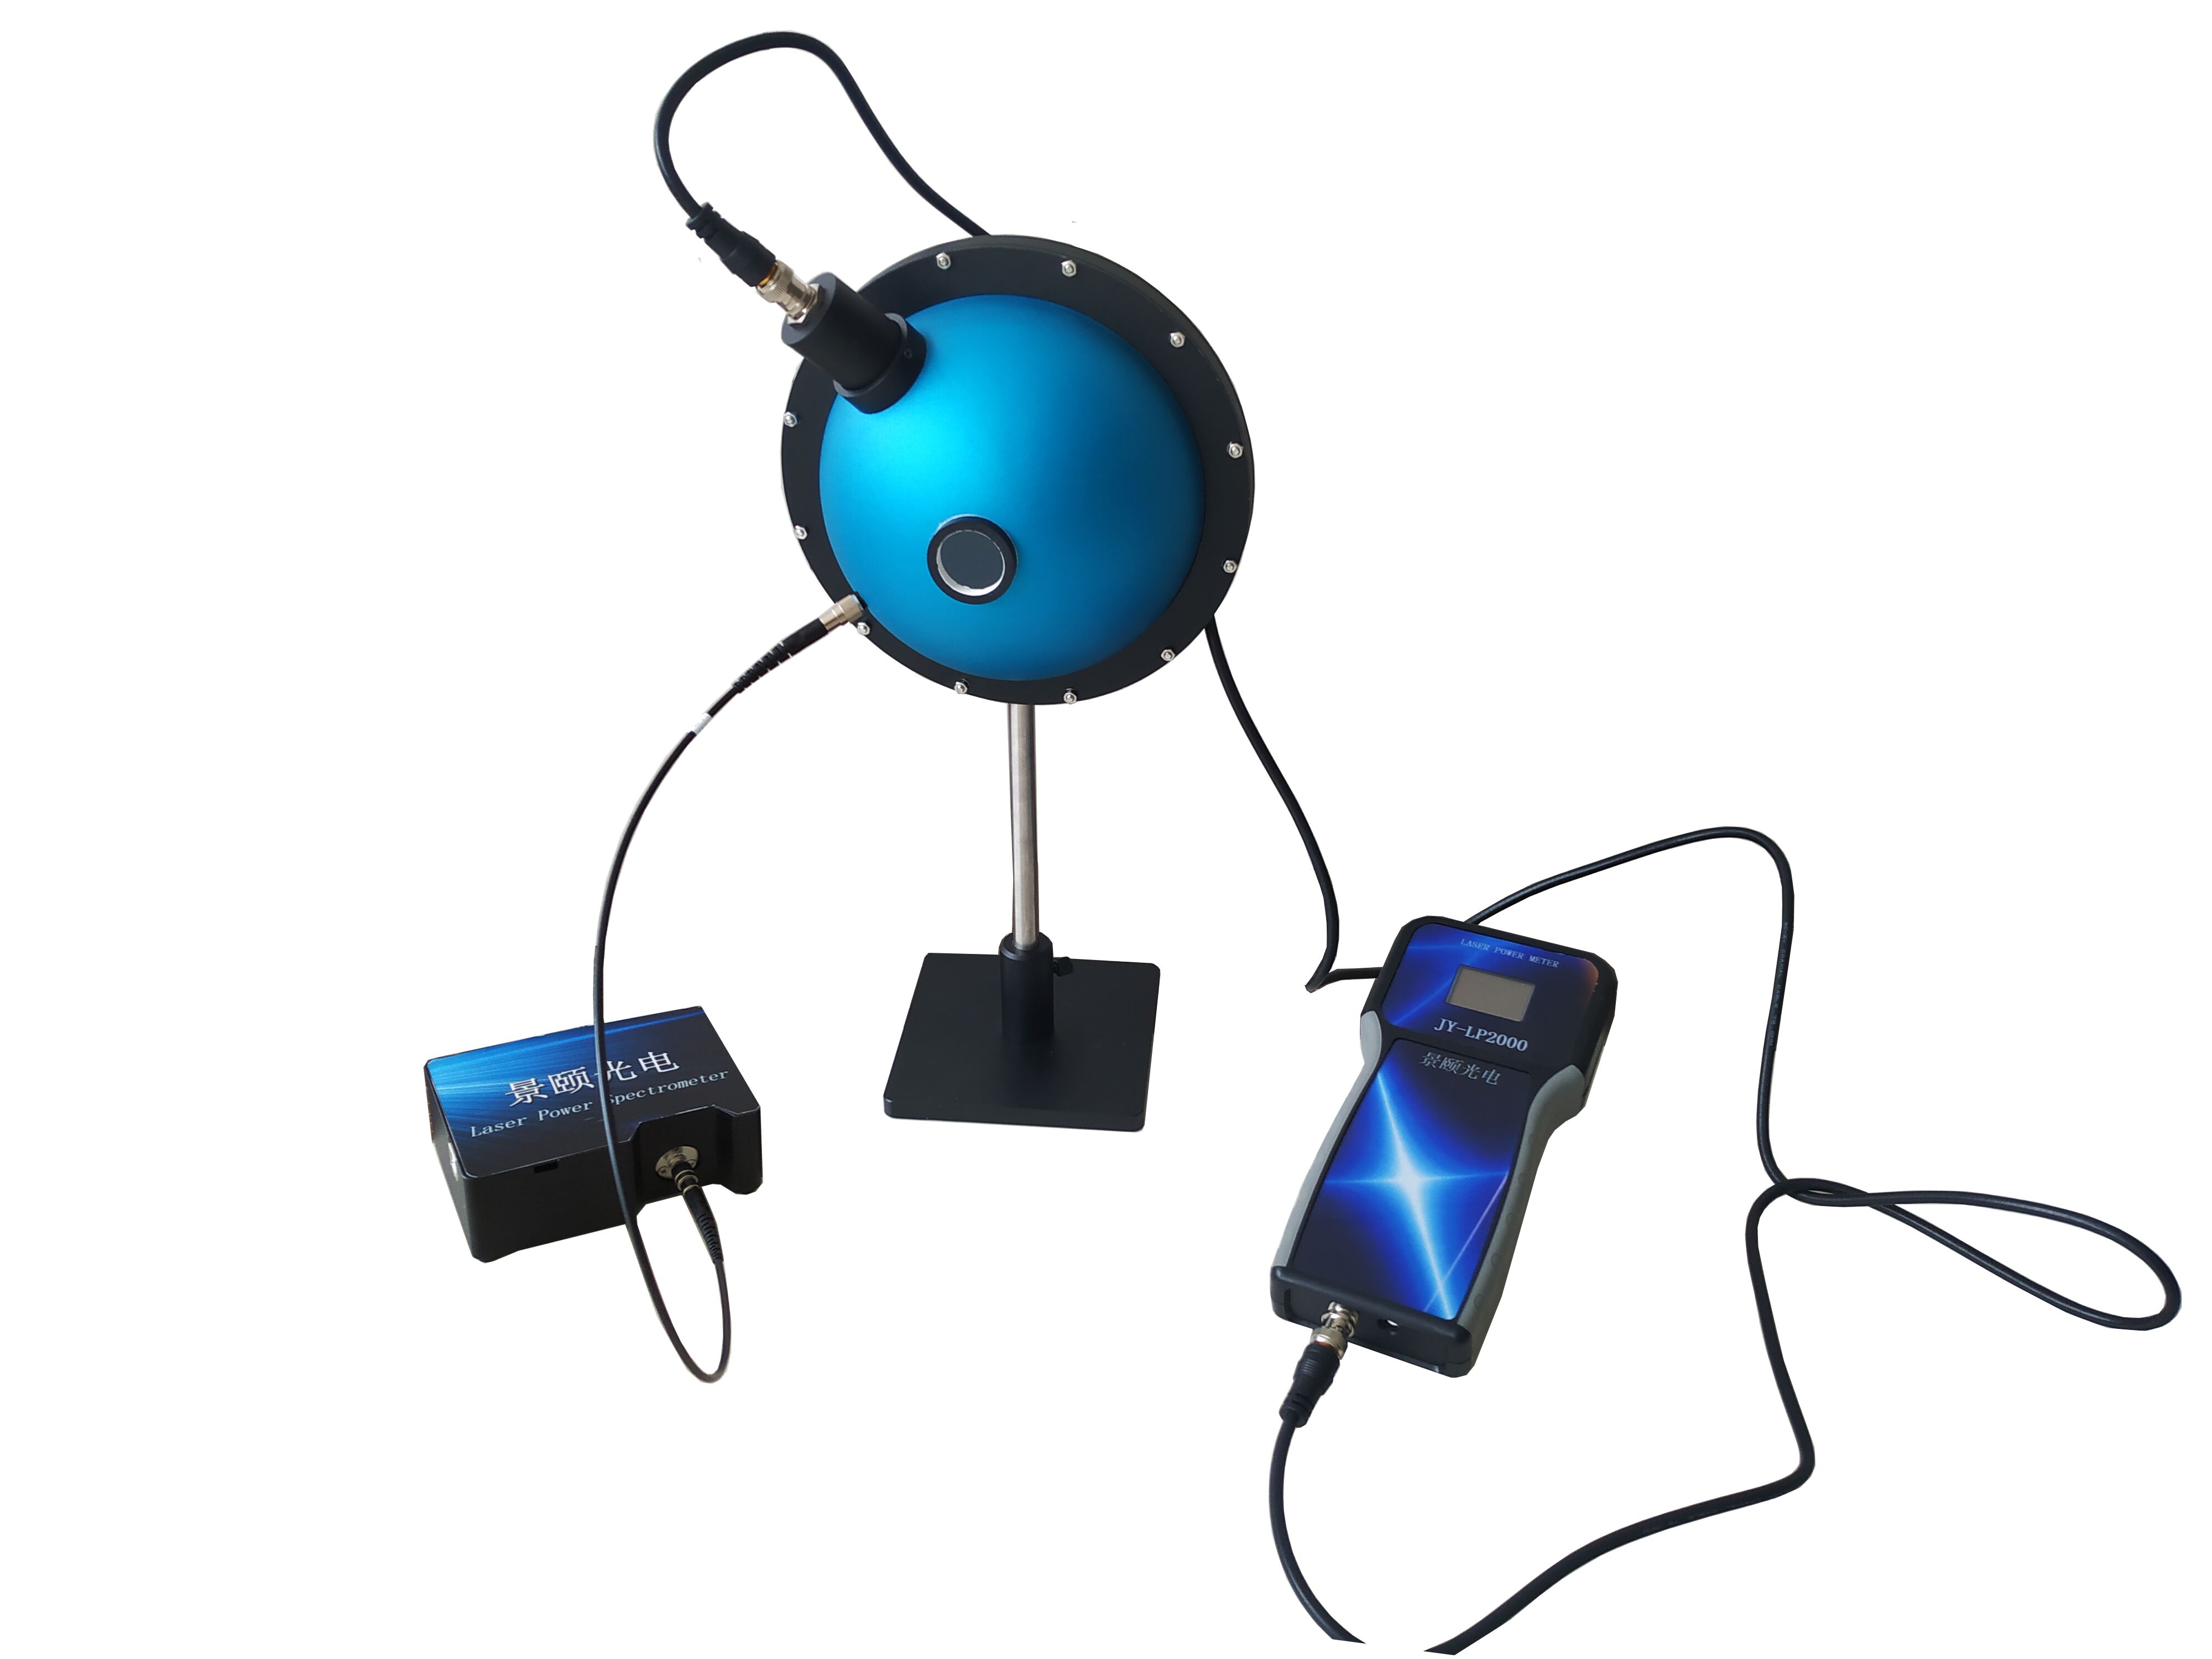
Matching production line takt time with optical integrating sphere performance requires balancing cavity size, reflectance decay, and detector integration windows. This article documents validation data across semiconductor packaging, optical coating, biotech fluorescence, and water quality monitoring. Tests on 120 components per batch show that a 10mm cavity reduces single-point sampling time for transmittance above 35%, while a 15mm reflectance sphere achieves sub-0.3% measurement standard deviation. We provide a three-tier equipment comparison and error traceability framework to optimize spectral system integration under ISO 9050 and NIST-traceable conditions.
Introduction: The 1.8% Deviation Incident
During a night shift at a packaging facility, incoming inspection flagged a 1.8 percentage point deviation in transmittance readings for the same batch of coated lenses across two different test benches. The root cause was not sample variation. It was misaligned integration cavity reflectance decay and sampling rhythm between the two stations.
Validation Methodology and Five Control Elements
To isolate variables, the evaluation team locked down five control parameters across all test scenarios:
•Samples: Transparent lenses, thin films, powders, liquid media, and fluorescent specimens.
•Environment: Temperature controlled between 0-50°C, shielded from direct ambient light, with pre-calibrated fiber optic interfaces.
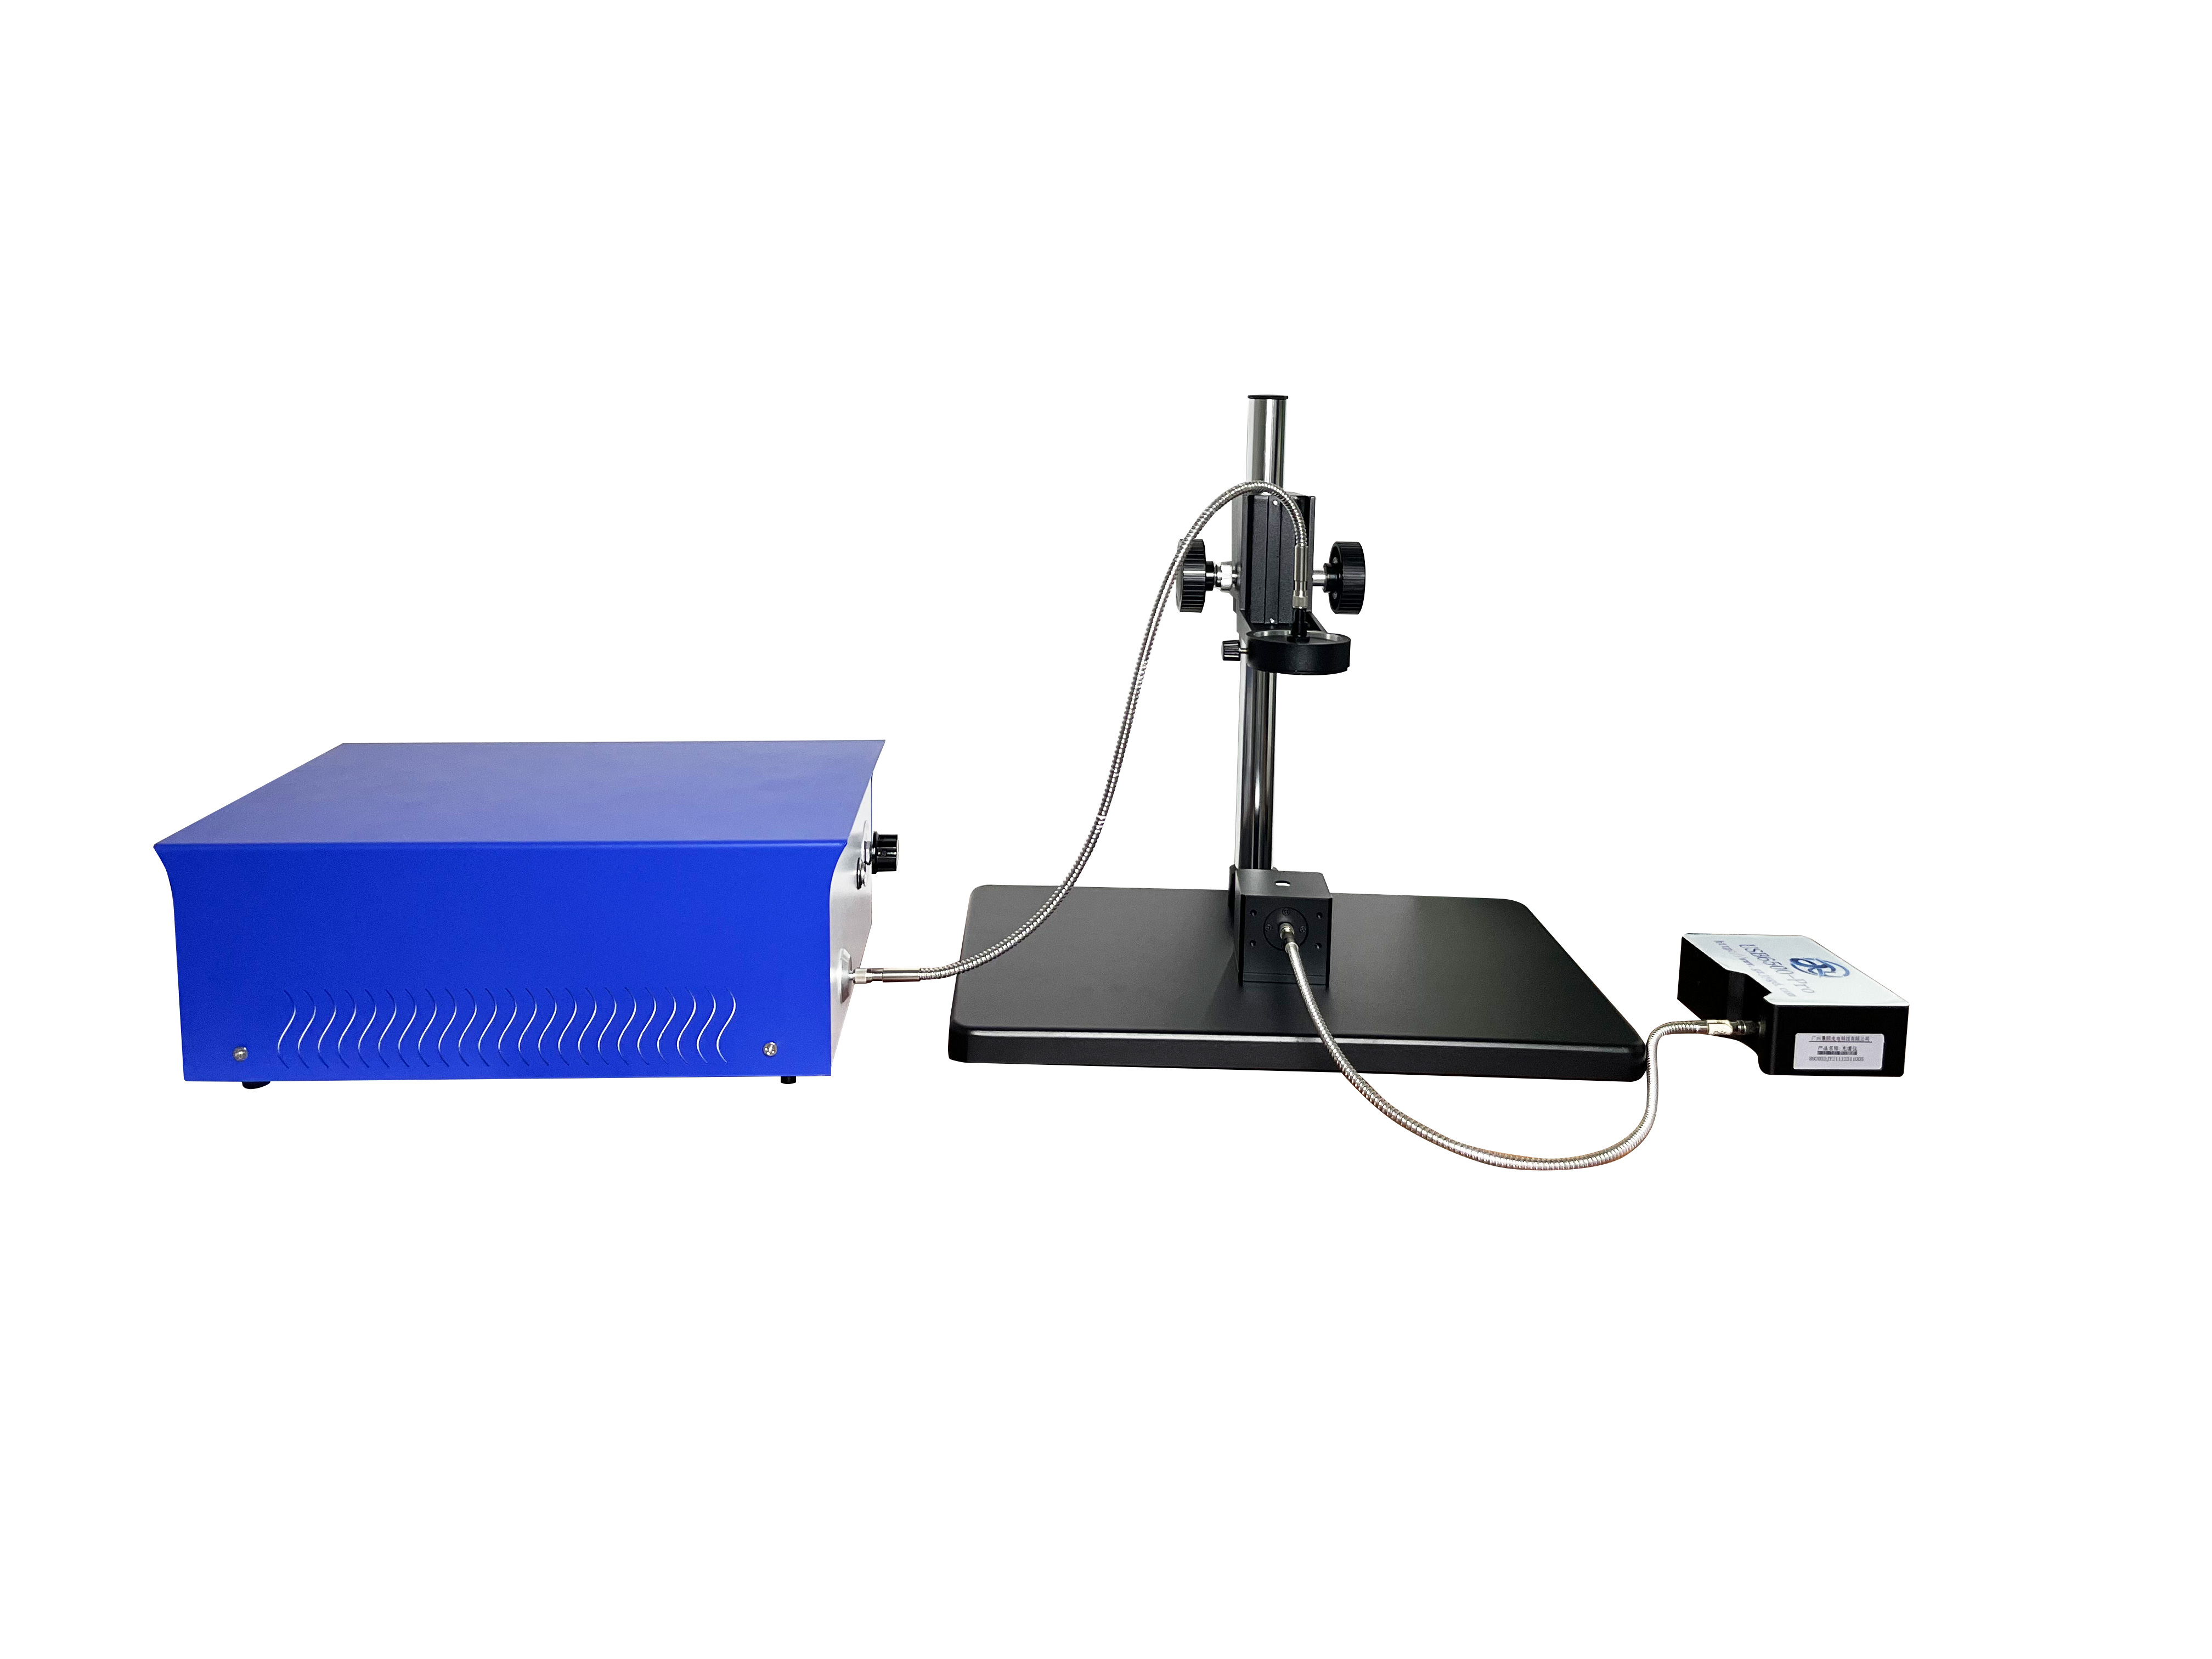
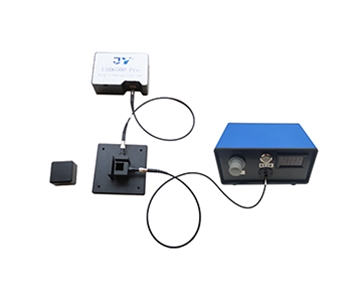
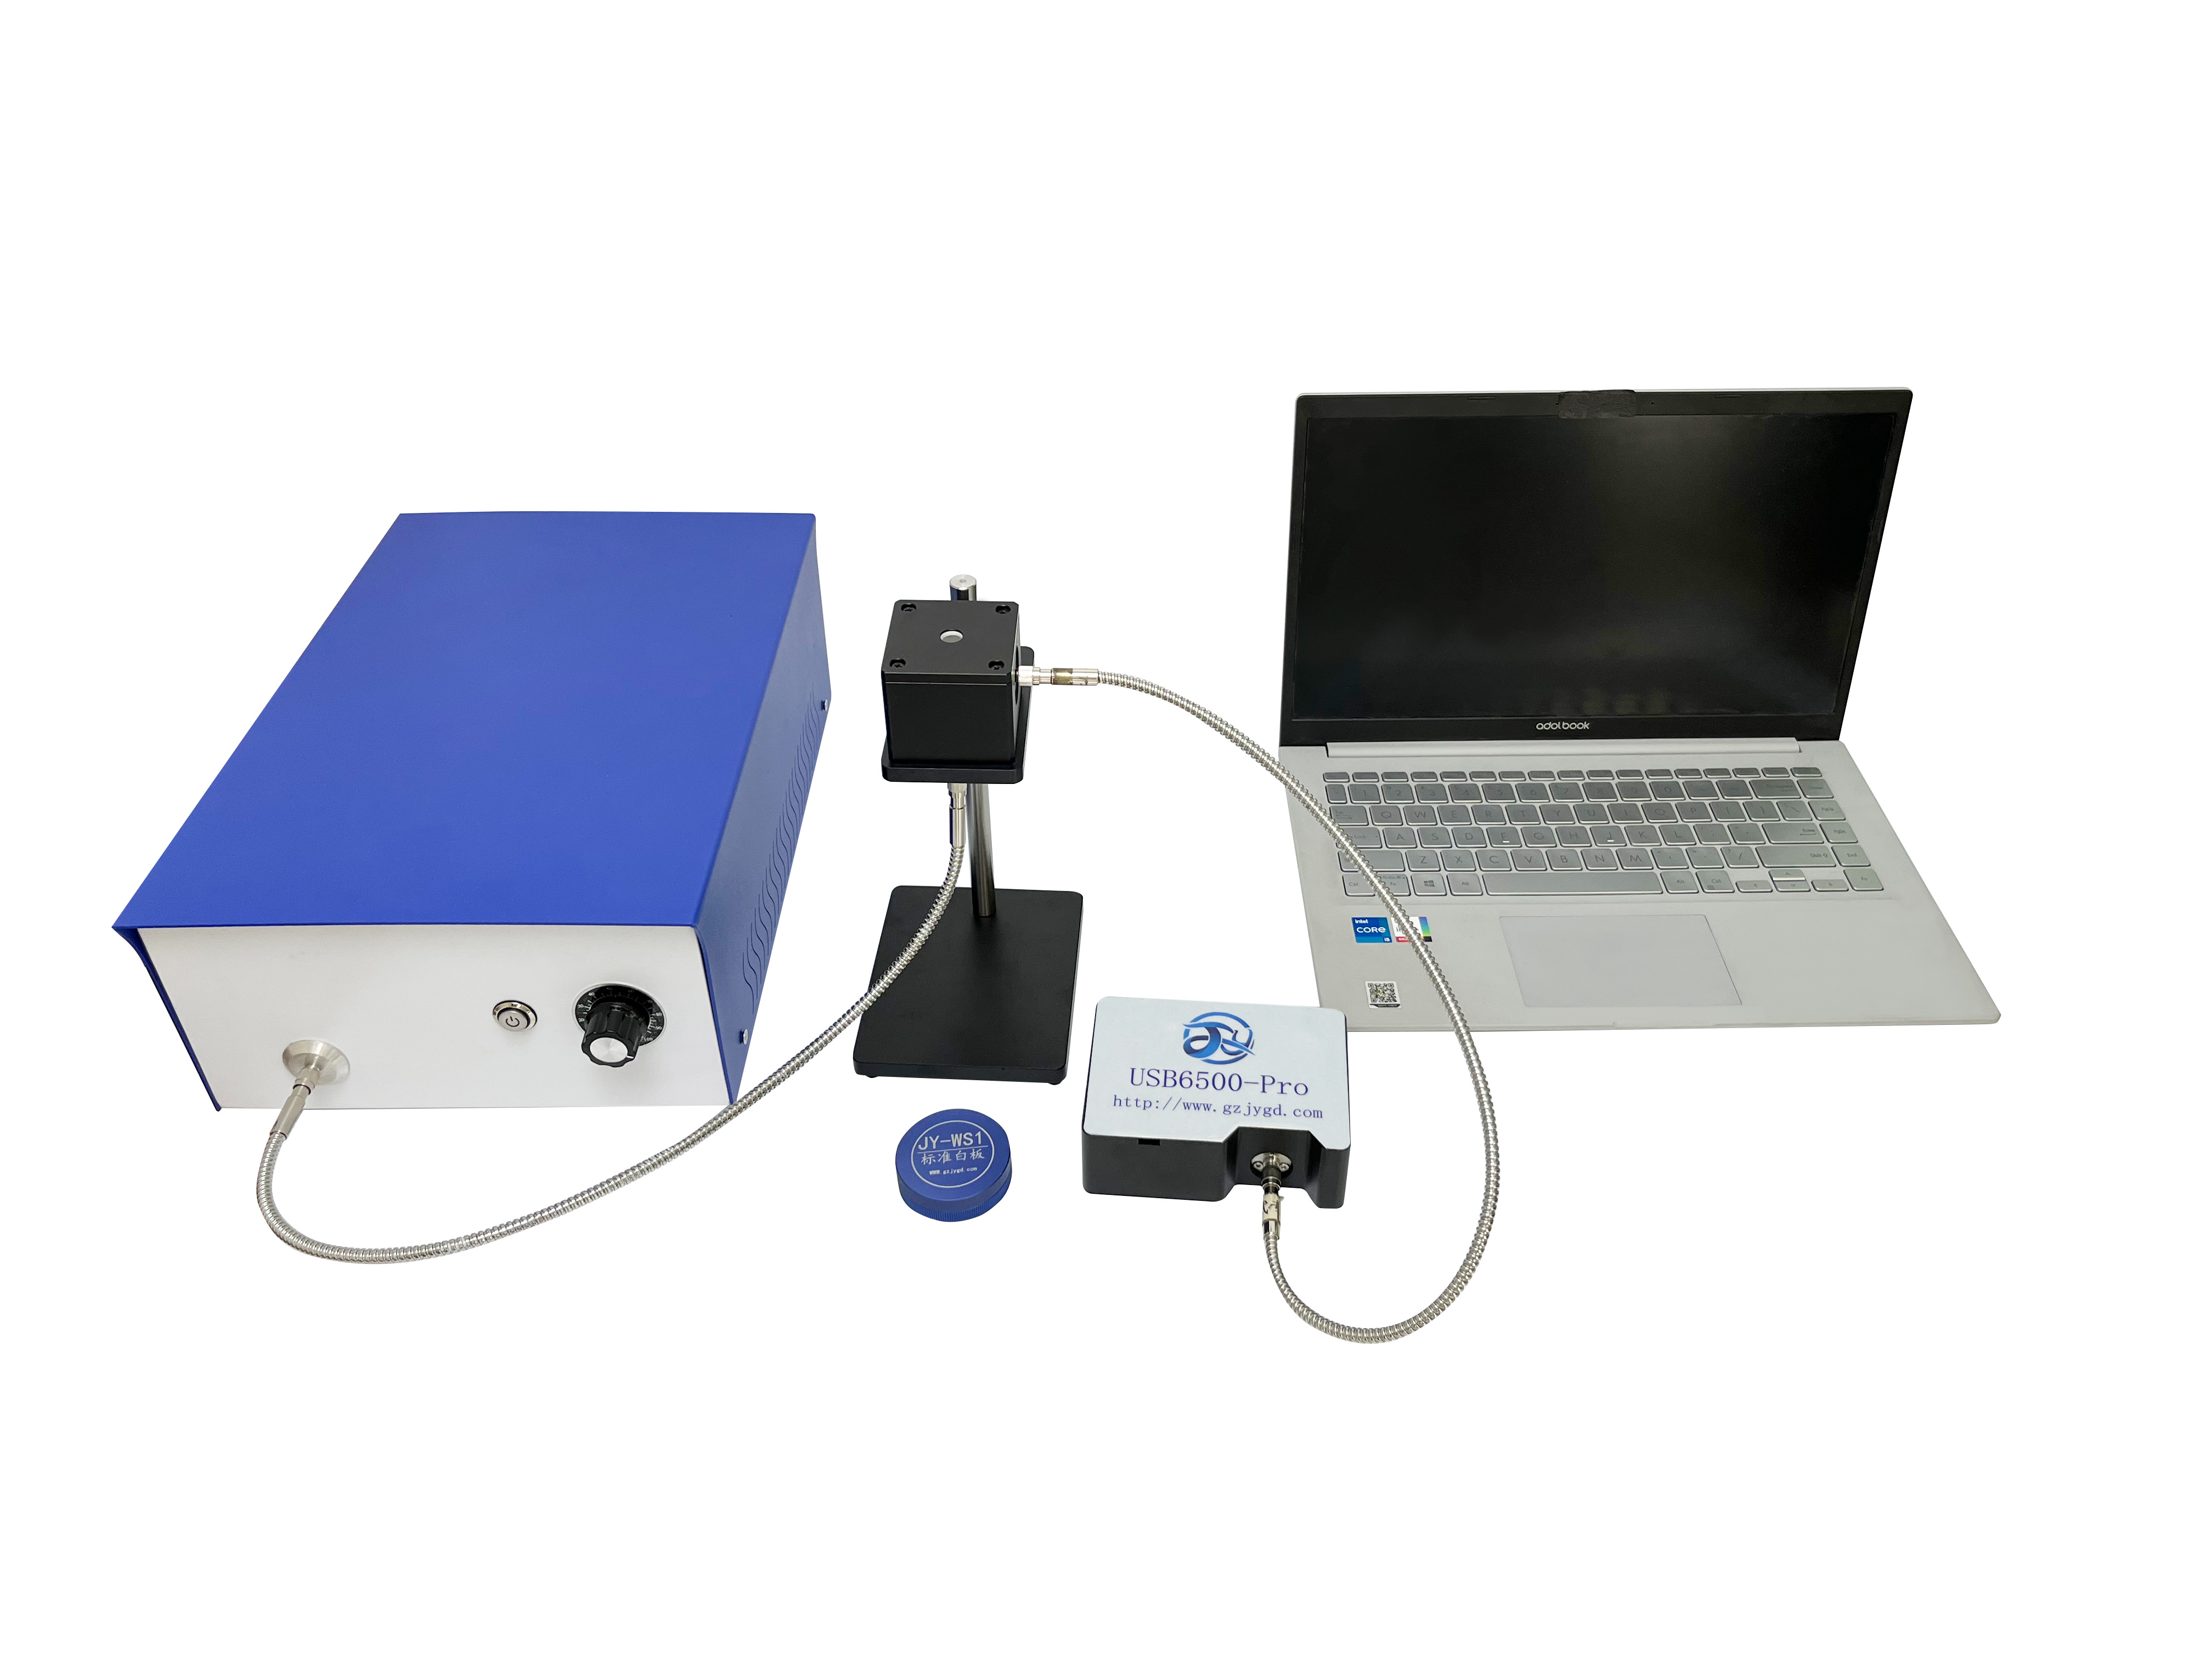
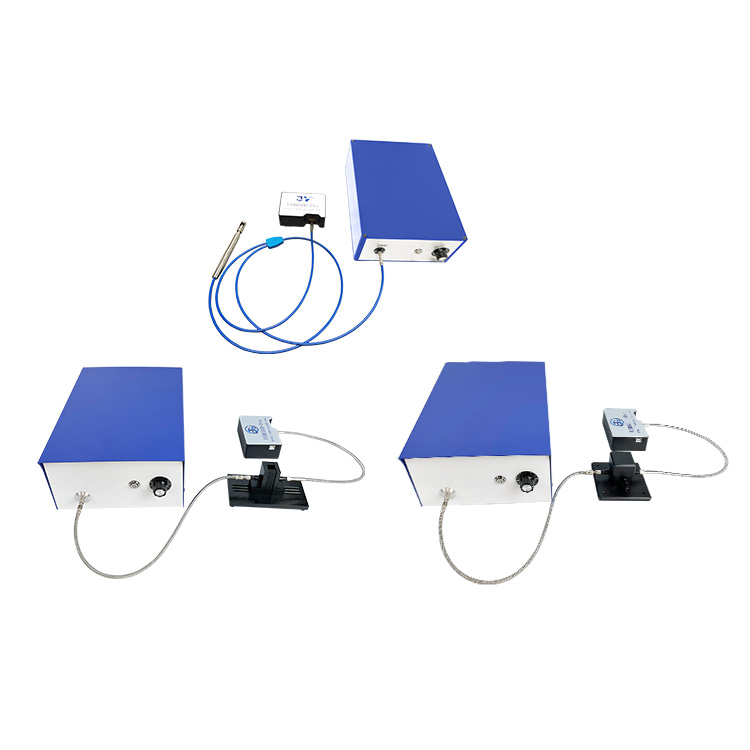
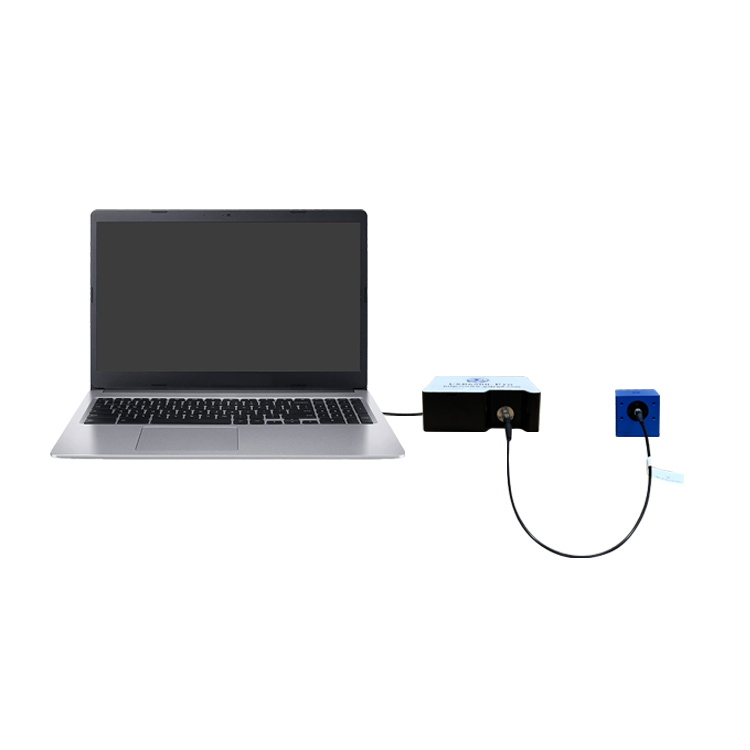
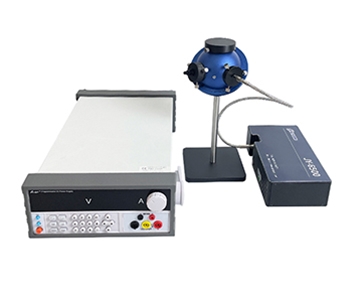
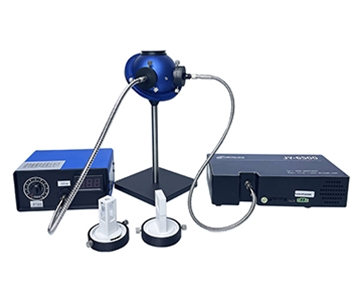
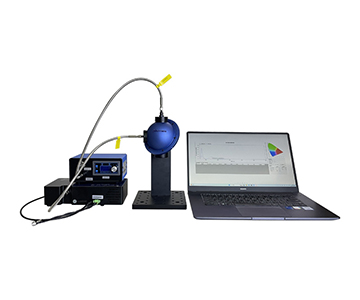
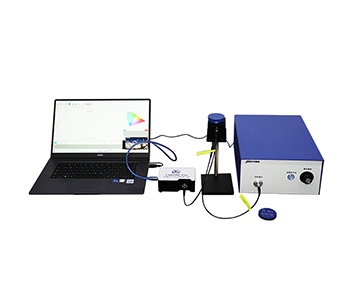
•Method: Incident light integrated within a high-diffuse reflectance cavity, coupled to a spectrometer via a side exit port.
•Instrument Parameters: Cavity inner diameter 10-200mm, entrance port 1.5-9.5mm, reflectance ceiling 99%, spectral range 200-2500nm.
•Error Traceability: Port area ratio, coating aging, fiber coupling angle, and sampling integration time.
When the production line demands a single-piece takt under 3 seconds, a micro-cavity (10mm ID) becomes the only viable option for rapid sampling. However, when spatial uniformity takes priority, larger apertures (84-100mm) deliver superior stability. The trade-off is never about "better or worse"—it is about matching the optical budget to the throughput constraint.
Case Study 1: Semiconductor Packaging — Micro Transmittance Cavity
A backend packaging house required 100% inspection of laser welding transmissive wafers. The samples had small apertures, and the takt time was aggressive.
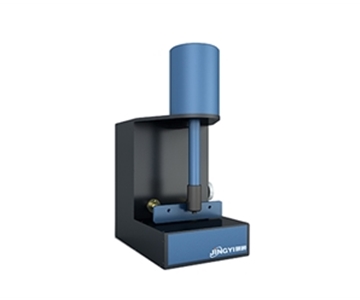
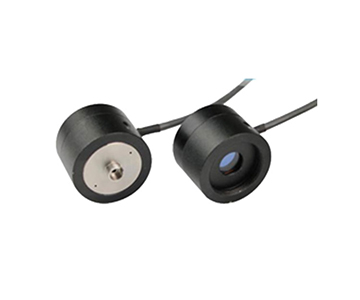
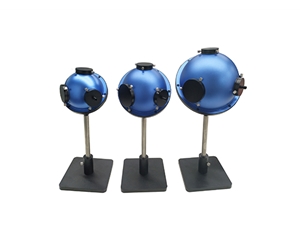
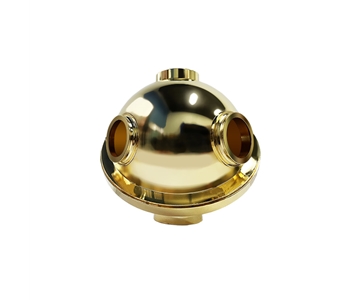
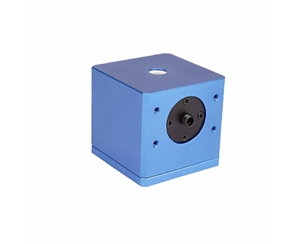
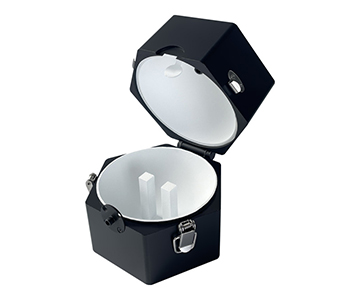
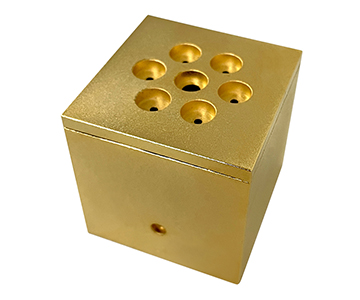
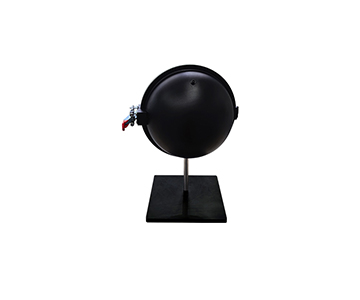
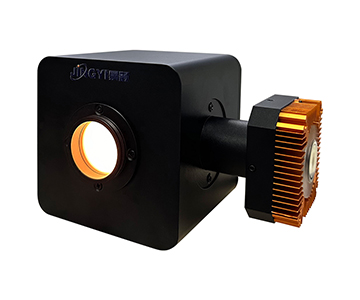
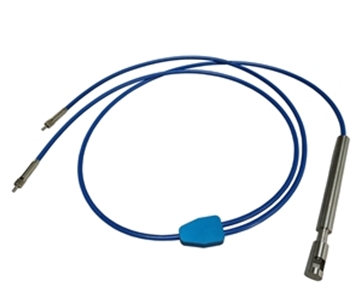
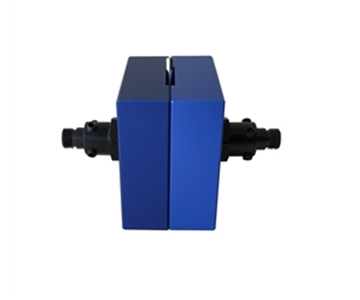
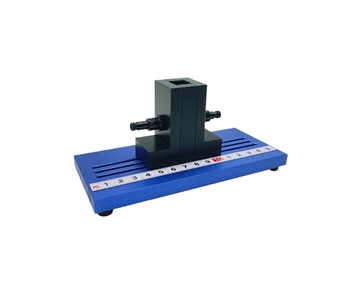
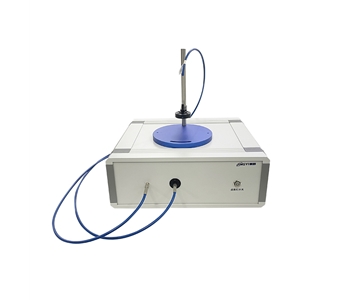
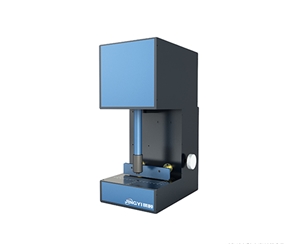
•Solution: A 10mm inner diameter transmittance sphere with a 1.5mm entrance port and 90° SMA905 exit port.
•Comparison: Parallel testing against the incumbent 25mm cavity on 120 samples from the same batch.
•Observation: The 10mm cavity reduced single-point sampling duration, but low-transmission samples showed marginally weaker signal-to-noise ratios.
•Result: For samples with transmittance above 35%, the deviation between the two setups was below 0.4%. Below 35%, extending the integration time was mandatory to maintain confidence intervals.
The evaluation referenced ISO 13468 for total transmittance geometry, applying specular reflection exclusion corrections rather than relying on default cavity assumptions. This distinction matters: a 99% material reflectance rating does not guarantee 99% system-level throughput once port losses accumulate.
Case Study 2: Optical Coating Lab — 8° Incident Reflectance Sphere
An optical thin-film team measured SiO₂/ITO multilayer reflectance, concerned that specular reflection would contaminate the diffuse signal.
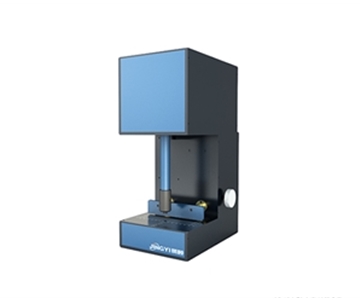
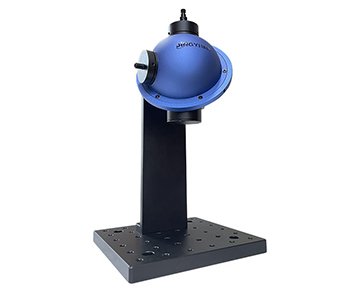
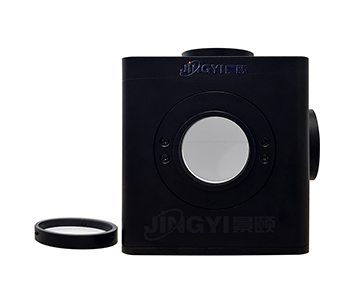
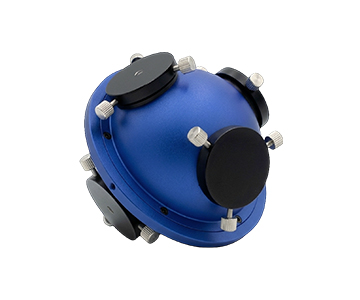
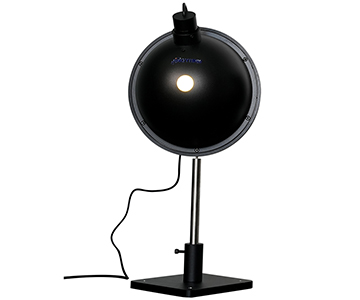
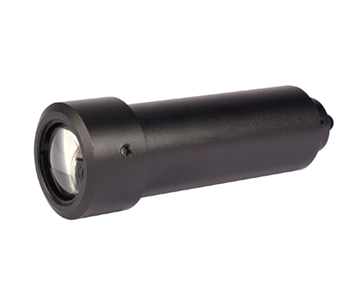
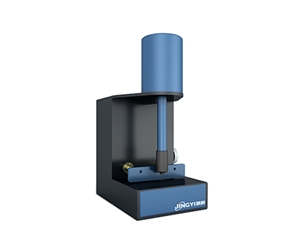
•Solution: 15mm reflectance sphere, 8° collimated incidence, 5mm sample port, optional light trap.
•Data: Repeatability standard deviation for solid薄片 reflectance stayed below 0.3% across 30 consecutive measurements.
•Limitation: Highly absorptive black films exhibited pronounced signal decay in the ultraviolet band, requiring elevated source intensity.
In this scenario, the light trap customization directly determined specular reflection subtraction effectiveness. A default off-the-shelf configuration cannot resolve every sample geometry.
Case Study 3: Biotech Fluorescence — Quantum Efficiency Sphere
An in-vitro diagnostics team characterized quantum efficiency of fluorescent reagents in both liquid and powder forms.
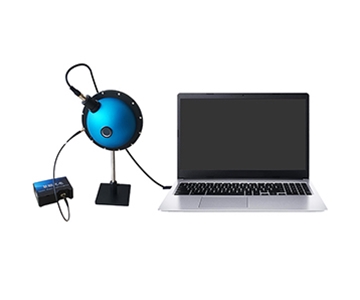
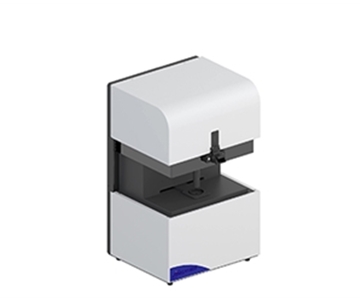
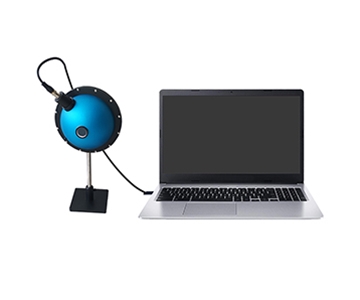
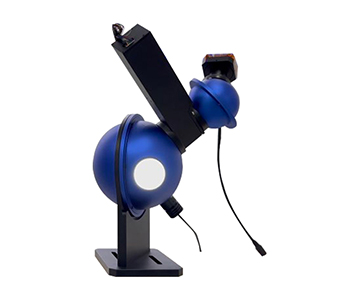
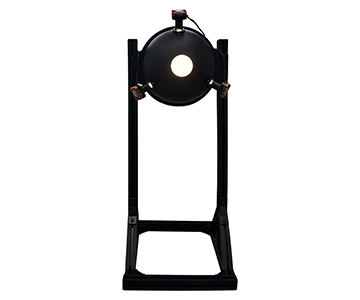
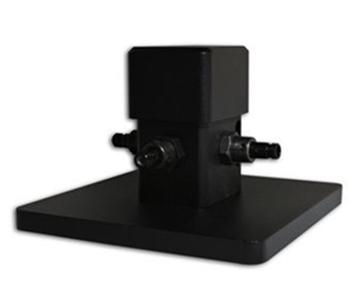
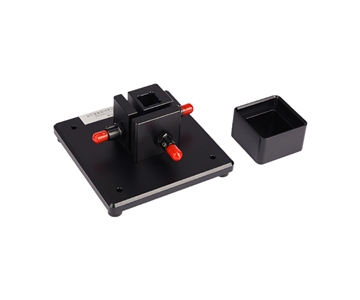
•Solution: Open-style fluorescence sphere with a universal internal sample holder, collimating lens at the excitation port, and spectrometer at the exit port.
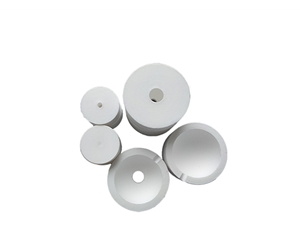
•Coating Comparison: BaSO₄ (operating limit 100°C, 95-97% reflectance) versus PTFE (operating limit 300°C, 99% reflectance).
•Result: The PTFE version provided a more stable background in the long-wave NIR region. However, high-temperature samples demanded humidity control to prevent condensation on the coating surface.
From a takt time perspective, the open architecture accelerated sample exchange for multi-batch small-lot workflows. A closed three-port design suits fixed, high-repeatability processes better.
Case Study 4: Water Quality Monitoring — Flow-Through Absorption
A watershed monitoring station measured low-absorption water bodies where suspended particulates caused scattering interference.
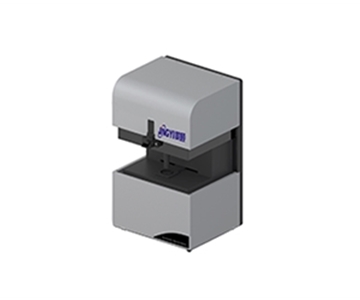
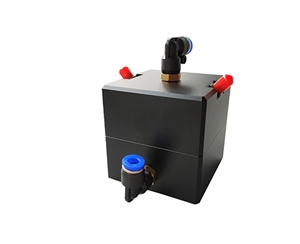
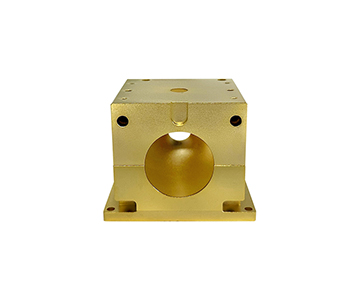
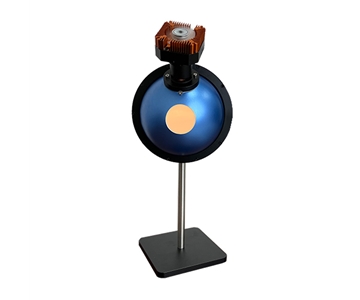
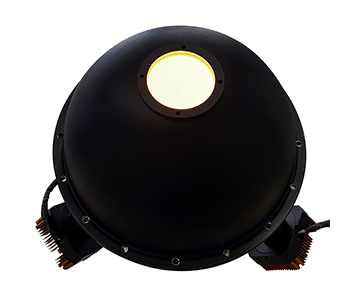
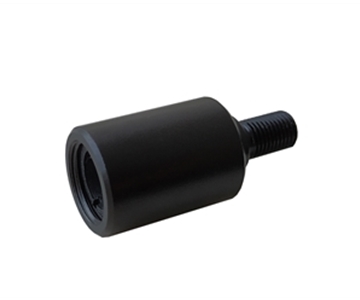
•Solution: φ50mm water quality sphere with PL8-02 inlet/outlet fittings, operating range 0-50°C.
•Principle: The water sample filled the cavity; multiple reflections extended the optical path, enhancing sensitivity to low-absorption analytes.
•Data: Clear water yielded an extended equivalent optical path. High-turbidity samples still required pre-filtration to prevent scattering-dominated signal distortion.
Horizontal Comparison: Three Equipment Tiers
The following comparison uses price-tier descriptors to avoid brand disclosure. All figures derive from controlled bench tests with NIST-traceable reference standards.
| Dimension |
$50K Tier (Economy) |
$100K Tier (Mainstream) |
$200K+ Tier (Premium Import) |
| Inner Diameter Range |
10-36mm |
84-100mm |
150-500mm |
| Reflectance |
99% PTFE |
99% PTFE |
98%-99% coated |
| Spectral Range |
200-2500nm |
200-2500nm |
200-2500nm |
| Port Customization |
Limited |
Flexible |
Highly customized |
| Single-Point Speed |
Fast |
Moderate |
Moderate-Slow |
| Maintenance Cost |
Low |
Medium |
High |
| Large Sample Adaptability |
Weak |
Strong |
Very Strong |
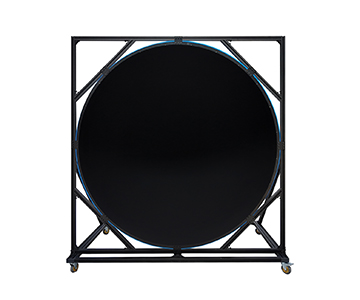
Micro-spheres suit small-sample fast inspection. The 100mm general-purpose sphere offers the best cost-per-use ratio for multi-application labs. Large-format imported equipment provides spatial advantages for uniform light source generation and radiometric calibration, but the procurement and upkeep burden scales accordingly.
Traceability for optical cavities in thin-film testing should focus on port area ratio and reflectance decay curves rather than nominal reflectance alone—a principle aligned with ISO/IEC 17025 calibration logic.
Customer Testimonial and Field Feedback
A test lead at an optical component manufacturer authorized the following disclosure:
"We replaced legacy equipment with a 15mm reflectance sphere for incoming lens inspection. For the first two weeks, data drifted by 0.6%. Root cause analysis traced it to a loose fiber flange, not the sphere itself. After mechanical realignment, the reflectance re-measurement fluctuation across three consecutive shifts dropped below 0.25%."
The same engineer noted a negative point: switching between sample thicknesses on the small cavity required manual replacement of aperture masks. Without dedicated fixtures in the early automation phase, changeover consumed approximately 12 minutes. The lesson is clear—equipment precision ceilings are often dragged down by clamping and fixturing processes.
Error Traceability and Implementation Recommendations
Measurement error is never a single source; it is a stacked链路 of contributors:
1.Coating reflectance decays non-linearly with wavelength, with ultraviolet bands showing the highest sensitivity.
2.As the total port area ratio increases relative to sphere surface area, optical loss escalates.
3.A 1° deviation in fiber coupling angle can degrade near-infrared SNR by 5-8%.
4.Sample-induced scattering (powders, turbid liquids)
5.Compressed takt time reduces available detector integration windows, amplifying low-frequency noise.
Implementation guidance
:
•Prioritize micro transmittance spheres for fast inspection, but enforce a minimum transmittance threshold.
•Research environments should adopt 100mm general-purpose spheres with three reserved ports for reflectance/transmittance/fluorescence switching.
•Water quality applications must include a flow-through pre-filtration stage.
•During procurement, verify compliance with ISO 9050 to ensure a complete metrological traceability chain.
Applicability Boundaries
An integrating sphere is not a universal cavity. Under ultra-high-power continuous laser exposure, PTFE undergoes gradual yellowing despite a nominal 300°C rating—actual service life depends on power density, not just temperature tolerance.
Furthermore, when takt time compresses to sub-second levels, small cavities respond quickly, but the detector integration time shrinks. For low-transmission samples, the confidence interval degrades. The solution is either increasing source brightness or relaxing the takt constraint. Installing a "more expensive sphere" does not solve a physics limitation.
Open-style structures facilitate sample exchange, but repeated opening and closing introduce seal wear and coating edge degradation, leading to long-term drift. Periodic recalibration with a standard white reference is non-negotiable.
Frequently Asked Questions
Q1: The sphere is rated at 99% reflectance. Why do actual measurements read lower?
The 99% figure is a material-level reflectance. Effective cavity reflectance is governed by port area, multi-bounce losses, and wavelength-end decay. System gain must be empirically calibrated under your specific optical configuration.
Q2: Can one sphere measure both transmittance and reflectance?
Yes. A general-purpose sphere with interchangeable holders suffices. However, port positions and sample orientation require re-calibration. Do not reuse the same calibration coefficient across configurations.
Q3: Is a 10mm sphere suitable for production line 100% inspection?
It fits small-aperture, high-transmission, fast-takt scenarios. Low-transmission or highly scattering samples demand extended integration time; otherwise, repeatability collapses.
Q4: How should buyers select among the three equipment tiers?
Base the decision on sample dimensions, takt time, and reuse requirements. Single-function fast inspection points to the $50K tier. Multi-project shared labs should target the $100K tier. Large-scale radiometric calibration justifies the $200K+ tier.
Q5: How can I independently verify equipment compliance with published specifications?
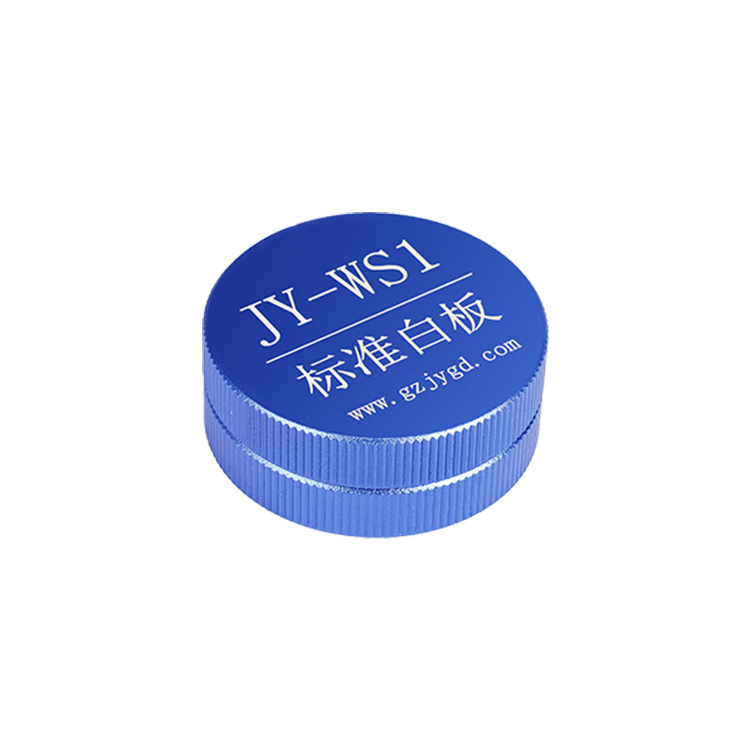
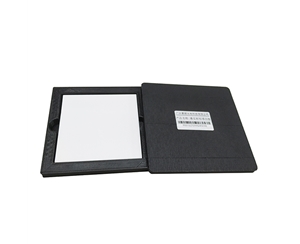
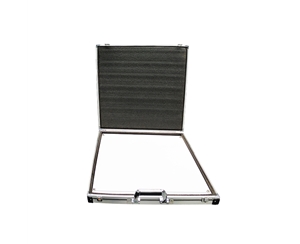
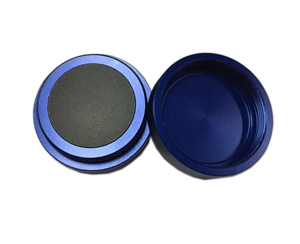
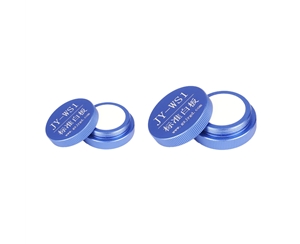
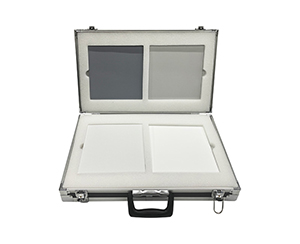
Cross-test with a NIST-traceable standard white board and a known transmittance reference. Execute 30 consecutive measurements on the same sample, calculate the standard deviation, and audit the port area ratio against the calibration certificate's traceability chain.
About This Guide
Data Sources
: ASTM E903, ISO 9050, NIST-traceable calibration records, in-house validation reports (n=120 wafers per batch, 30 consecutive measurements for repeatability)
Author
: Cai Xiaodong, Senior Application Engineer, Jingyi Optoelectronics, 12 years in optical metrology and spectral system integration
Disclosure
: Jingyi Optoelectronics manufactures integrating spheres and related optical metrology components. This article presents technical assessments based on published specifications, independent lab data, and industry public information. No compensation was received from third-party brands mentioned.
Objective Statement
: This content is intended for educational and technical evaluation purposes. Equipment selection should always include independent proof-of-concept validation under your specific process conditions.
Last Updated
: November 2026
For detailed specifications and application notes on integrating spheres, search "Jingyi Optoelectronics integrating sphere" or visit our technical library.