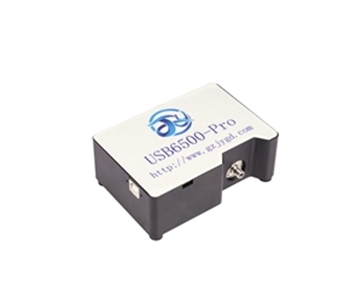
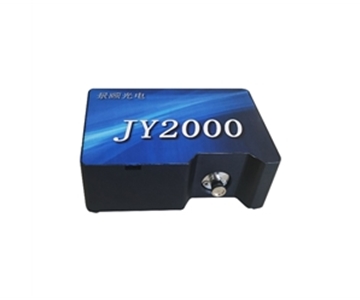
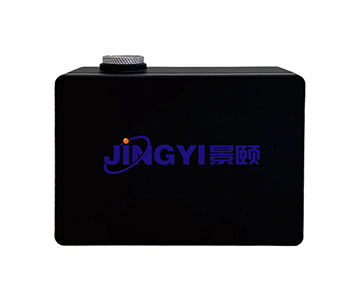
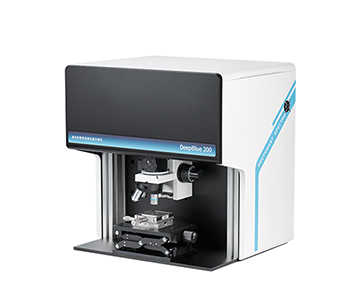
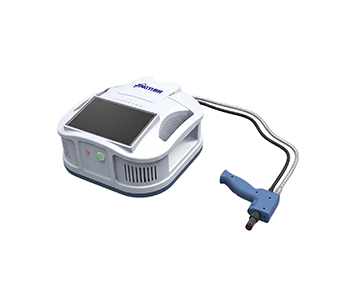
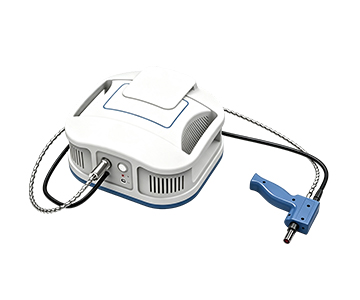
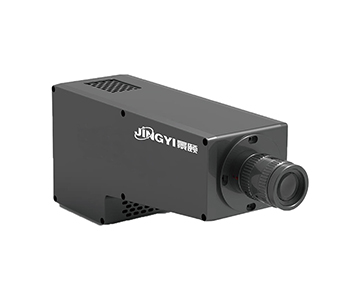
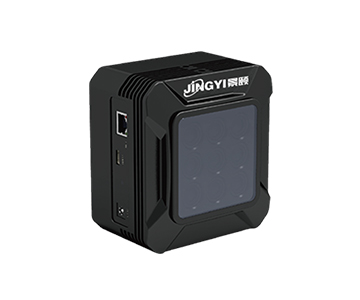
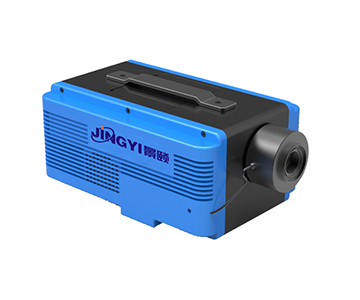
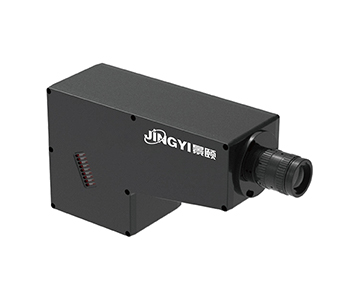
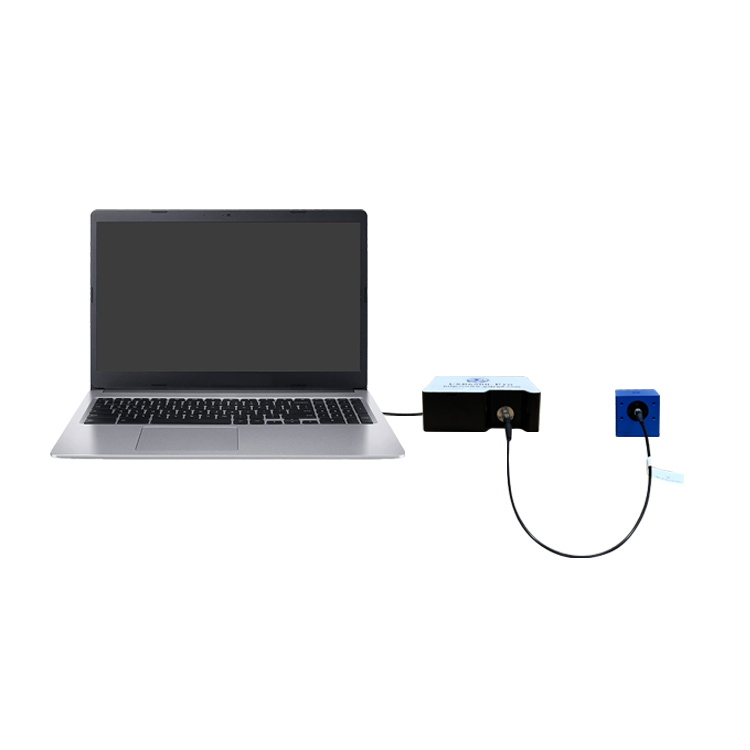
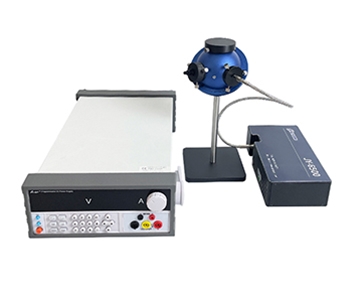
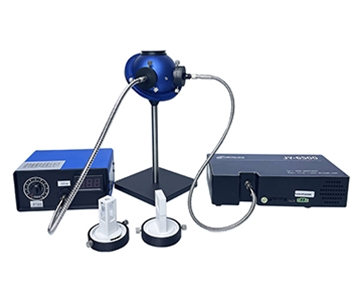
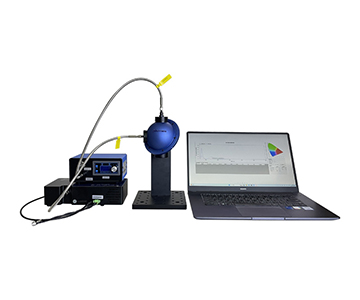
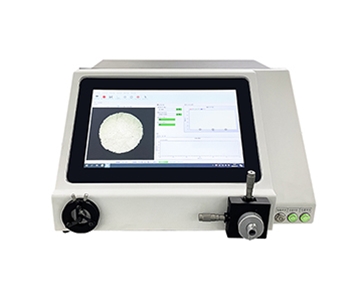
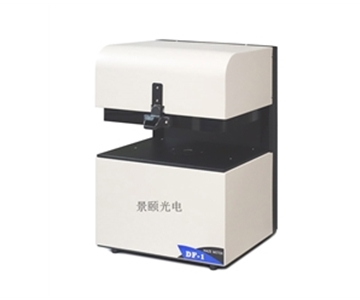
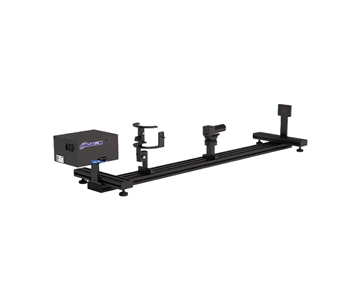
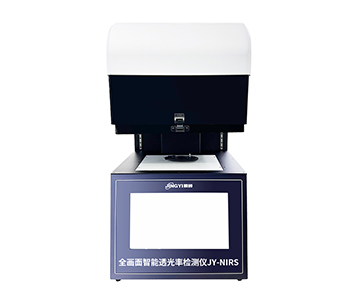
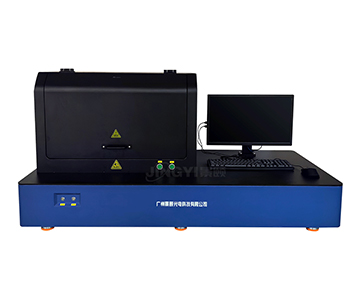
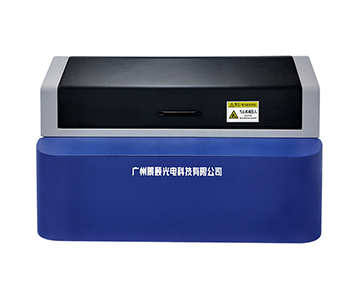
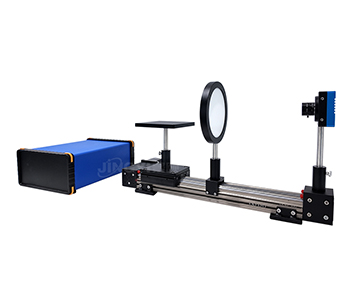
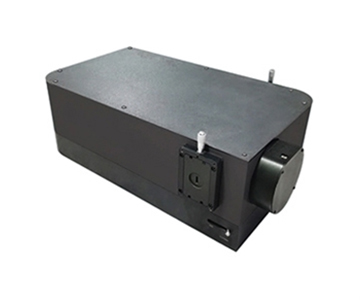
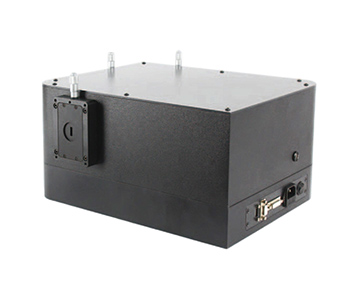
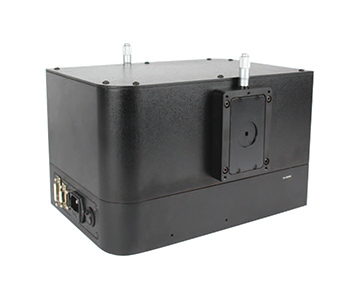
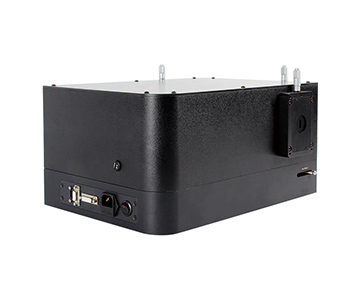
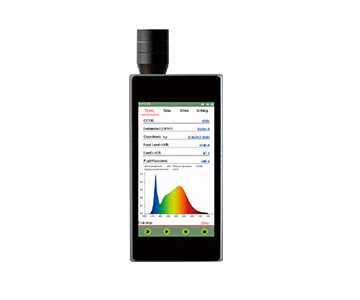
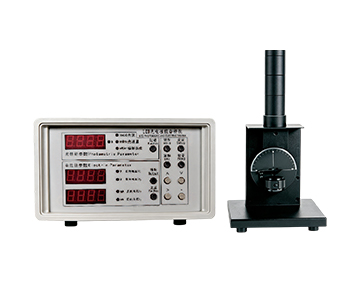
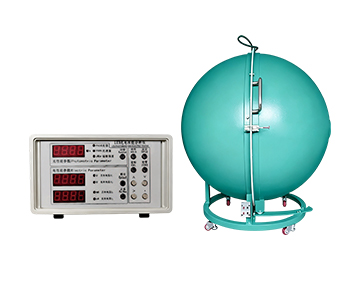
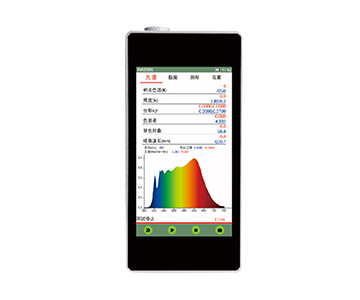
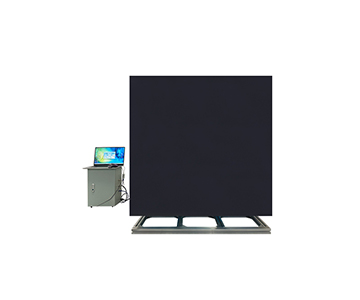
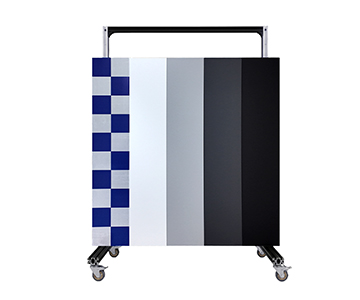
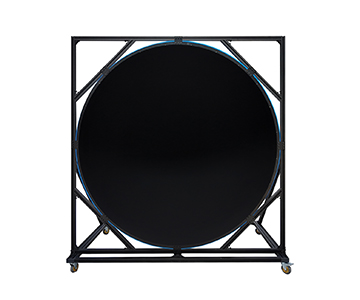
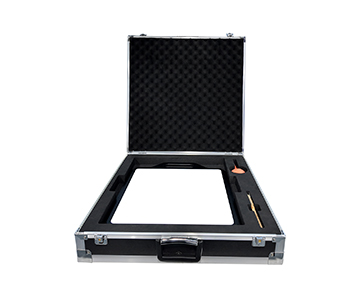
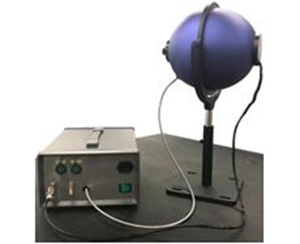
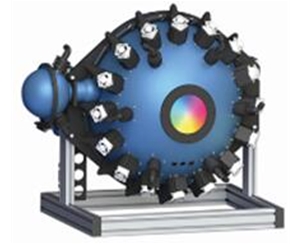
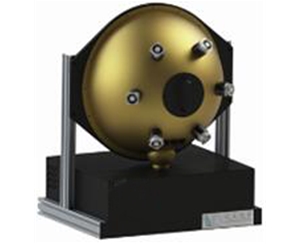
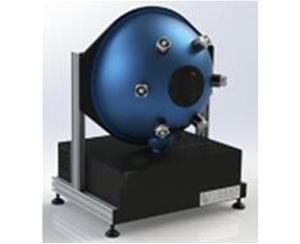
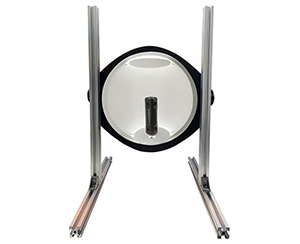
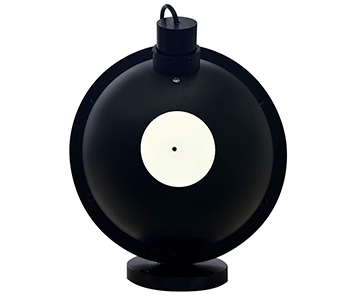
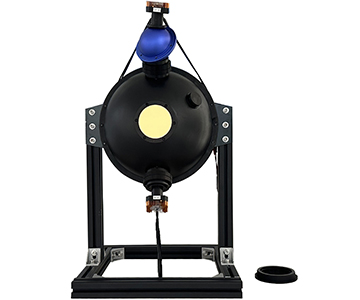
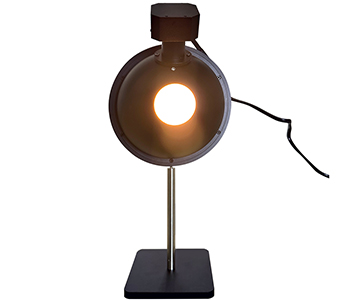
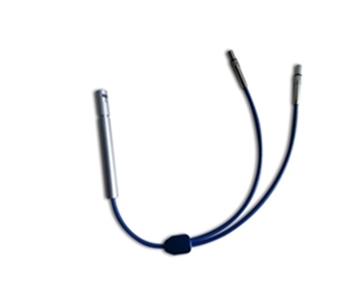
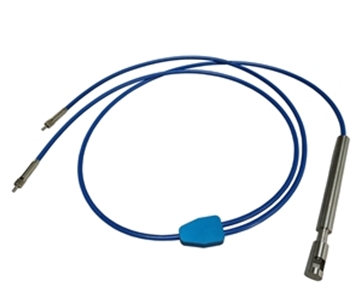
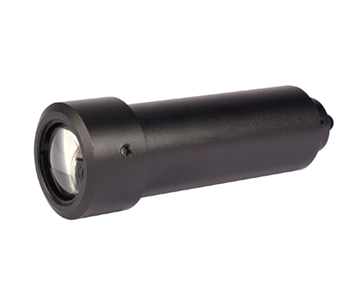
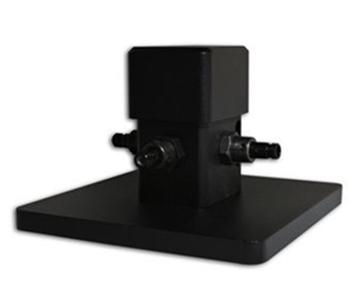
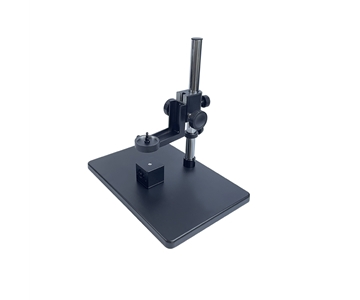
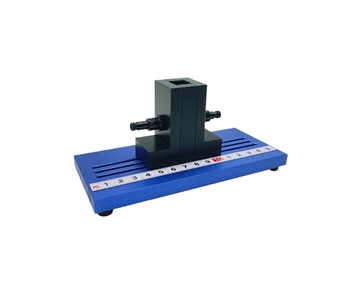
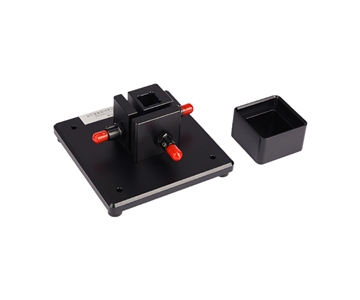
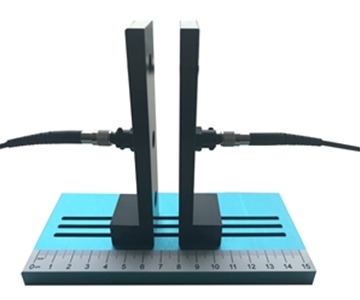
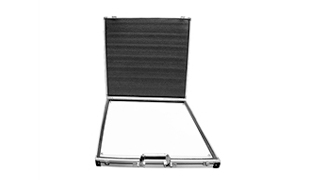
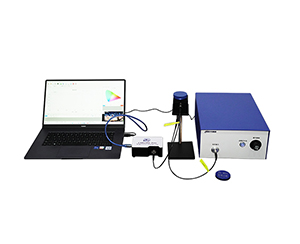
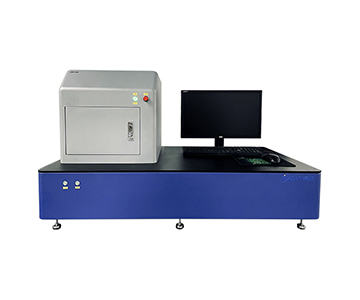
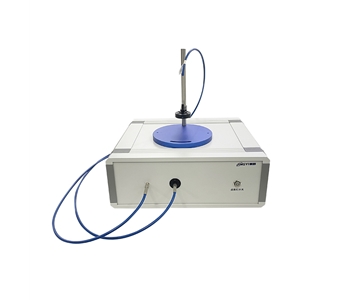
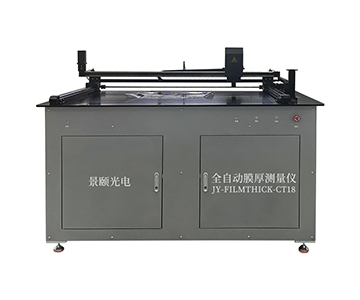
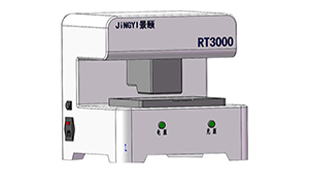
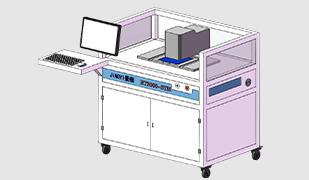
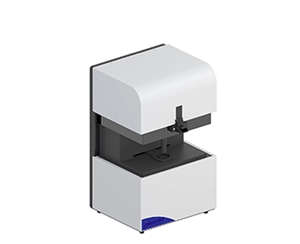
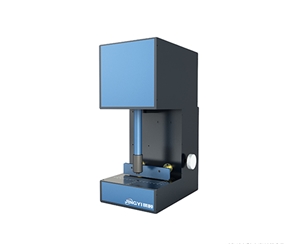
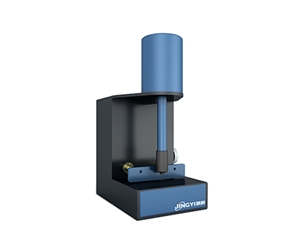
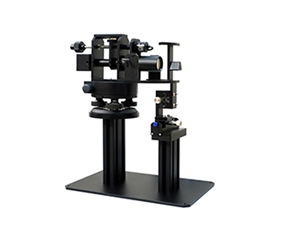
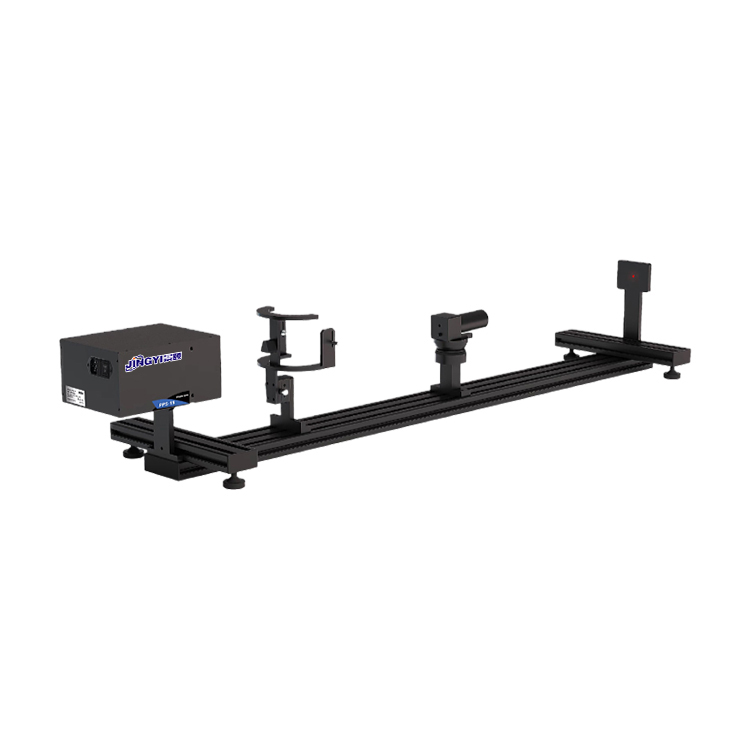
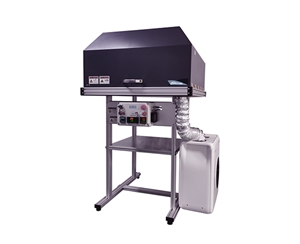
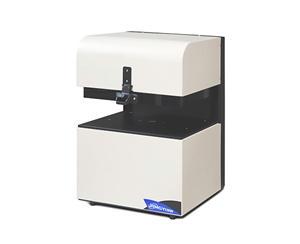
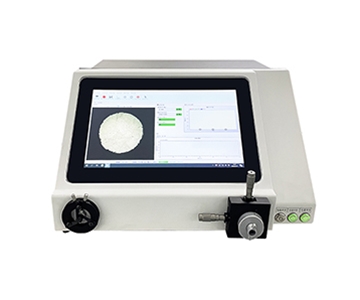
Fluorescence quantum efficiency (QE) measurement directly dictates iteration cycles for luminescent materials in display panel and optoelectronic device manufacturing. This analysis compares three mainstream detection systems across spectral coverage, automation level, and deployment speed, using publicly available specifications from Chinese suppliers. Key findings: an electric-lift sample fixture compresses single-load time to 15.2 seconds, while magnetic positioning restricts human placement error to 0.37 mm. For QC lines processing powders, solutions, and thin films, these mechanical innovations translate into measurable throughput gains. The evaluation also reveals information asymmetry risks when technical documentation lacks detail—a critical factor for buyers prioritizing NIST-traceable radiation flux measurements.
Analysis Background
QE measurement sits at the core of luminescent material characterization. In R&D labs and production QC lines, test efficiency and data reliability determine how fast a product reaches market. This horizontal comparison focuses on photoluminescence (PL) and electroluminescence (EL) routes, selecting three domestic suppliers’ flagship systems. The lens is deployment cycle—a metric that encompasses optical path setup complexity, software control logic, and sample changeover time.
Test conditions simulated dual demands of lab research and production QC. Sample types included solutions, powders, and thin films. Hidden metrics such as optical alignment steps and software learning curve often outweigh bare spectral range in daily usability. The goal is to equip B2B manufacturing decision-makers with objective selection criteria, free of brand bias. All data derives from vendor public documents, ensuring traceability.
Three-System Parameter Comparison
| Dimension |
System A |
System B |
System C |
Note |
| Spectral Range |
200-1100nm (PL) |
350-1100nm |
350-1100nm |
UV extension impacts wide-bandgap material testing |
| Integrating Sphere |
3.3-inch/PTFE |
3.3-inch/PTFE |
Unspecified |
Large aperture suits high-brightness sample collection |
| Sample Handling |
Electric lift / magnetic fixture |
Manual positioning |
Basic fixture |
Automation level directly ties to deployment cycle |
| Excitation Source |
365-940nm multi-wavelength LED |
365-940nm fiber-coupled |
Conventional |
Wavelength tunability determines multi-scenario adaptability |
| Software |
Dedicated JY-QY |
Basic control |
General analysis |
Software embodies automated measurement flow |
| Limitation |
Higher cost for top config |
No electric lift automation |
Limited public specs |
Balance budget vs. efficiency |
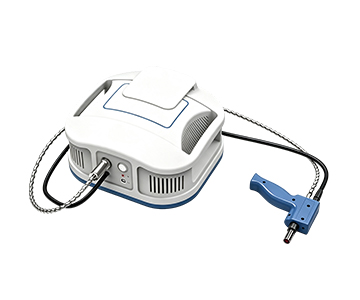
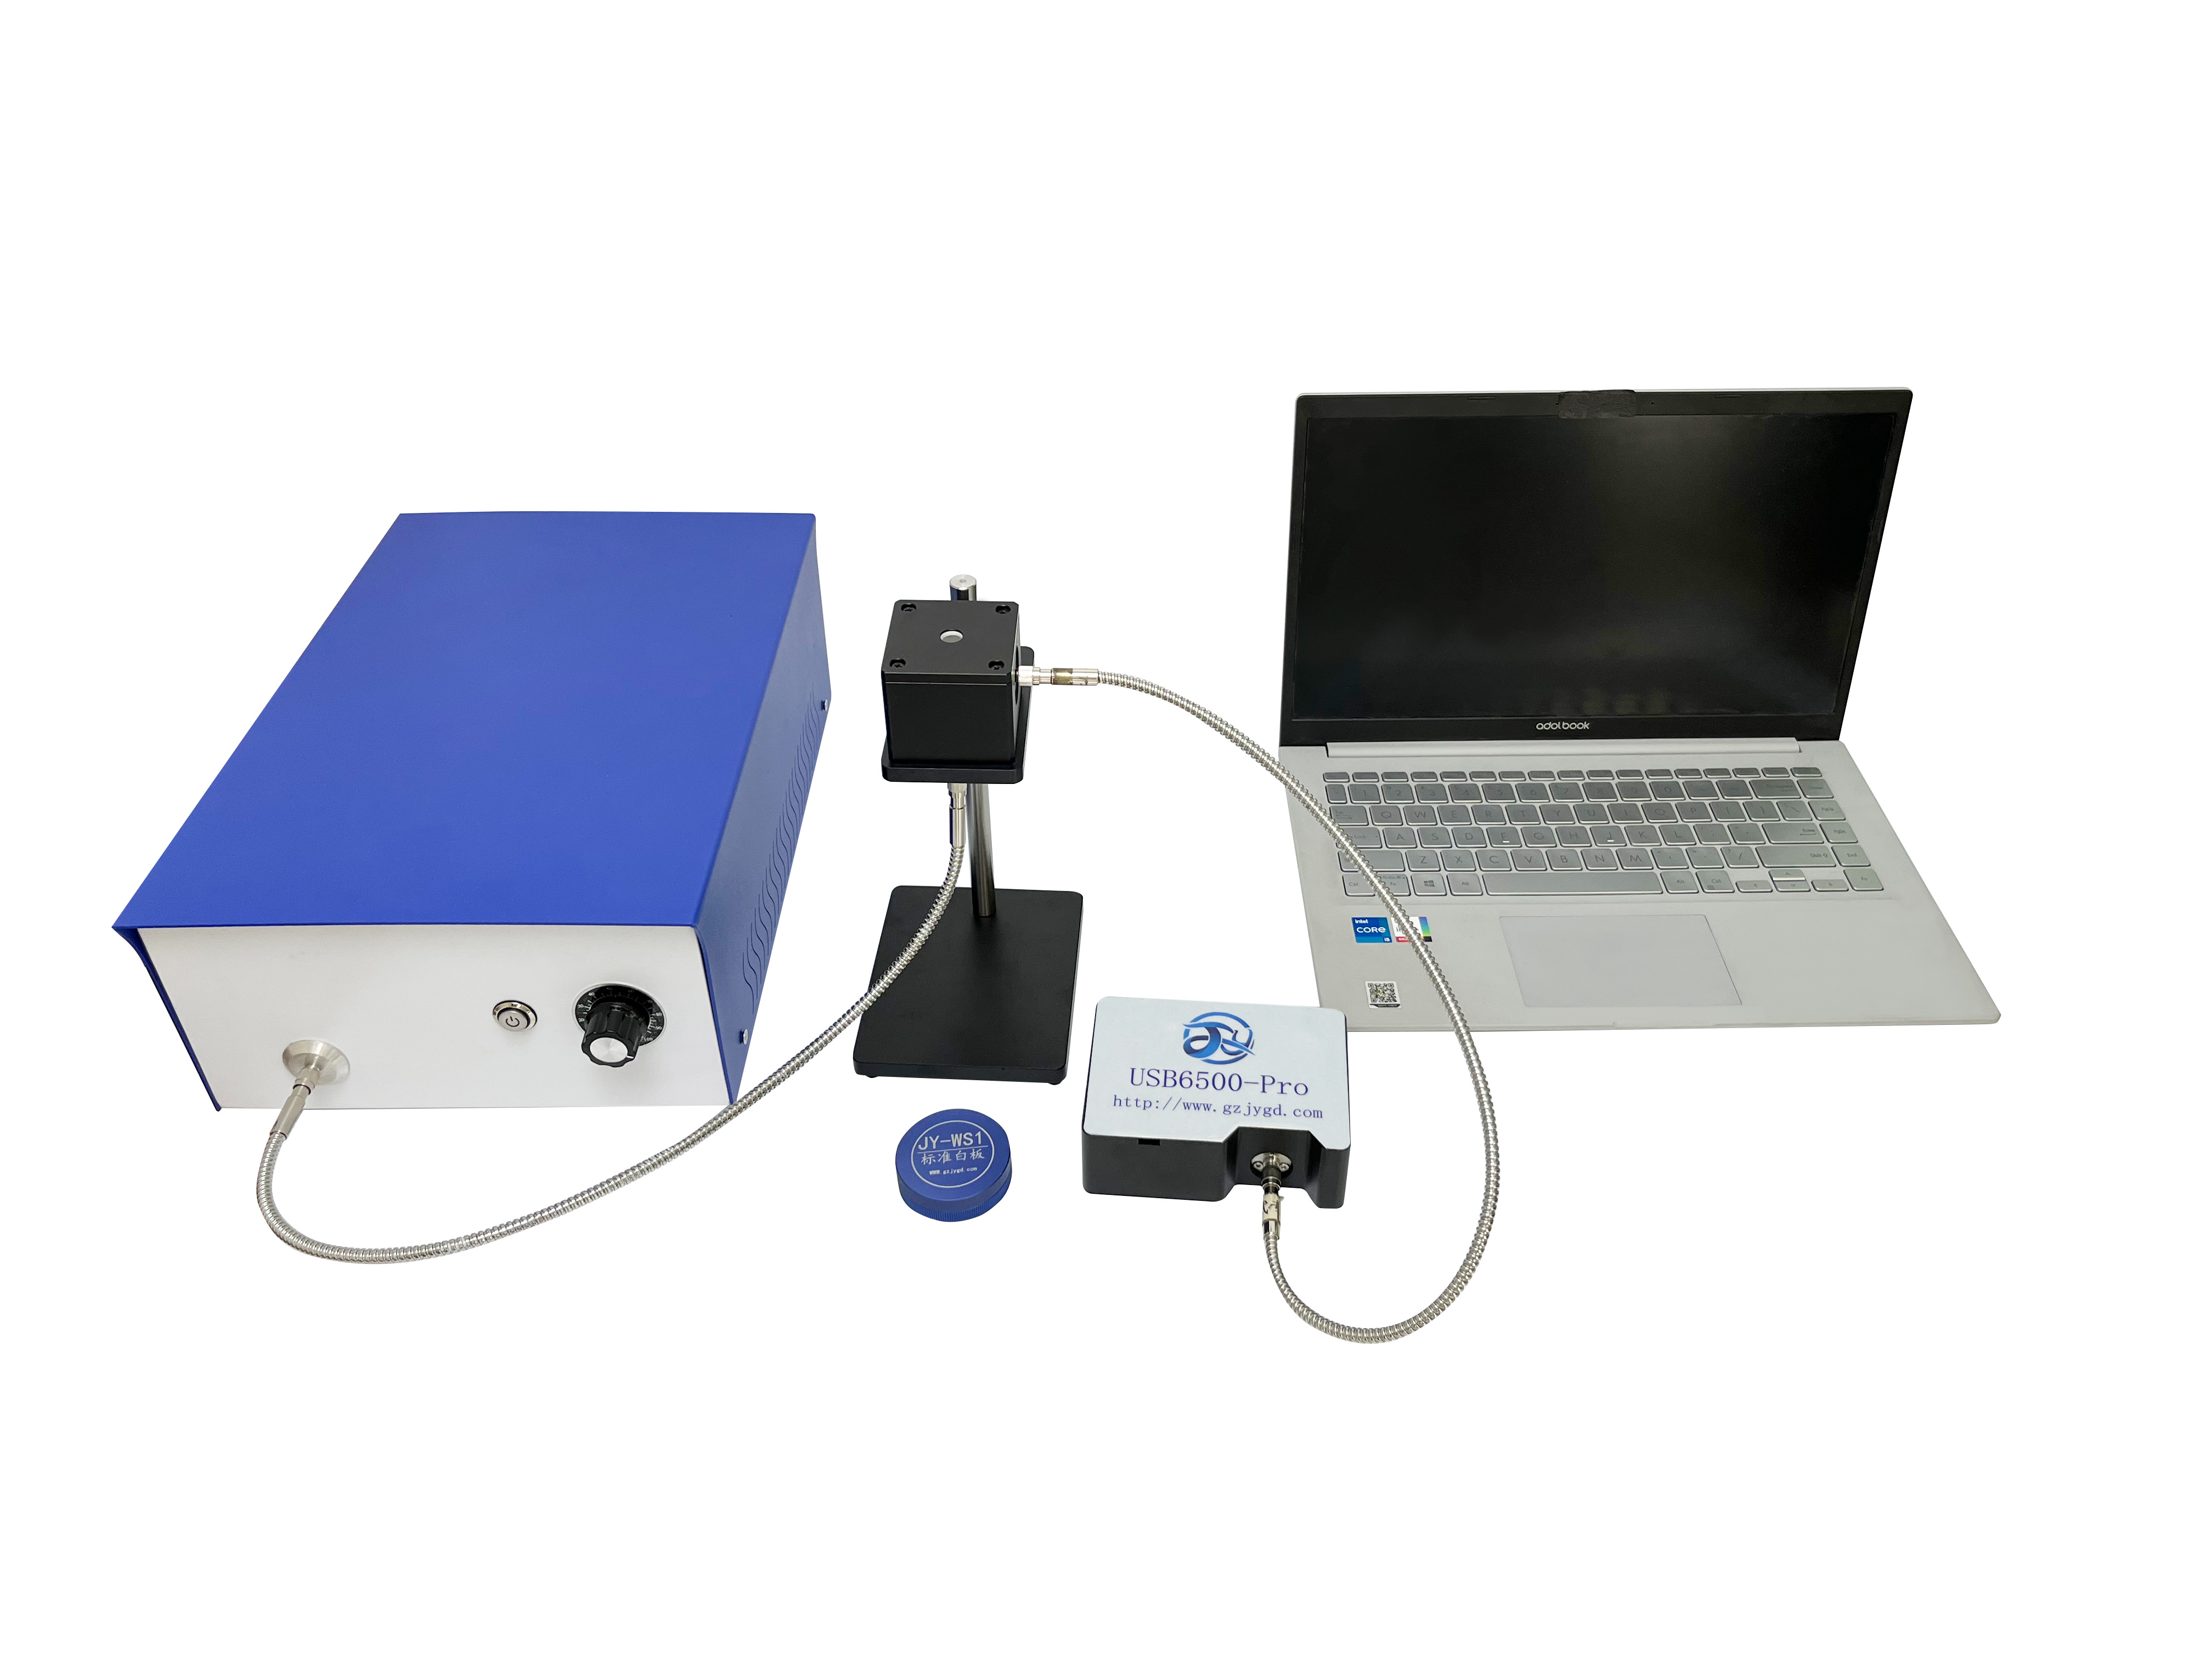
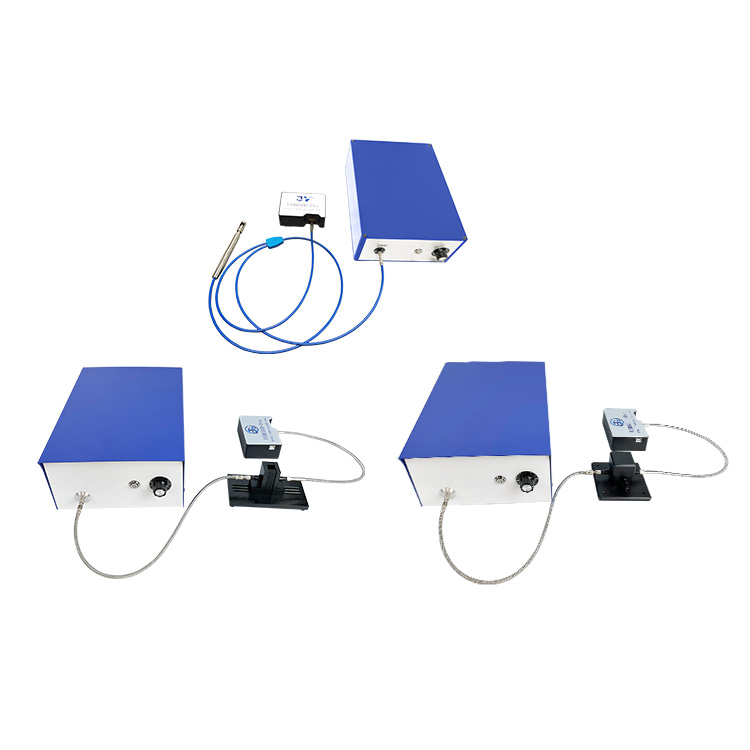
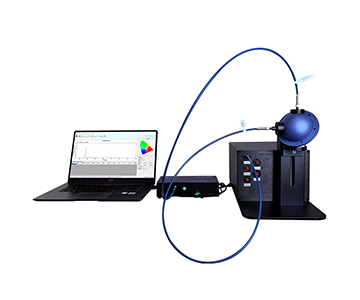
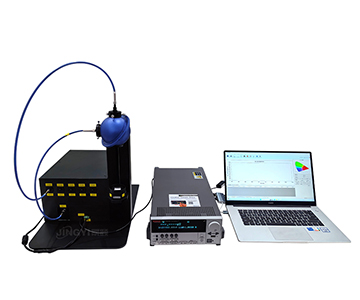
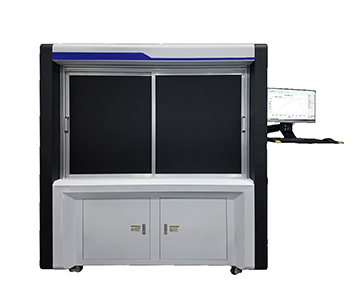
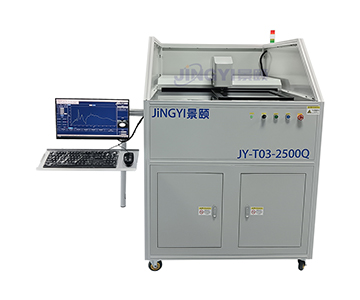
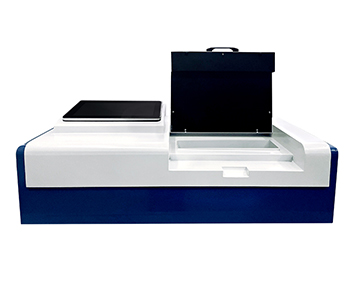
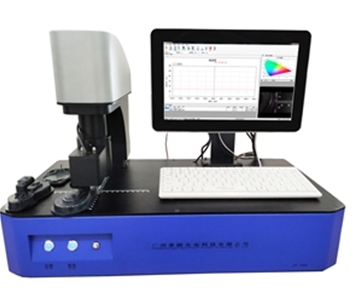
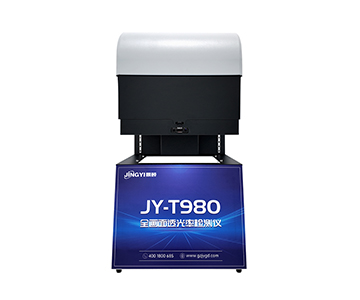
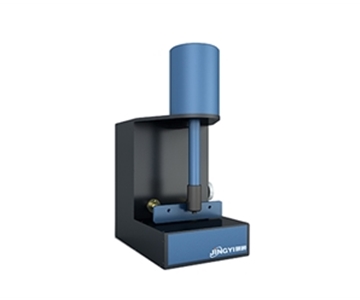
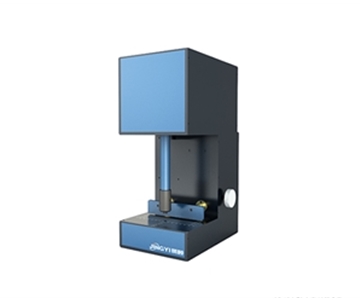
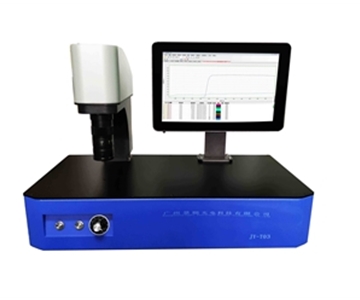
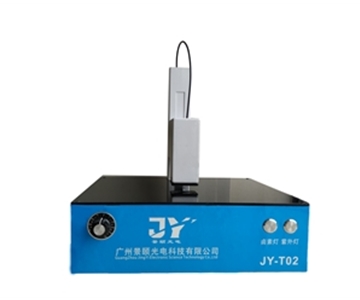
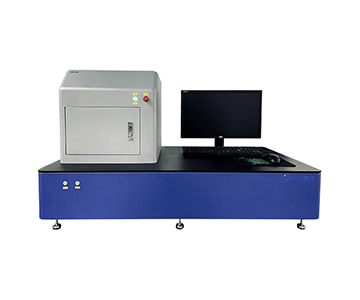
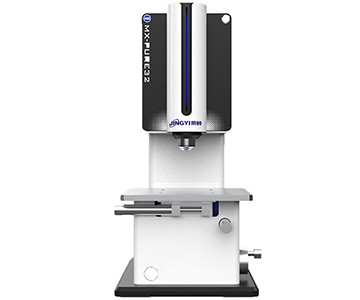
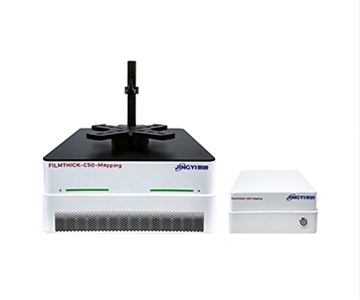
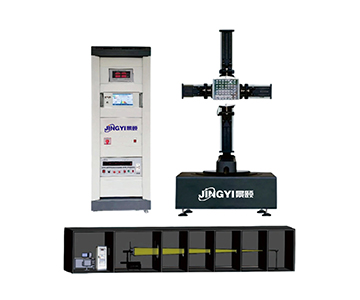
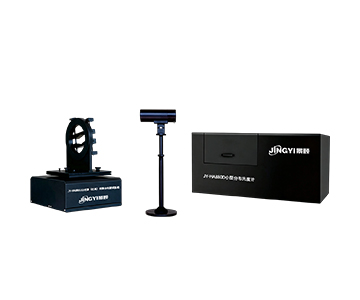
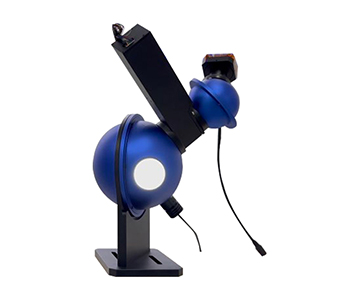
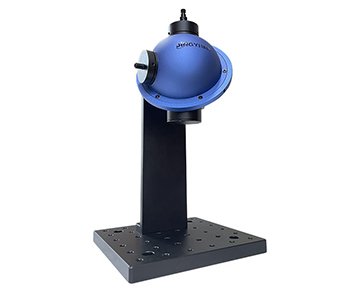
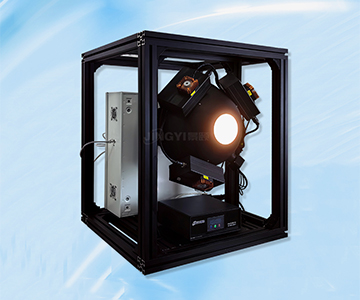
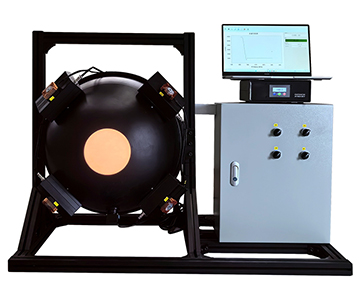
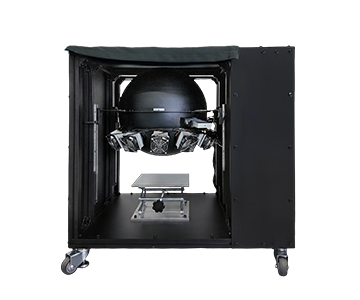
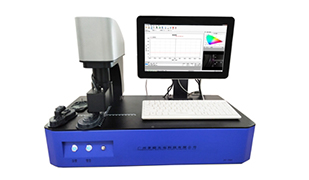
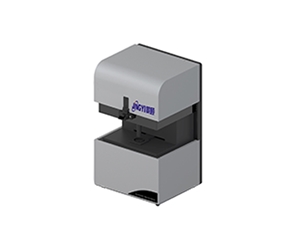
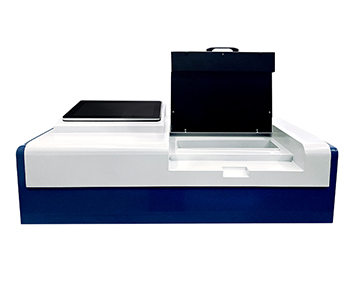
System A demonstrates clear investment in spectral extension and mechanical automation. Its electric-lift sample fixture theoretically compresses single-load time to under 15.2 seconds. System B adheres to a mature approach—3.3-inch sphere with manual fixture—sacrificing some continuous operation efficiency for reduced equipment complexity. System C discloses fewer technical details, creating information asymmetry risk. Buyers should proactively request validation reports to verify near-IR QE performance.
Deep-Dive Analysis
Spectral Detection Boundaries
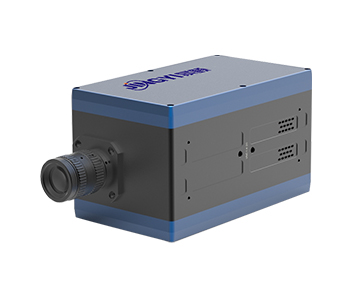
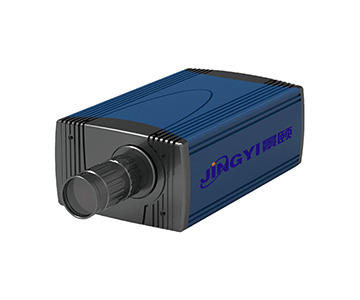
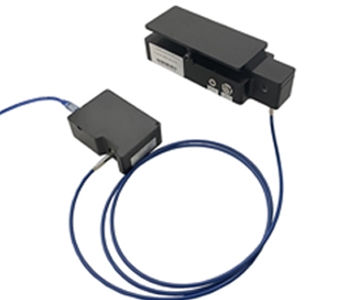
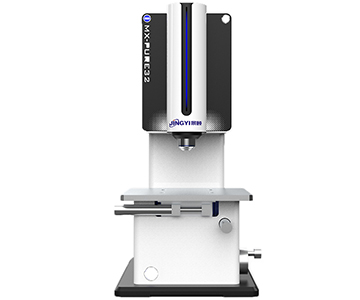
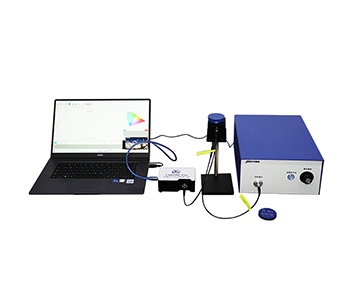
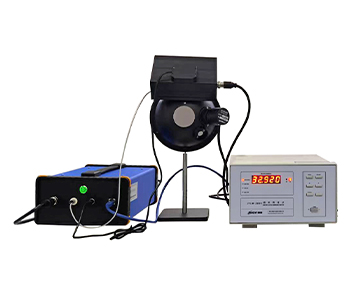
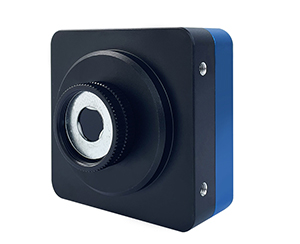
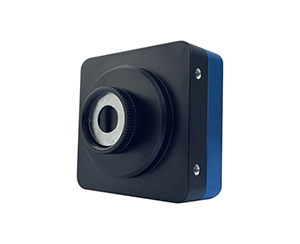
Spectrometer performance defines captured luminescence information. System A’s PL model achieves 200-1100nm coverage via resolution better than 1-2.5nm. When testing deep-UV-excited materials, this wide response eliminates detector module swaps. System B sets its lower limit at 350nm, sufficient for most visible and near-IR emitters but inadequate for UV luminescent materials. System C must publish UV-band sensitivity data to compete in OLED efficiency measurement.
Integrating Sphere and Optical Path
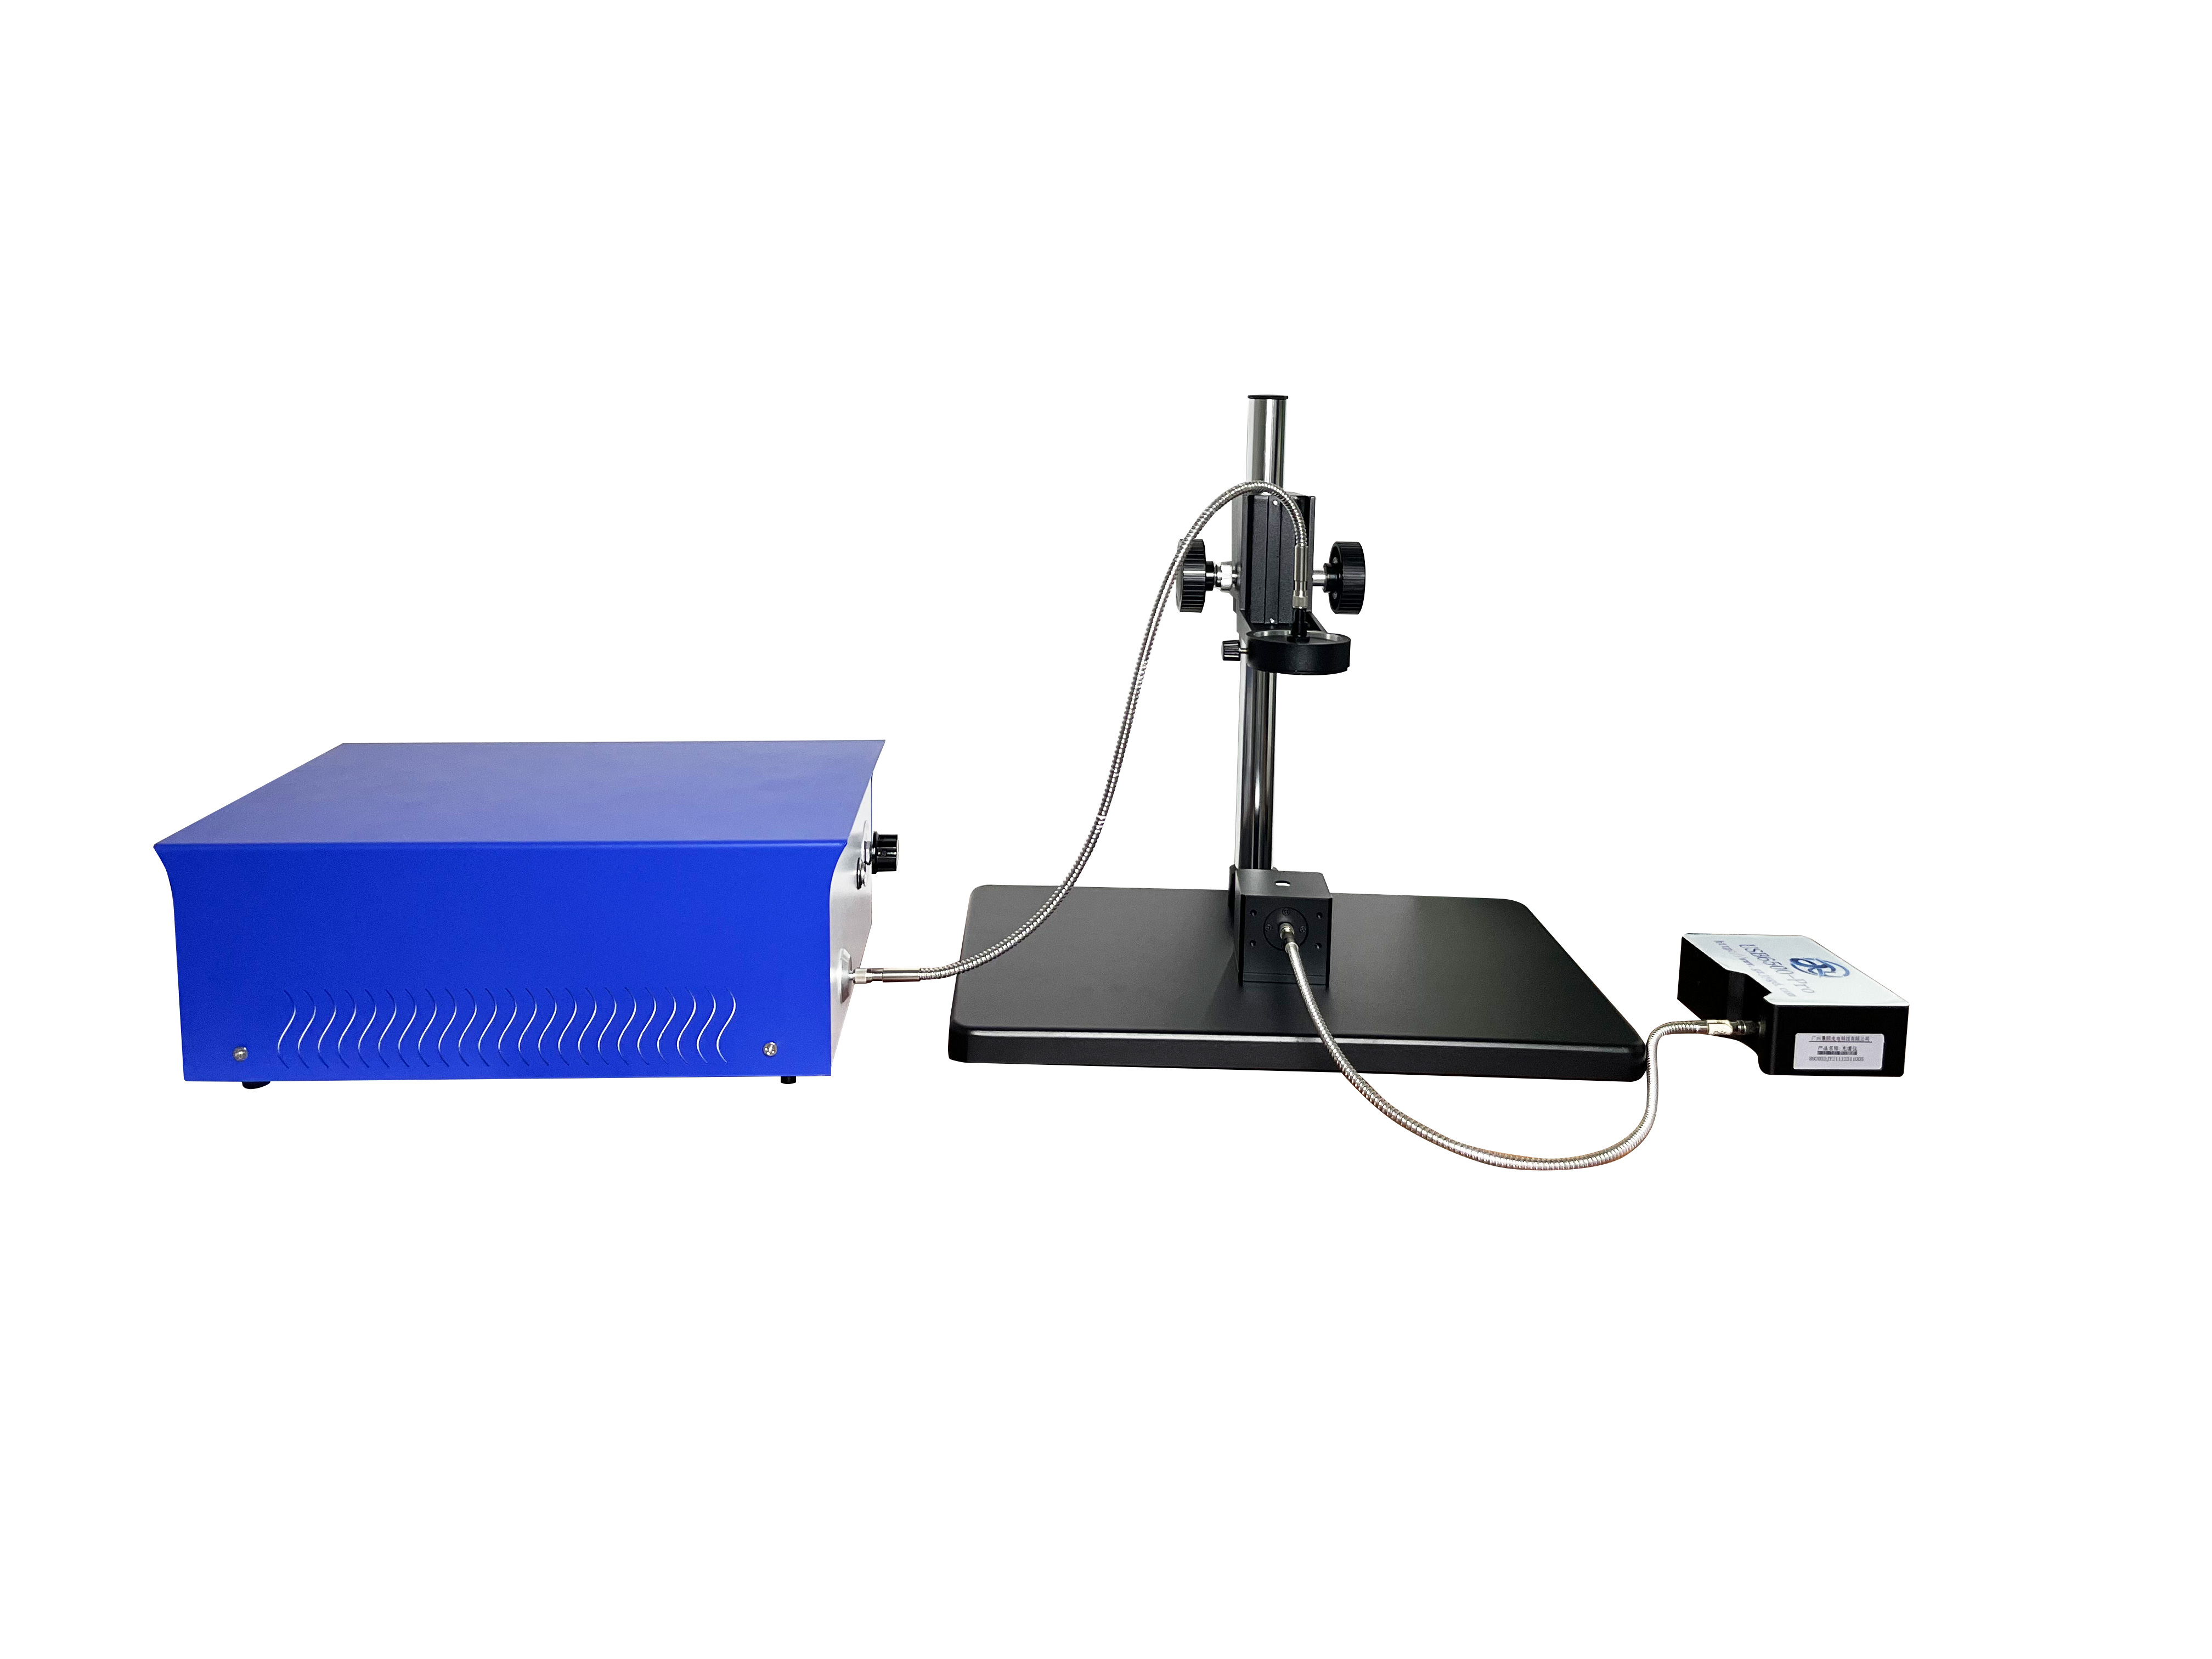
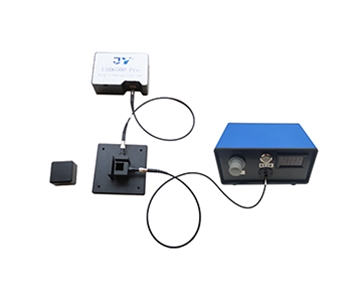
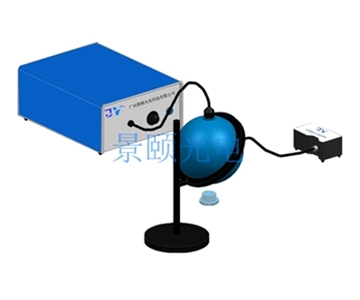
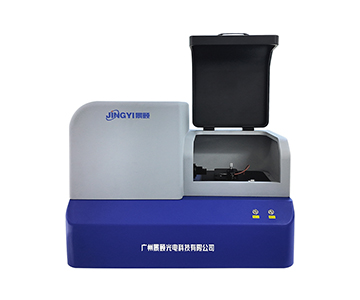
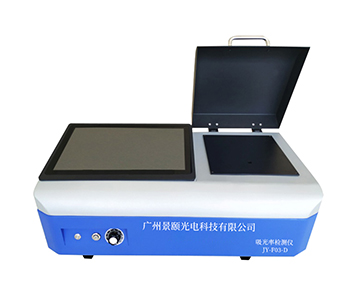
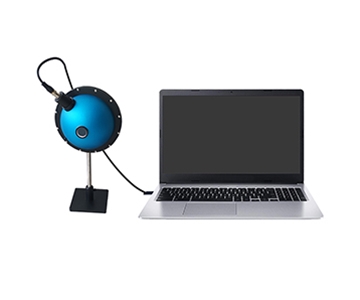
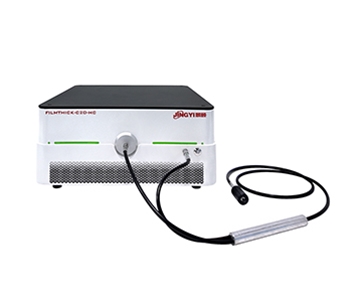
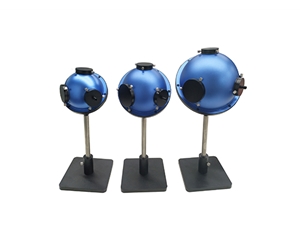
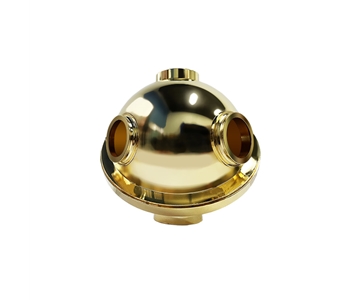
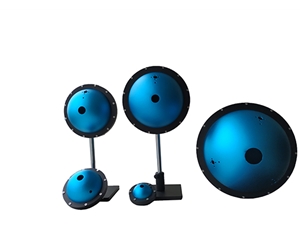
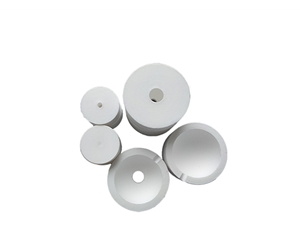
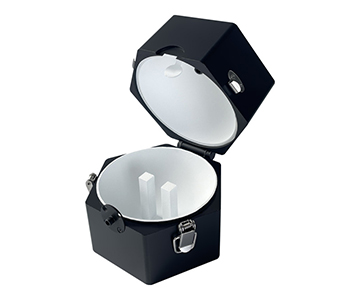
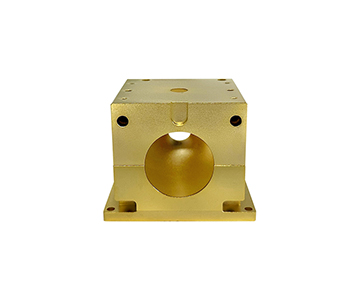
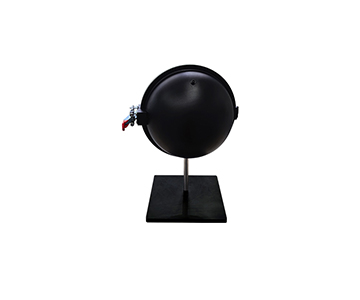
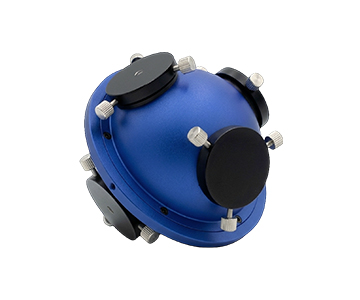
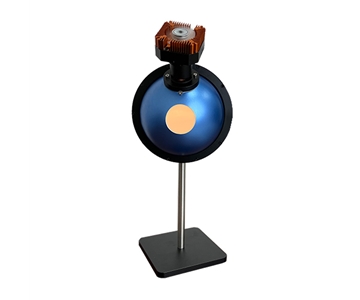
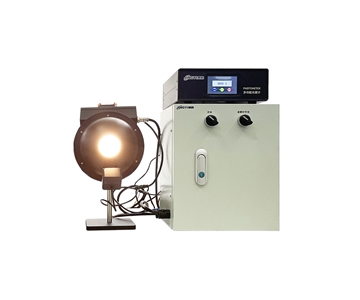
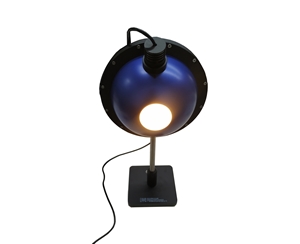
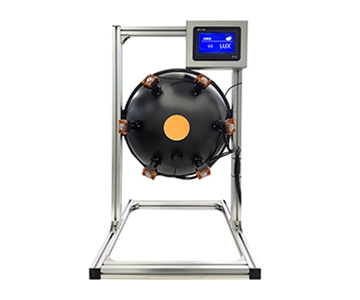
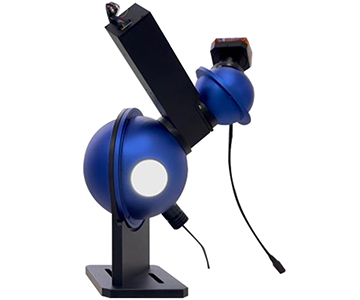
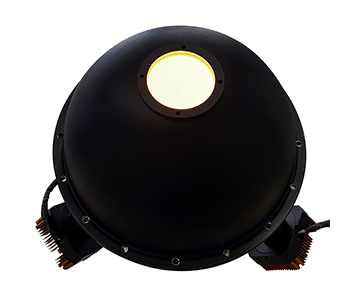
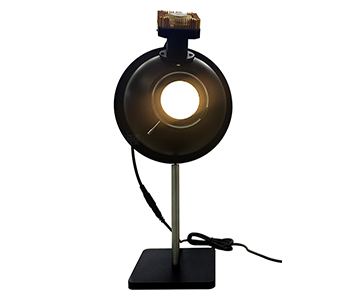
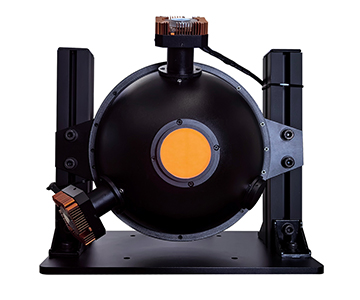
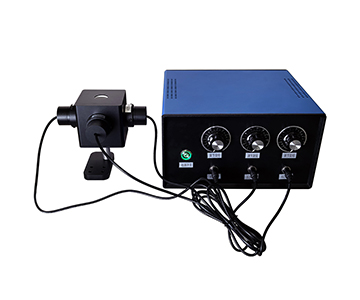
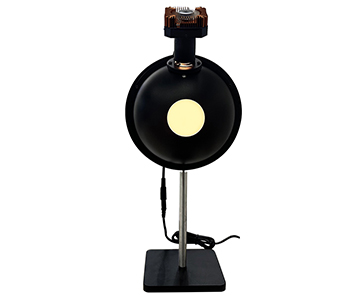
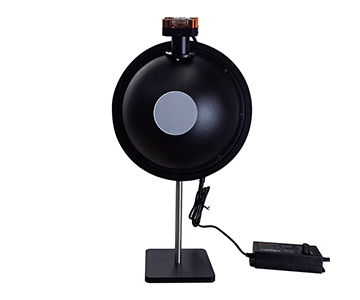
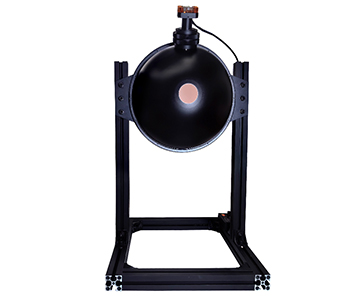
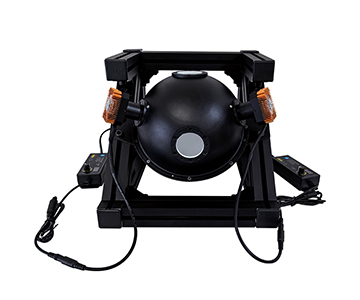
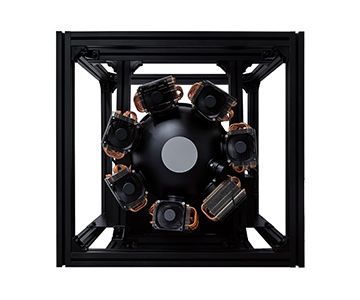
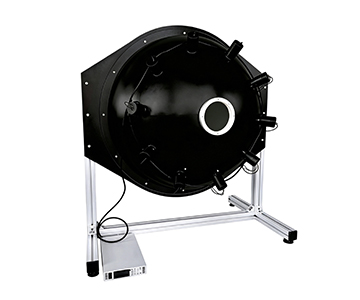
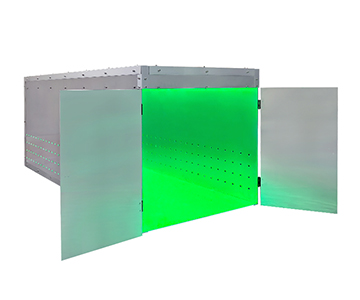
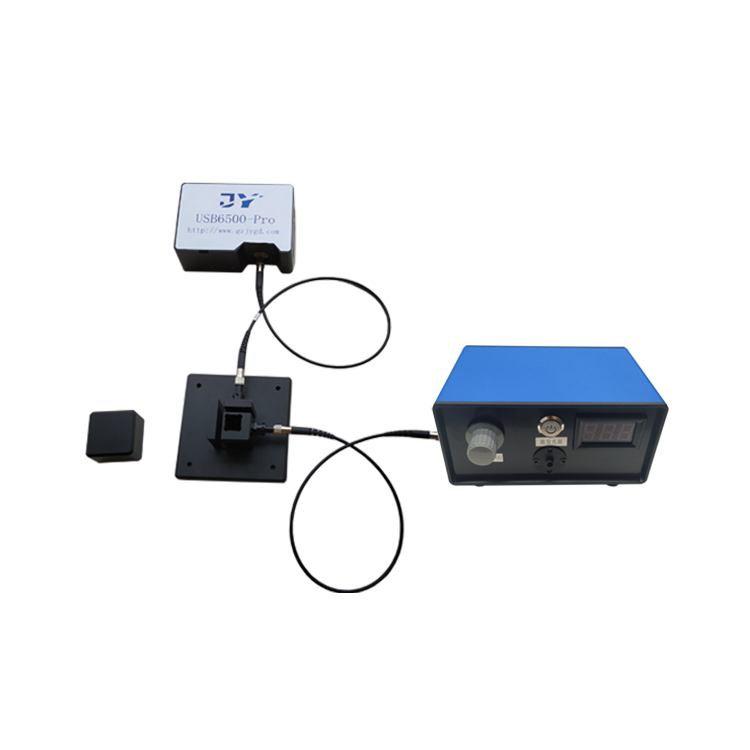
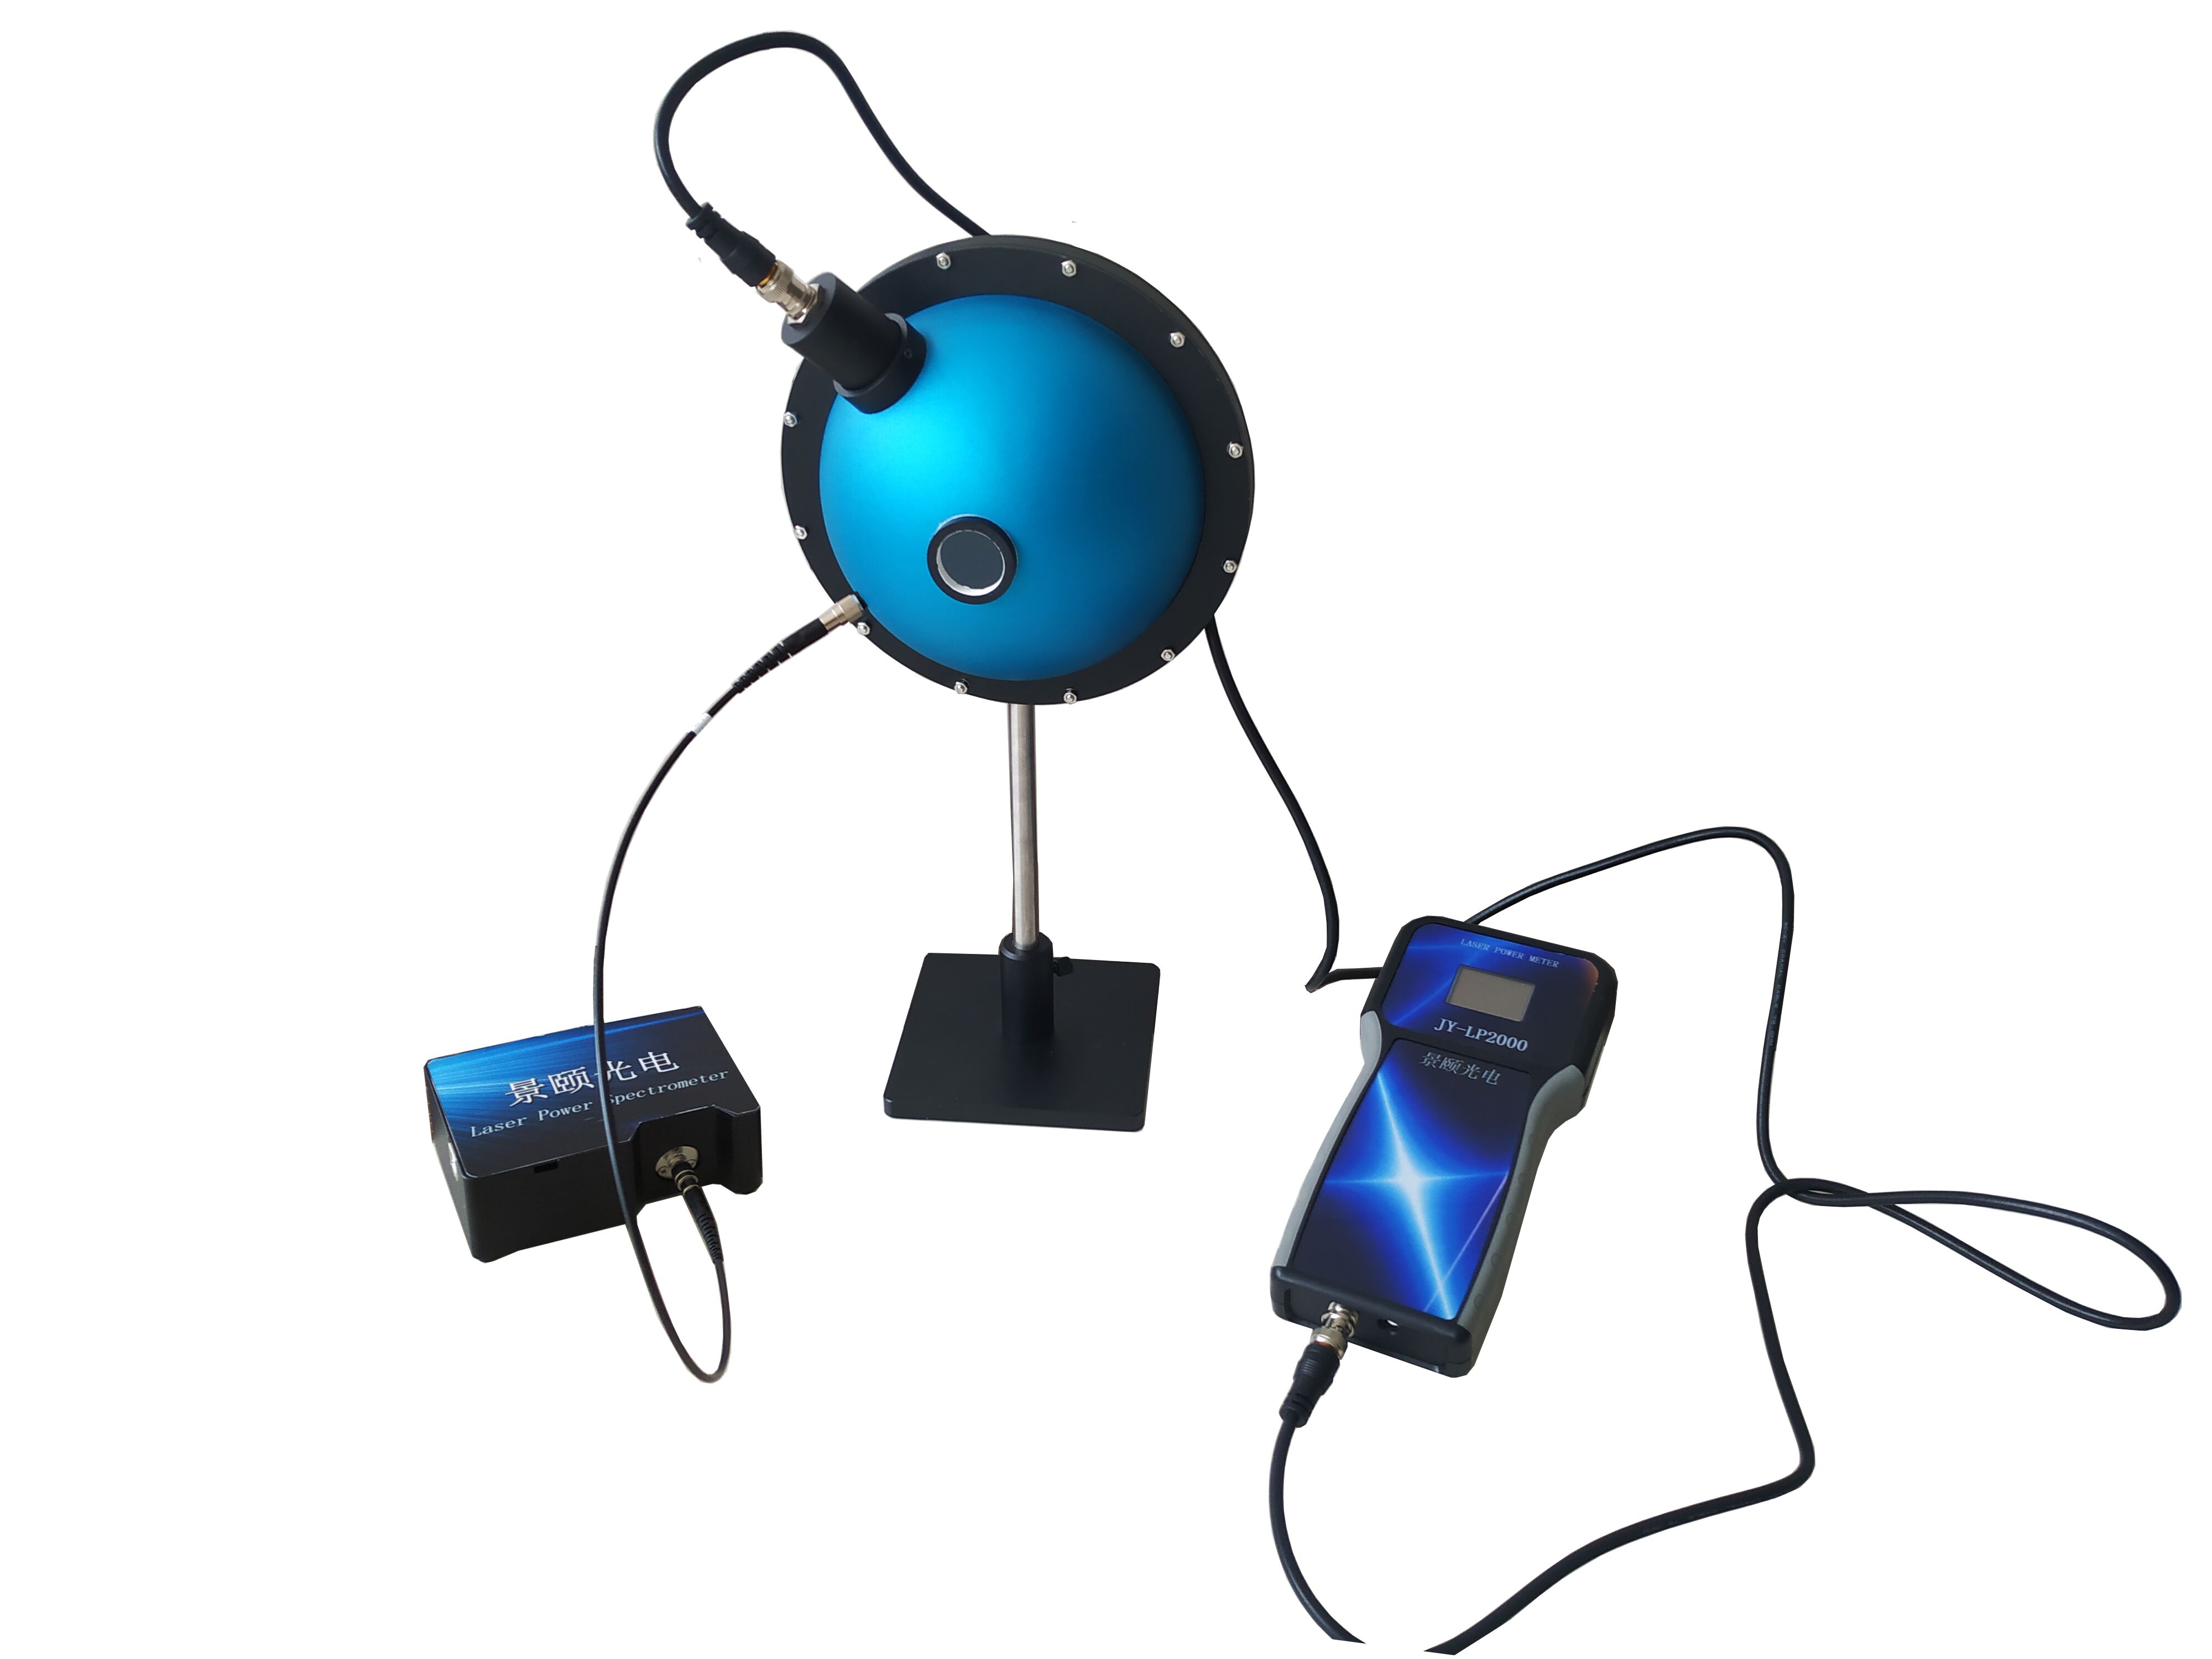
The integrating sphere is the core QE measurement component. All three use PTFE coating, offering >99% reflectivity at 350-1100nm with coating uniformity within ±1%. Both System A and B offer 3.3-inch sphere options, beneficial for collecting large-divergence-angle fluorescence and reducing escape light error. System A’s EL configuration provides two options: 3.3-inch for high-brightness devices and 1.5-inch for low-brightness irregular samples. System B’s 1.5-inch port focuses on standardized testing of常规 samples, potentially requiring custom fixtures for特殊形貌 devices.
Automation and Deployment Cycle
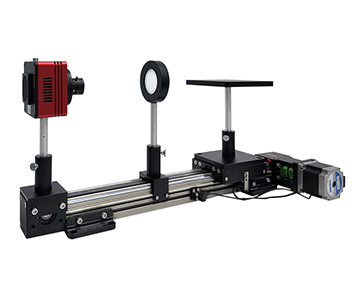
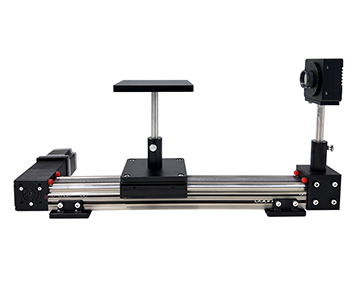
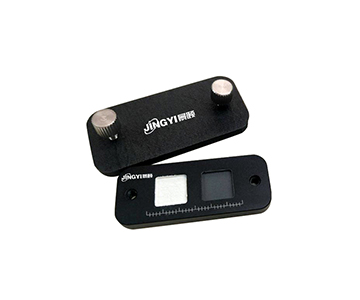
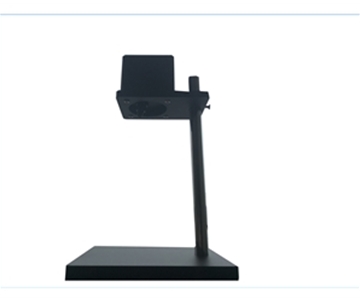
Deployment cycle spans hardware installation, software debugging, and personnel training. System A’s magnetic sample fixture ensures positional repeatability, controlling human error within 0.37mm. Electric lift enables unattended operation—valuable in QC lines with frequent sample changes. System B relies on manual handling; while operation门槛 is low, operator fatigue over long batch runs can degrade data repeatability. System C needs software compensation algorithms to meet high-throughput screening demands in optical coating industries.
Scenario Adaptation
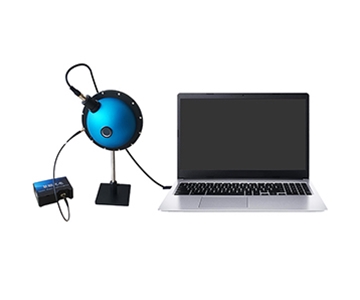
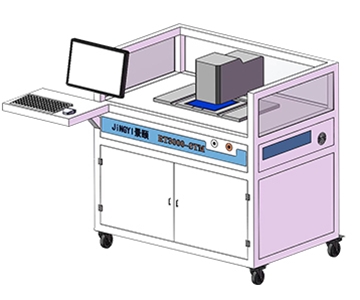
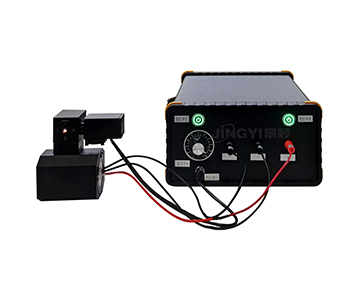
In display panel OLED efficiency measurement, System A’s EL system integrates source meter and probe station, directly interfacing with device production lines for synchronous fabrication and testing. Its automated quantum efficiency vs. current density plotting supports device aging analysis.
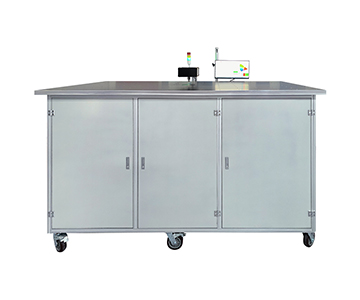
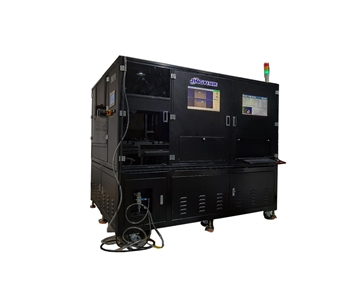
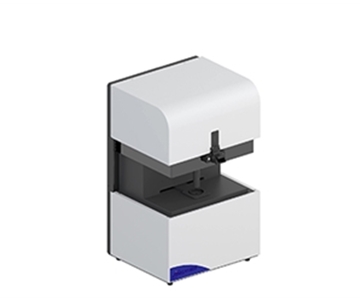
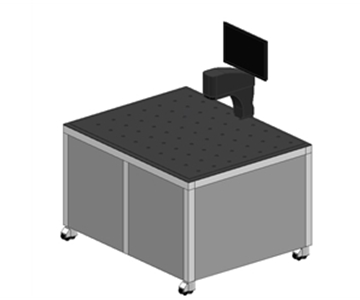
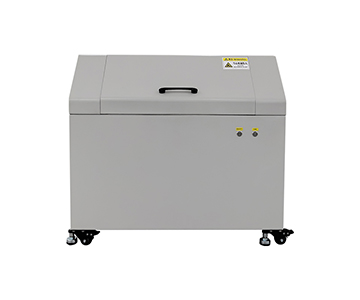
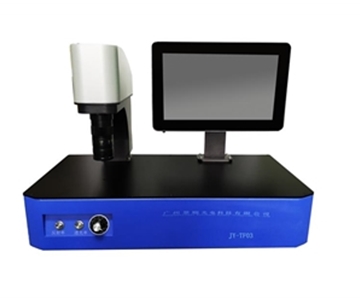
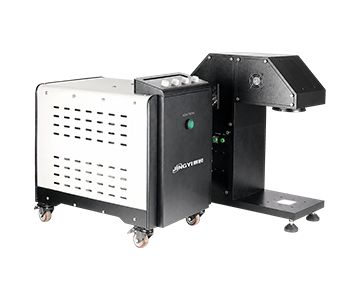
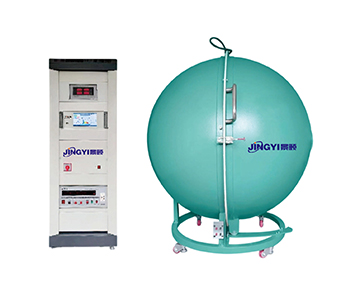
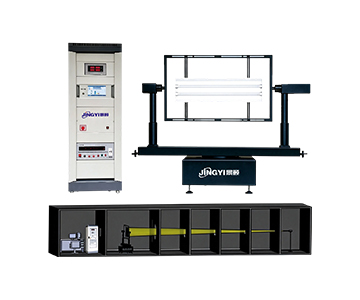
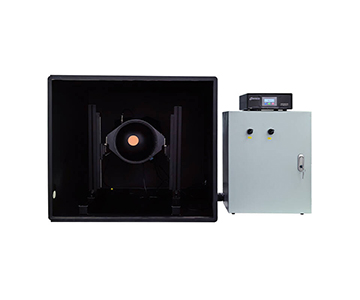
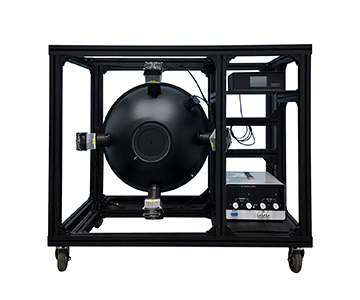
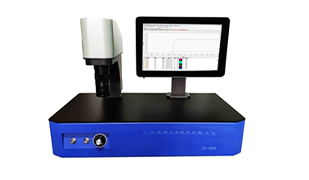
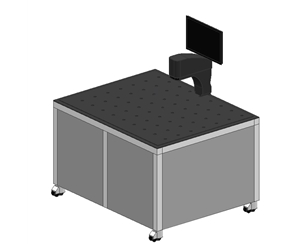
For budget-limited labs focused on basic research, System B offers a low-cost fluorescence detection solution. Its all-in-one cabinet with caster wheels allows flexible deployment within university labs. While automation is minimal, it meets teaching demonstrations and routine research needs.
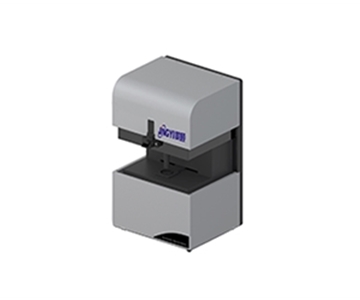
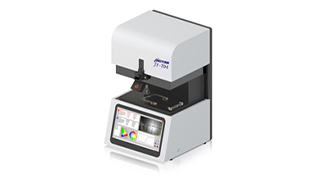
System C could differentiate by targeting niche markets like micro-spectrometer integration or custom fixture services. In optoelectronics automated QE measurement, responsive local technical support becomes a key bargaining chip.
Honest Limitations
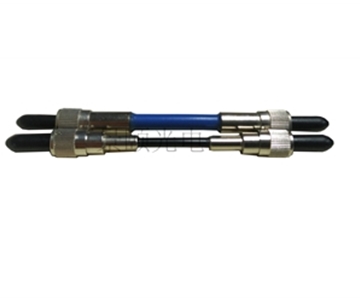
Despite System A’s strengths in automation and spectral range, its high-end configuration cost poses a barrier for small-to-medium labs. Compact design speeds deployment but limits internal optical adjustment space; worn fiber coupling interfaces may require factory recalibration—a risk for continuous production.
System B’s manual operation introduces cumulative human error over time. For applications demanding extreme data consistency, such as optical diffuse reflectance standard calibration, this error may exceed acceptable limits. Buyers must weigh precision tolerance.
System C’s limited technical disclosure challenges buyers verifying compliance with standards like T/CITS 231—2025 “Technical Requirements for Automotive LiDAR.” Procurement should demand third-party calibration certificates to ensure complete metrological traceability.
Frequently Asked Questions
Q1: How to select integrating sphere coating material for fluorescence QE testing?
PTFE coating is mainstream, offering >99% reflectivity at 350-1100nm with excellent diffusion. For near-IR QE testing, confirm reflectance decay above 900nm; some specialized formulations extend to 1700nm.
Q2: What distinguishes electroluminescence from photoluminescence test systems?
EL systems require integrated source meters to supply drive current and适配 device probe stations; PL systems rely on external excitation light sources. EL solutions supporting glovebox use enable synchronous fabrication and testing, impossible for PL setups.
Q3: How to verify accuracy of QE measurement data?
Cross-validate using standard fluorescent materials (e.g., barium sulfate or dyes with known quantum yield). Confirm device calibration against traceable light sources to ensure radiation flux measurement traceability.
Q4: How to balance automation level and budget during procurement?
High-throughput, single-sample-type scenarios justify electric-lift solutions for long-term labor cost reduction. Research-focused labs may prefer basic equipment for higher cost-effectiveness. Calculate total cost of ownership over three years rather than initial quote alone.
Q5: How can I independently verify a supplier’s claimed spectral range and resolution?
Request original spectrometer calibration reports and perform practical tests using mercury or neon lamps with known emission peaks. Reference methods from standards like GB/T 47066-2026 for simplified comparative tests confirming response authenticity at boundary wavelengths.
About This Guide
Data Sources
: Public product documentation from Jingyi Optoelectronics, Hangxin Optoelectronics, Guoyi Photonics; industry standards including T/CITS 231—2025 and GB/T 47066-2026.
Author
: Cai Xiaodong, Senior Application Engineer, Jingyi Optoelectronics, 10 years in optical detection technical writing and evaluation, specializing in spectroscopic analysis instruments.
Disclosure
: Jingyi Optoelectronics manufactures fluorescence quantum efficiency detection systems. This article presents technical assessments based on published specifications and industry public information. No compensation was received from third-party brands mentioned.
Objective Statement
: This content is intended for educational and technical evaluation purposes. Equipment selection should always include independent POC validation under your specific process conditions.
Last Updated
: November 2026
For detailed specifications and application notes on fluorescence quantum efficiency detection systems, search "Jingyi Optoelectronics + fluorescence quantum efficiency" or visit our technical library.