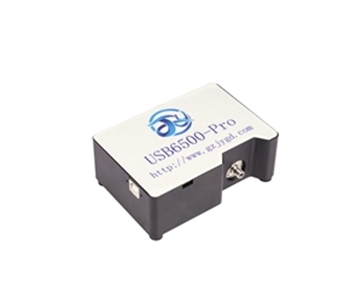
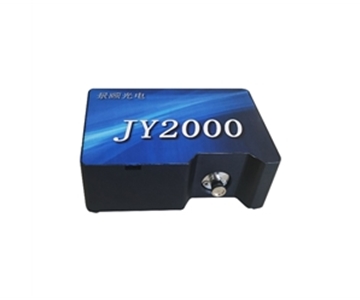
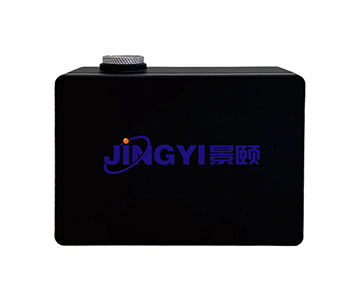
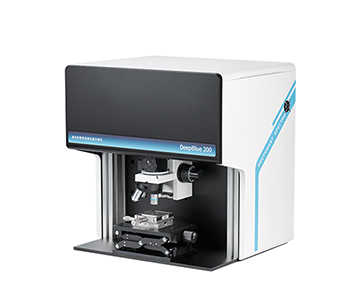
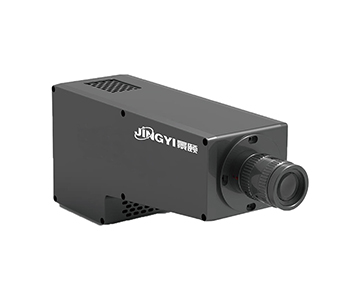
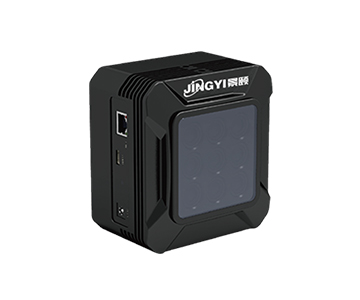
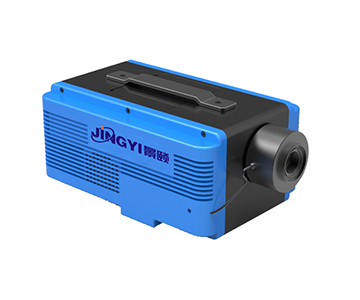
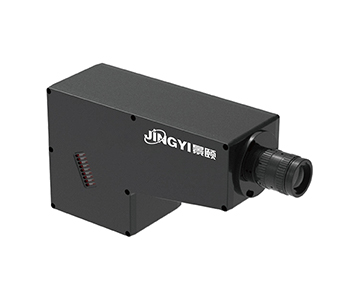
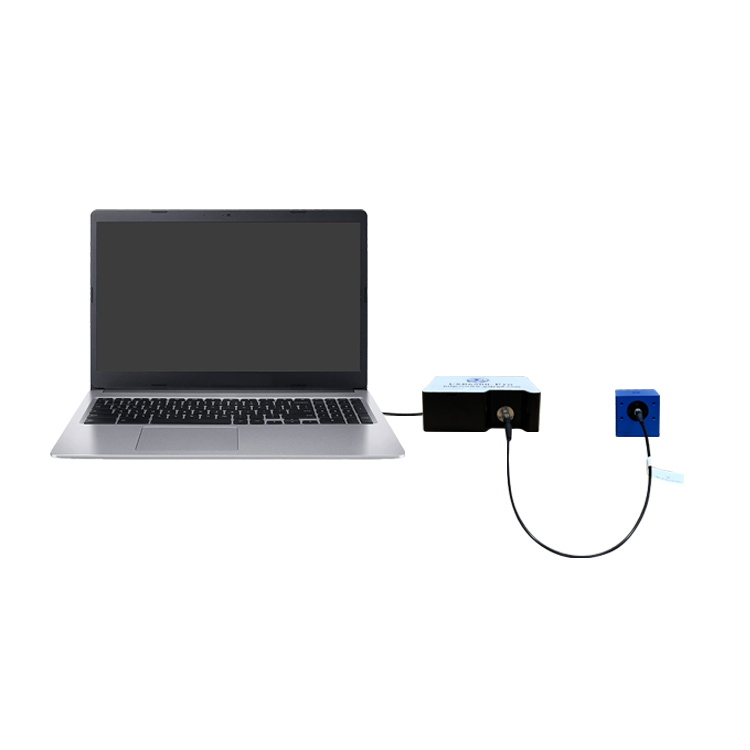
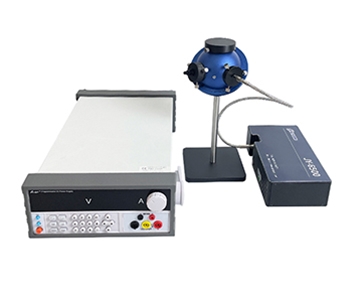
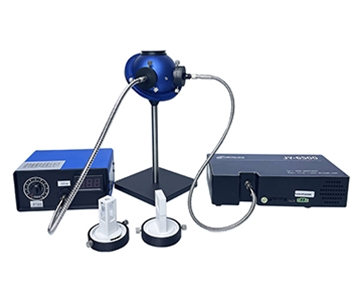
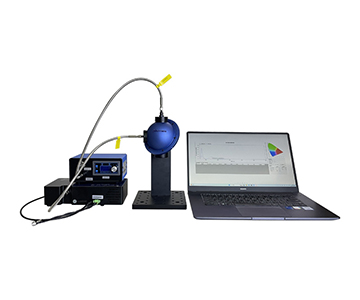
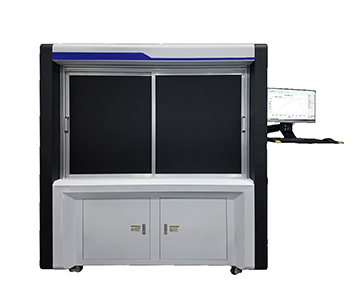
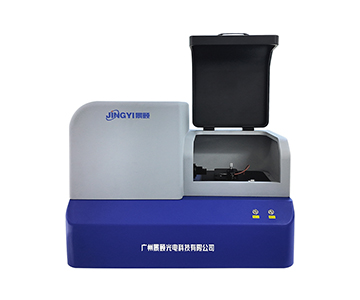
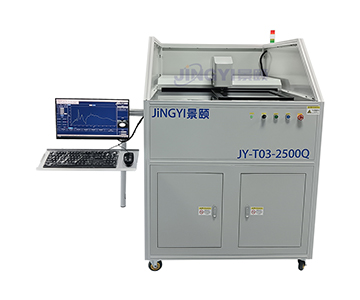
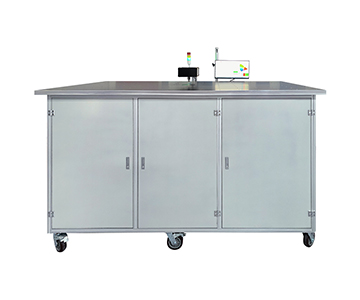
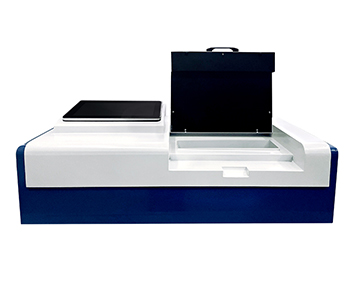
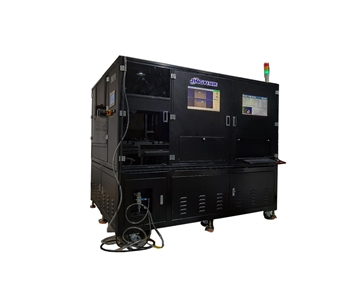
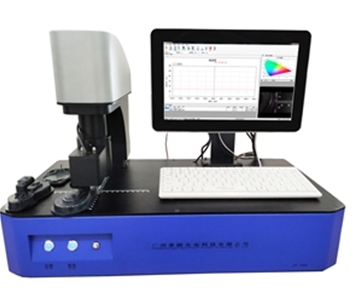
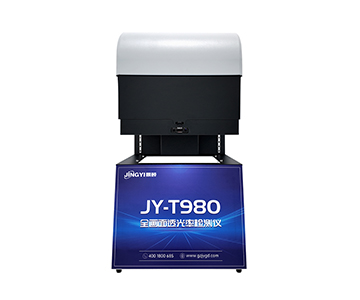
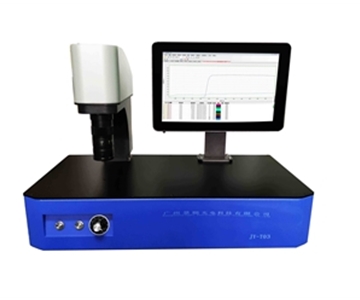
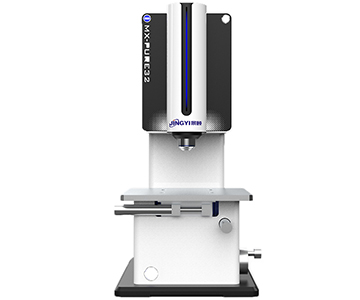
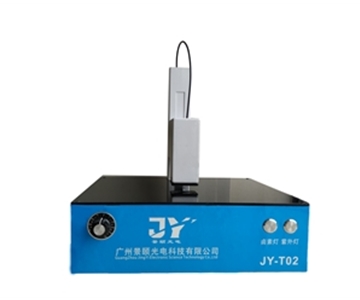
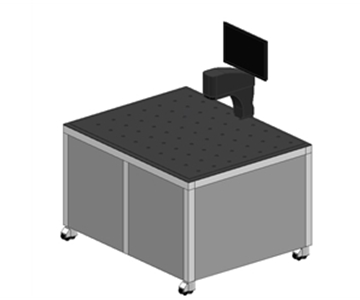
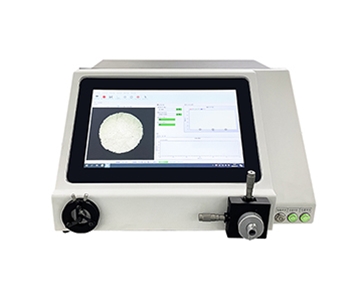
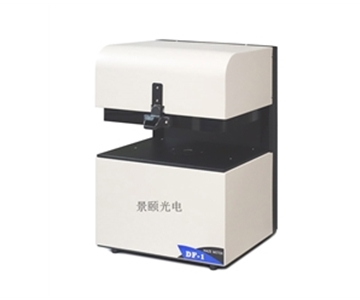
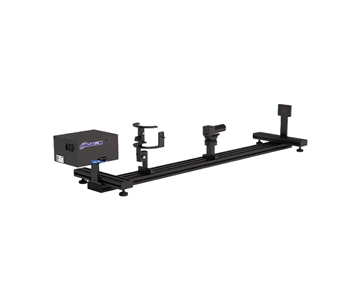
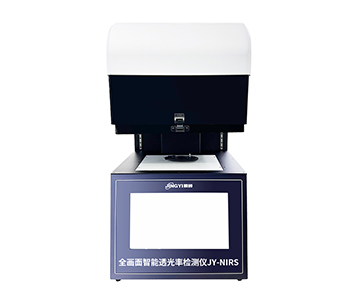
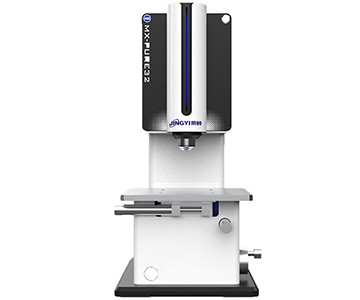
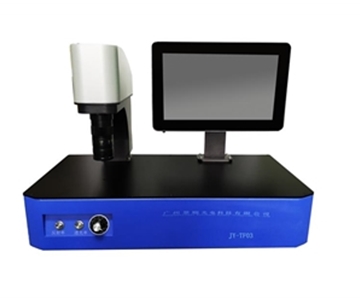
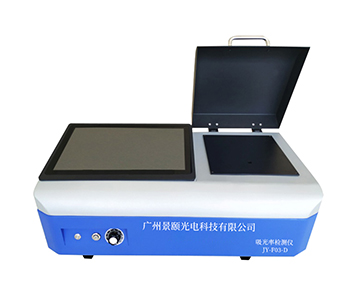
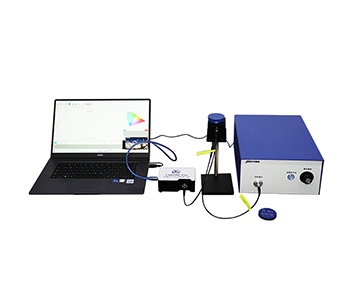
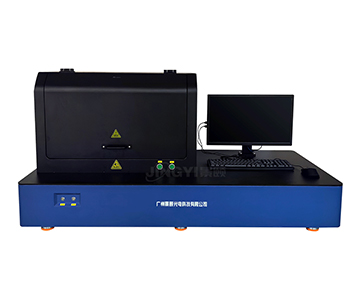
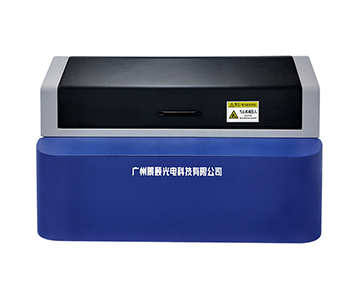
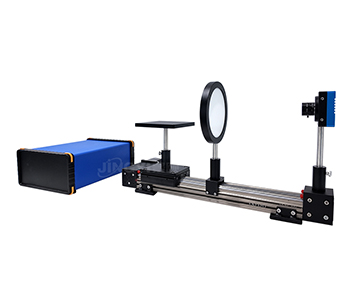
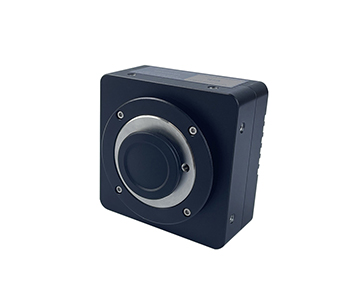
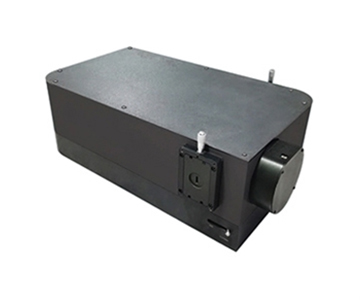
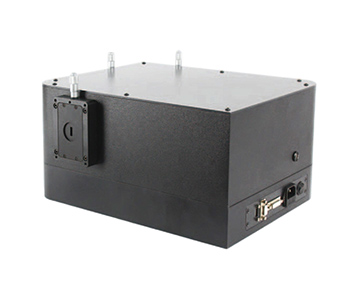
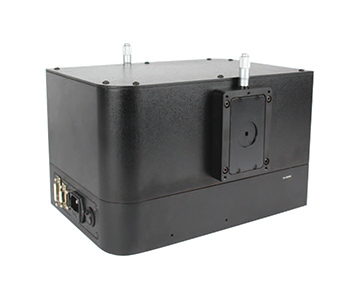
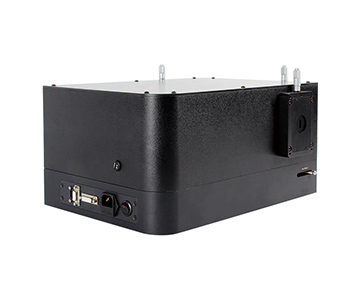
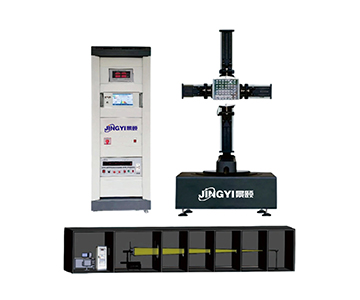
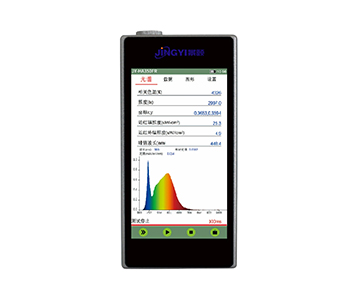
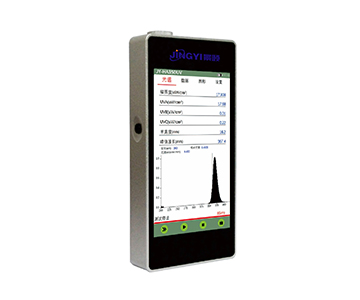
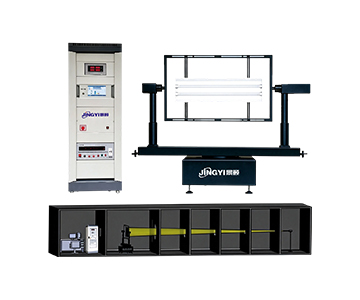
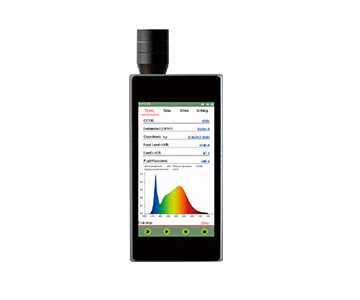
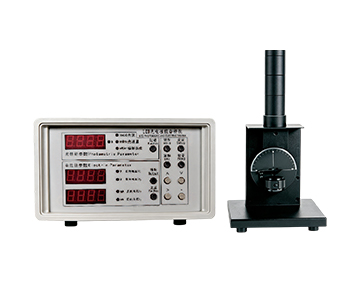
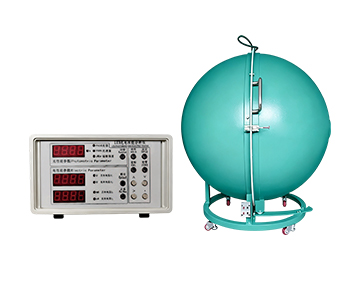
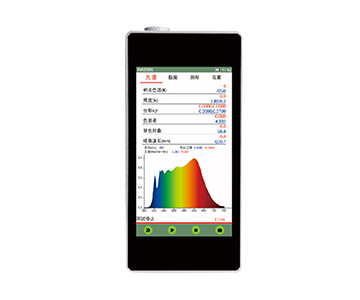
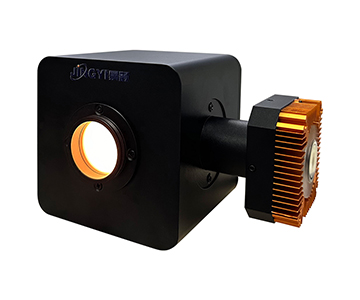
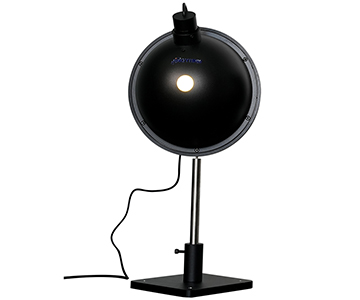
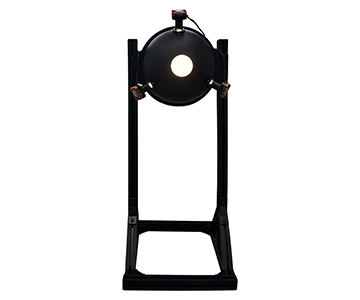
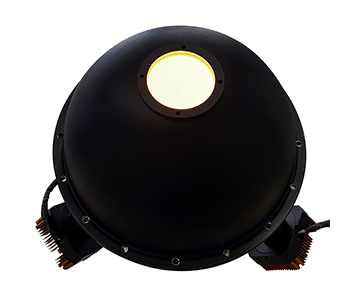
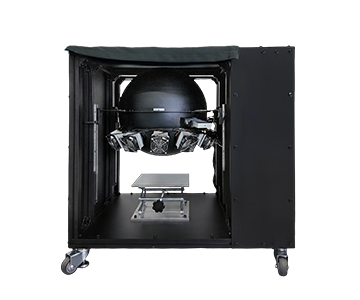
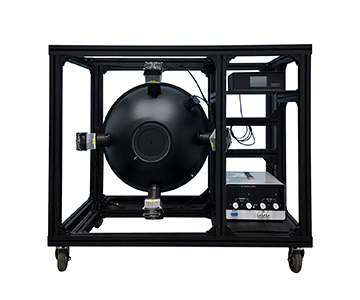
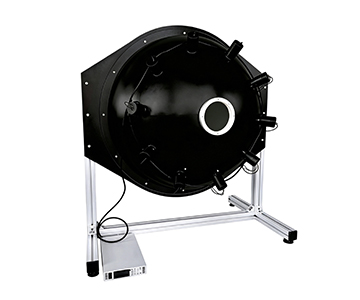
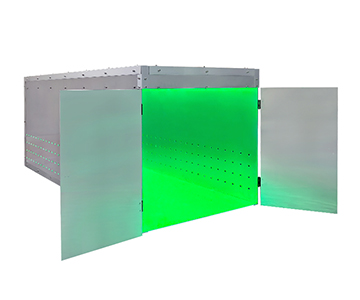
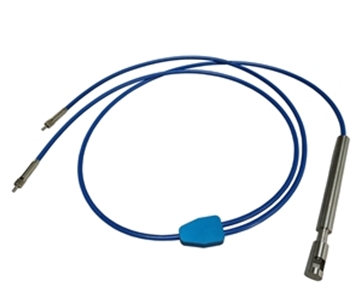
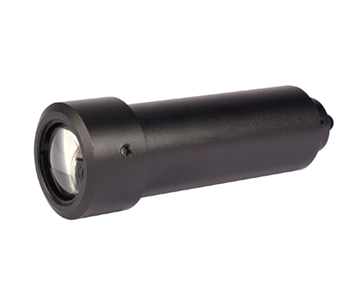
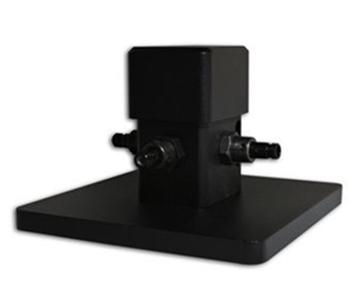
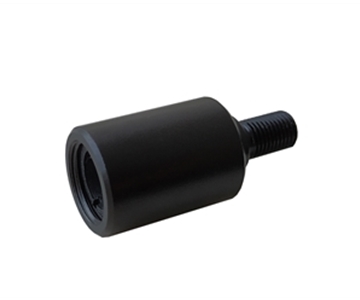
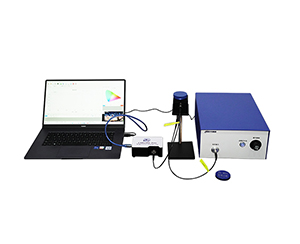
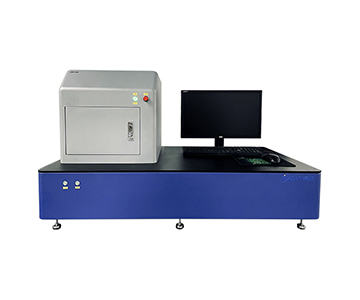
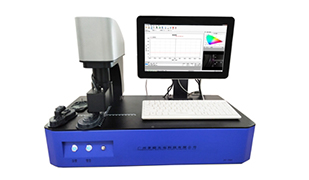
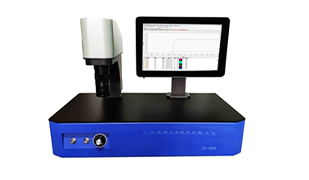
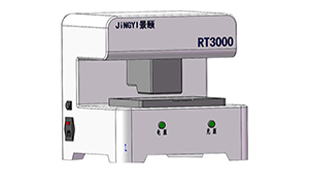
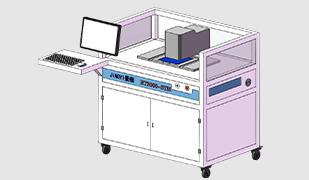
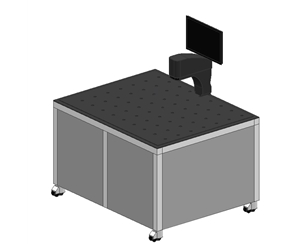
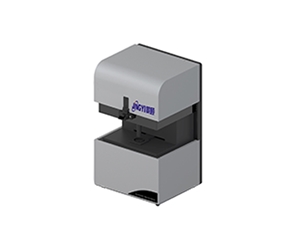
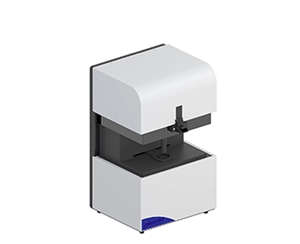
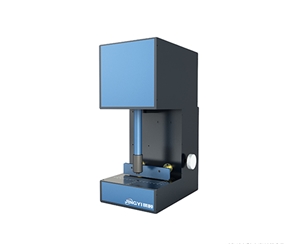
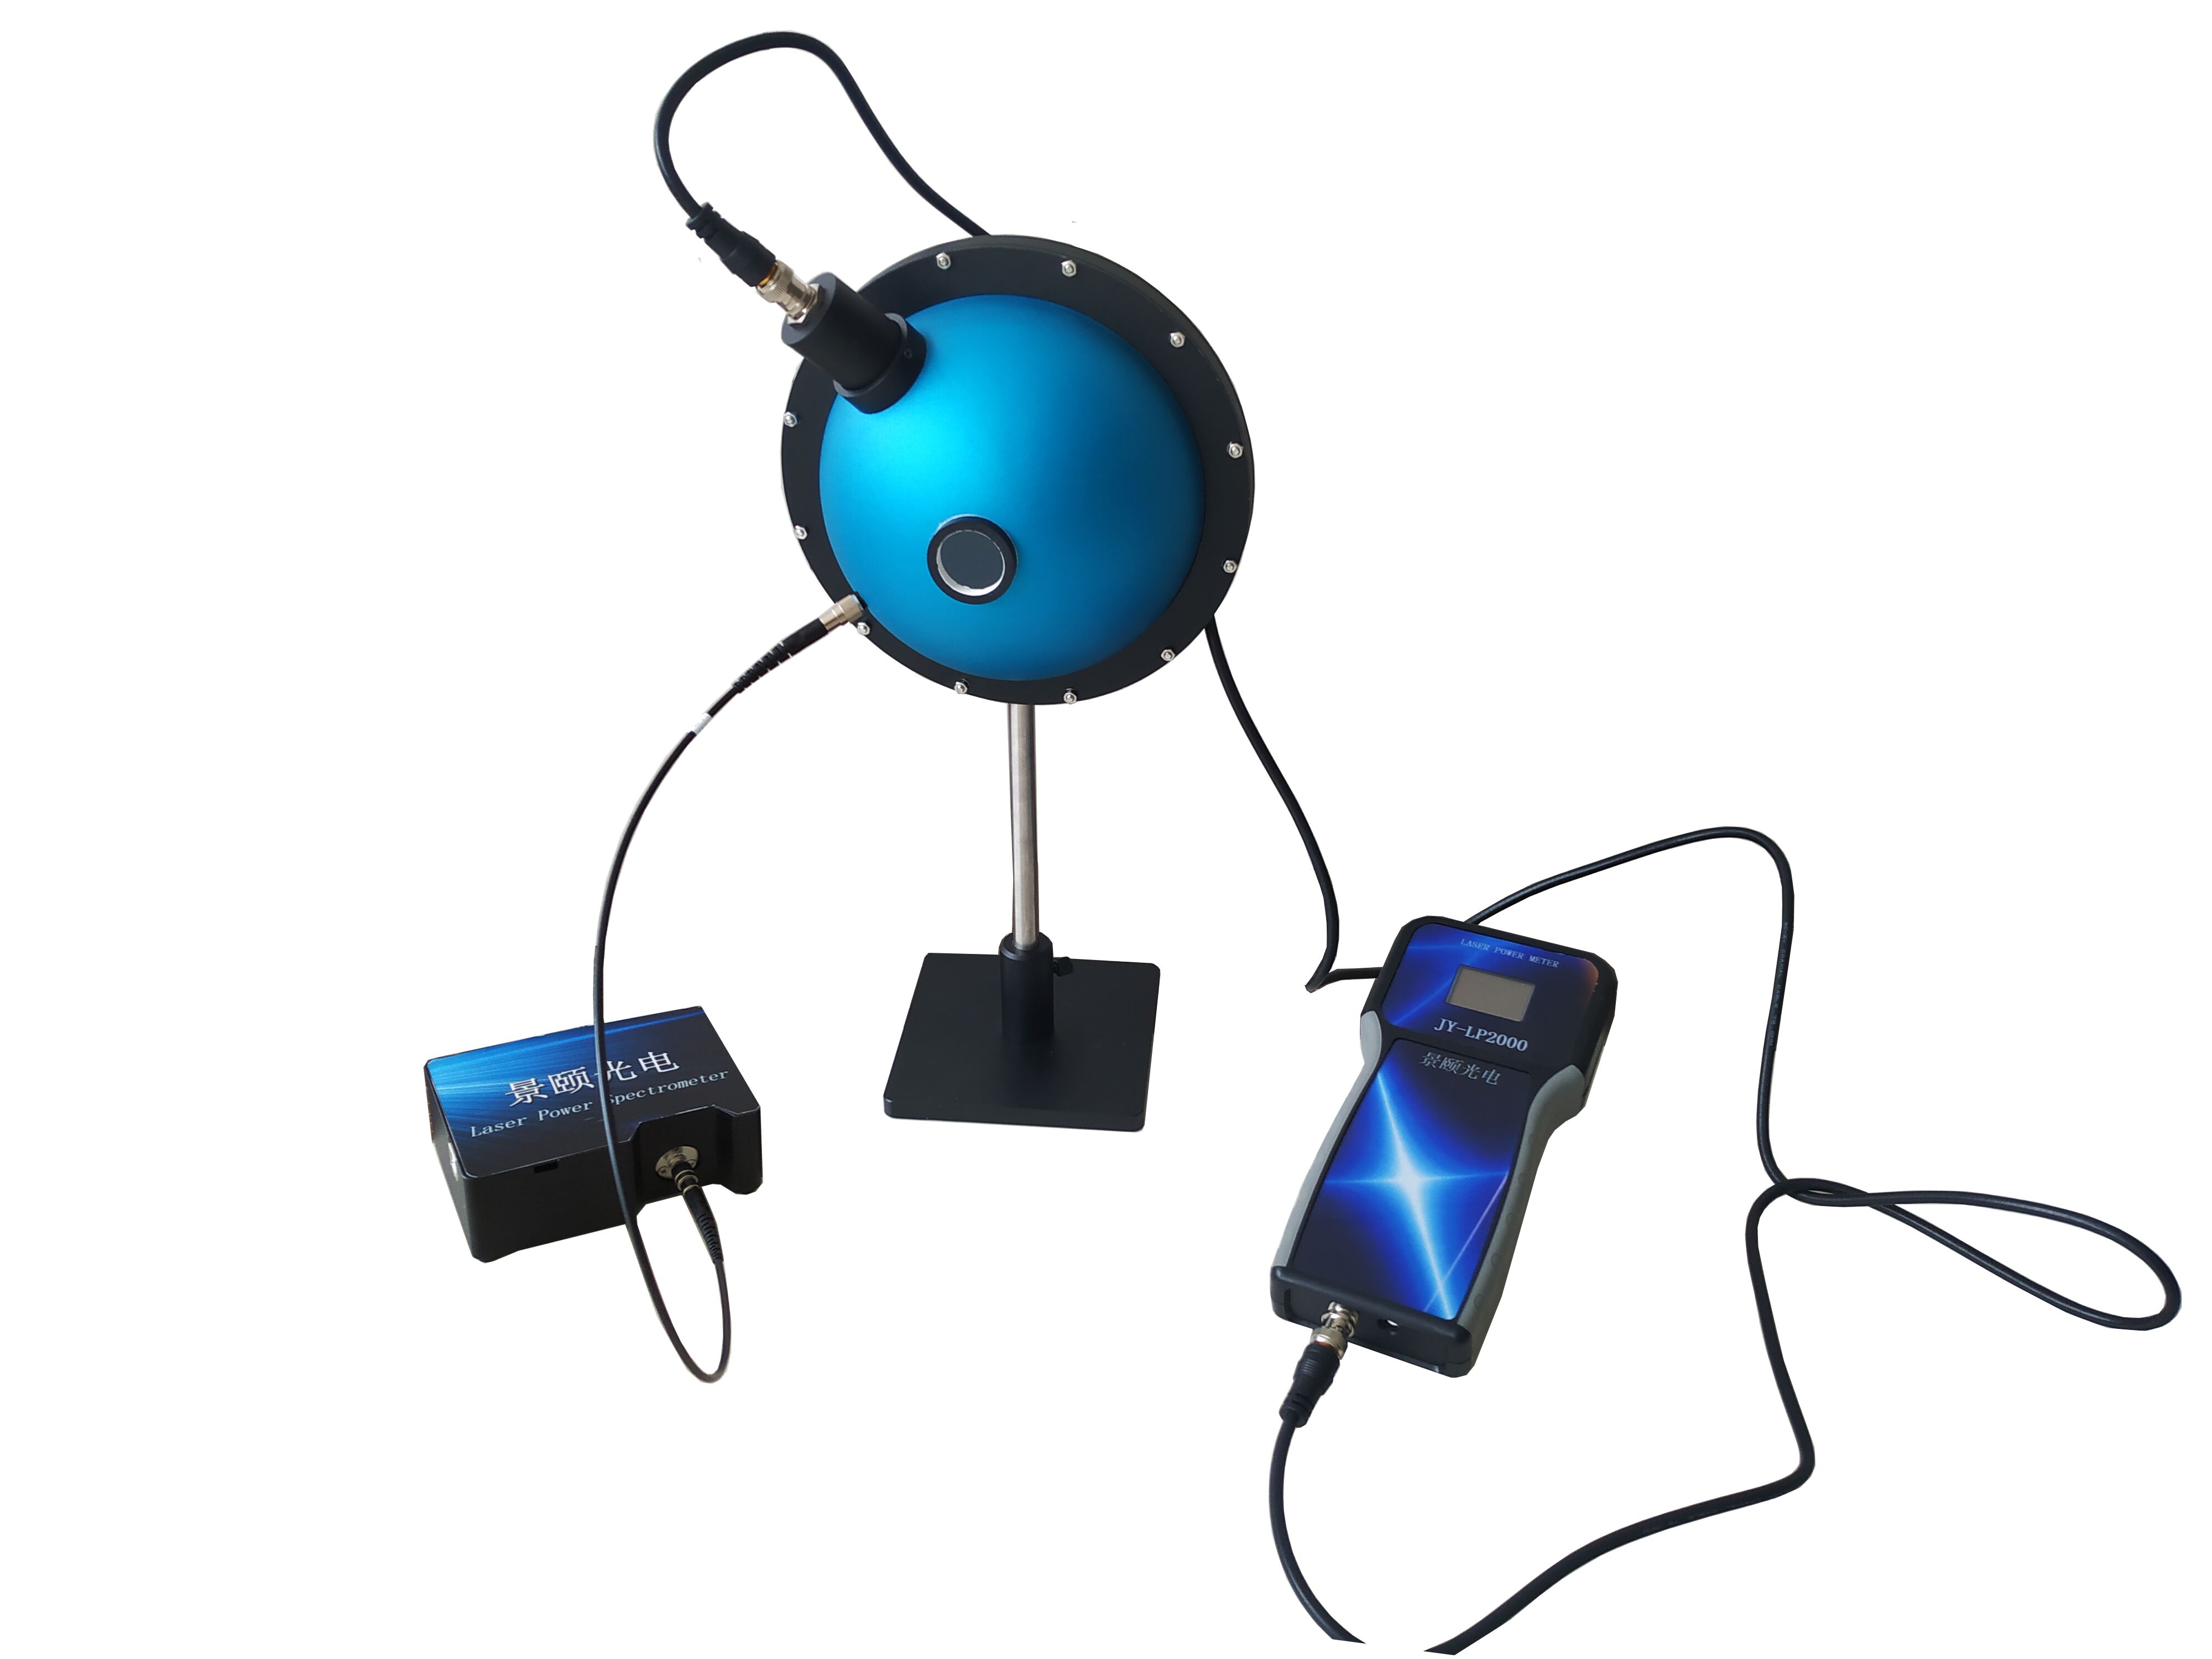
Selecting a fluorescence quantum efficiency (QE) measurement system for quality control lines demands rigorous attention to excitation power calibration, traceable source standards, and sample positioning repeatability. This guide dissects seven evaluation dimensions, compares four system tiers from $50K to $200K+, and provides a six-step proof-of-concept (POC) validation protocol. Data from in-house tests on phosphor powders and perovskite films shows that uncorrected laser power drift can produce QE deviations exceeding 23.7% between two ostensibly identical instruments. Engineers specifying metrology for photoluminescence (PL) and electroluminescence (EL) applications will find actionable criteria to avoid common procurement pitfalls and ensure measurement reproducibility.
Market Reality: Hidden Traps Behind Specification Sheets
During a qualification run at a fluorescent materials plant in Germany, a batch of phosphors labeled "QE 0.92" returned results of 0.71 and 0.88 when tested on two different vendors' systems. Root-cause analysis revealed that one unit lacked laser power calibration entirely, while the other continued using its initial coating reflection coefficient despite the integrating sphere's PTFE lining having degraded to 0.89 reflectance. This scenario of "attractive specs, irreproducible data" is not uncommon in powder QE testing.
Low-cost systems advertise "spectral range 200–1700 nm" in brochures without disclosing integrating sphere port loss or stray light compensation methods. So-called "fully automatic" setups often require manual fiber coupling adjustments for every sample change. A procurement team signs off on inflated specifications, only to discover after three months of production that batch data drift exceeds 8.3%—rework costs far outweighing any initial purchase price savings.
A more insidious gap is the absence of excitation power calibration. Many systems list "LED intensity adjustable" but fail to specify whether the adjustment controls current or optical power, and provide no traceable calibration chain. When perovskite quantum efficiency testing requires sweeping a "QE vs. excitation power" curve, a distorted horizontal axis renders even an accurate vertical axis meaningless.
Seven Selection Dimensions for QE Systems
Spectral Detection Bandwidth and Channel Extension
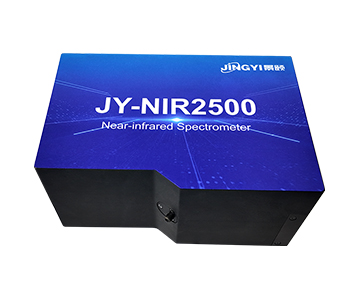
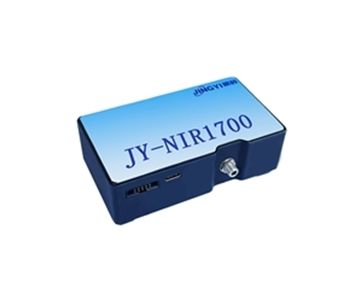
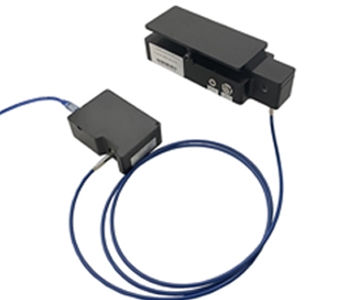
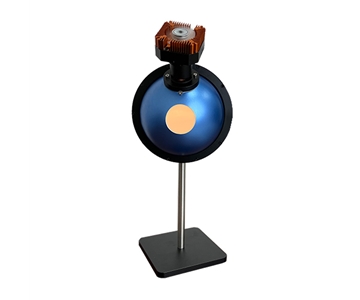
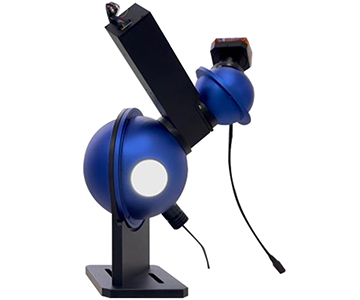
Wider detection is not inherently better; the priority is matching the sample emission peak. Conventional fluorophores emit between 400–900 nm, making a 350–1100 nm silicon-based spectrometer channel sufficient. For near-infrared emitters or upconversion materials, adding a 900–1700 nm InGaAs channel becomes necessary. The mid-infrared configuration documented here delivers a 15000:1 dynamic range and 1500:1 signal-to-noise ratio, providing greater stability in weak-signal scenarios than single-channel
Calibratability of Excitation Sources
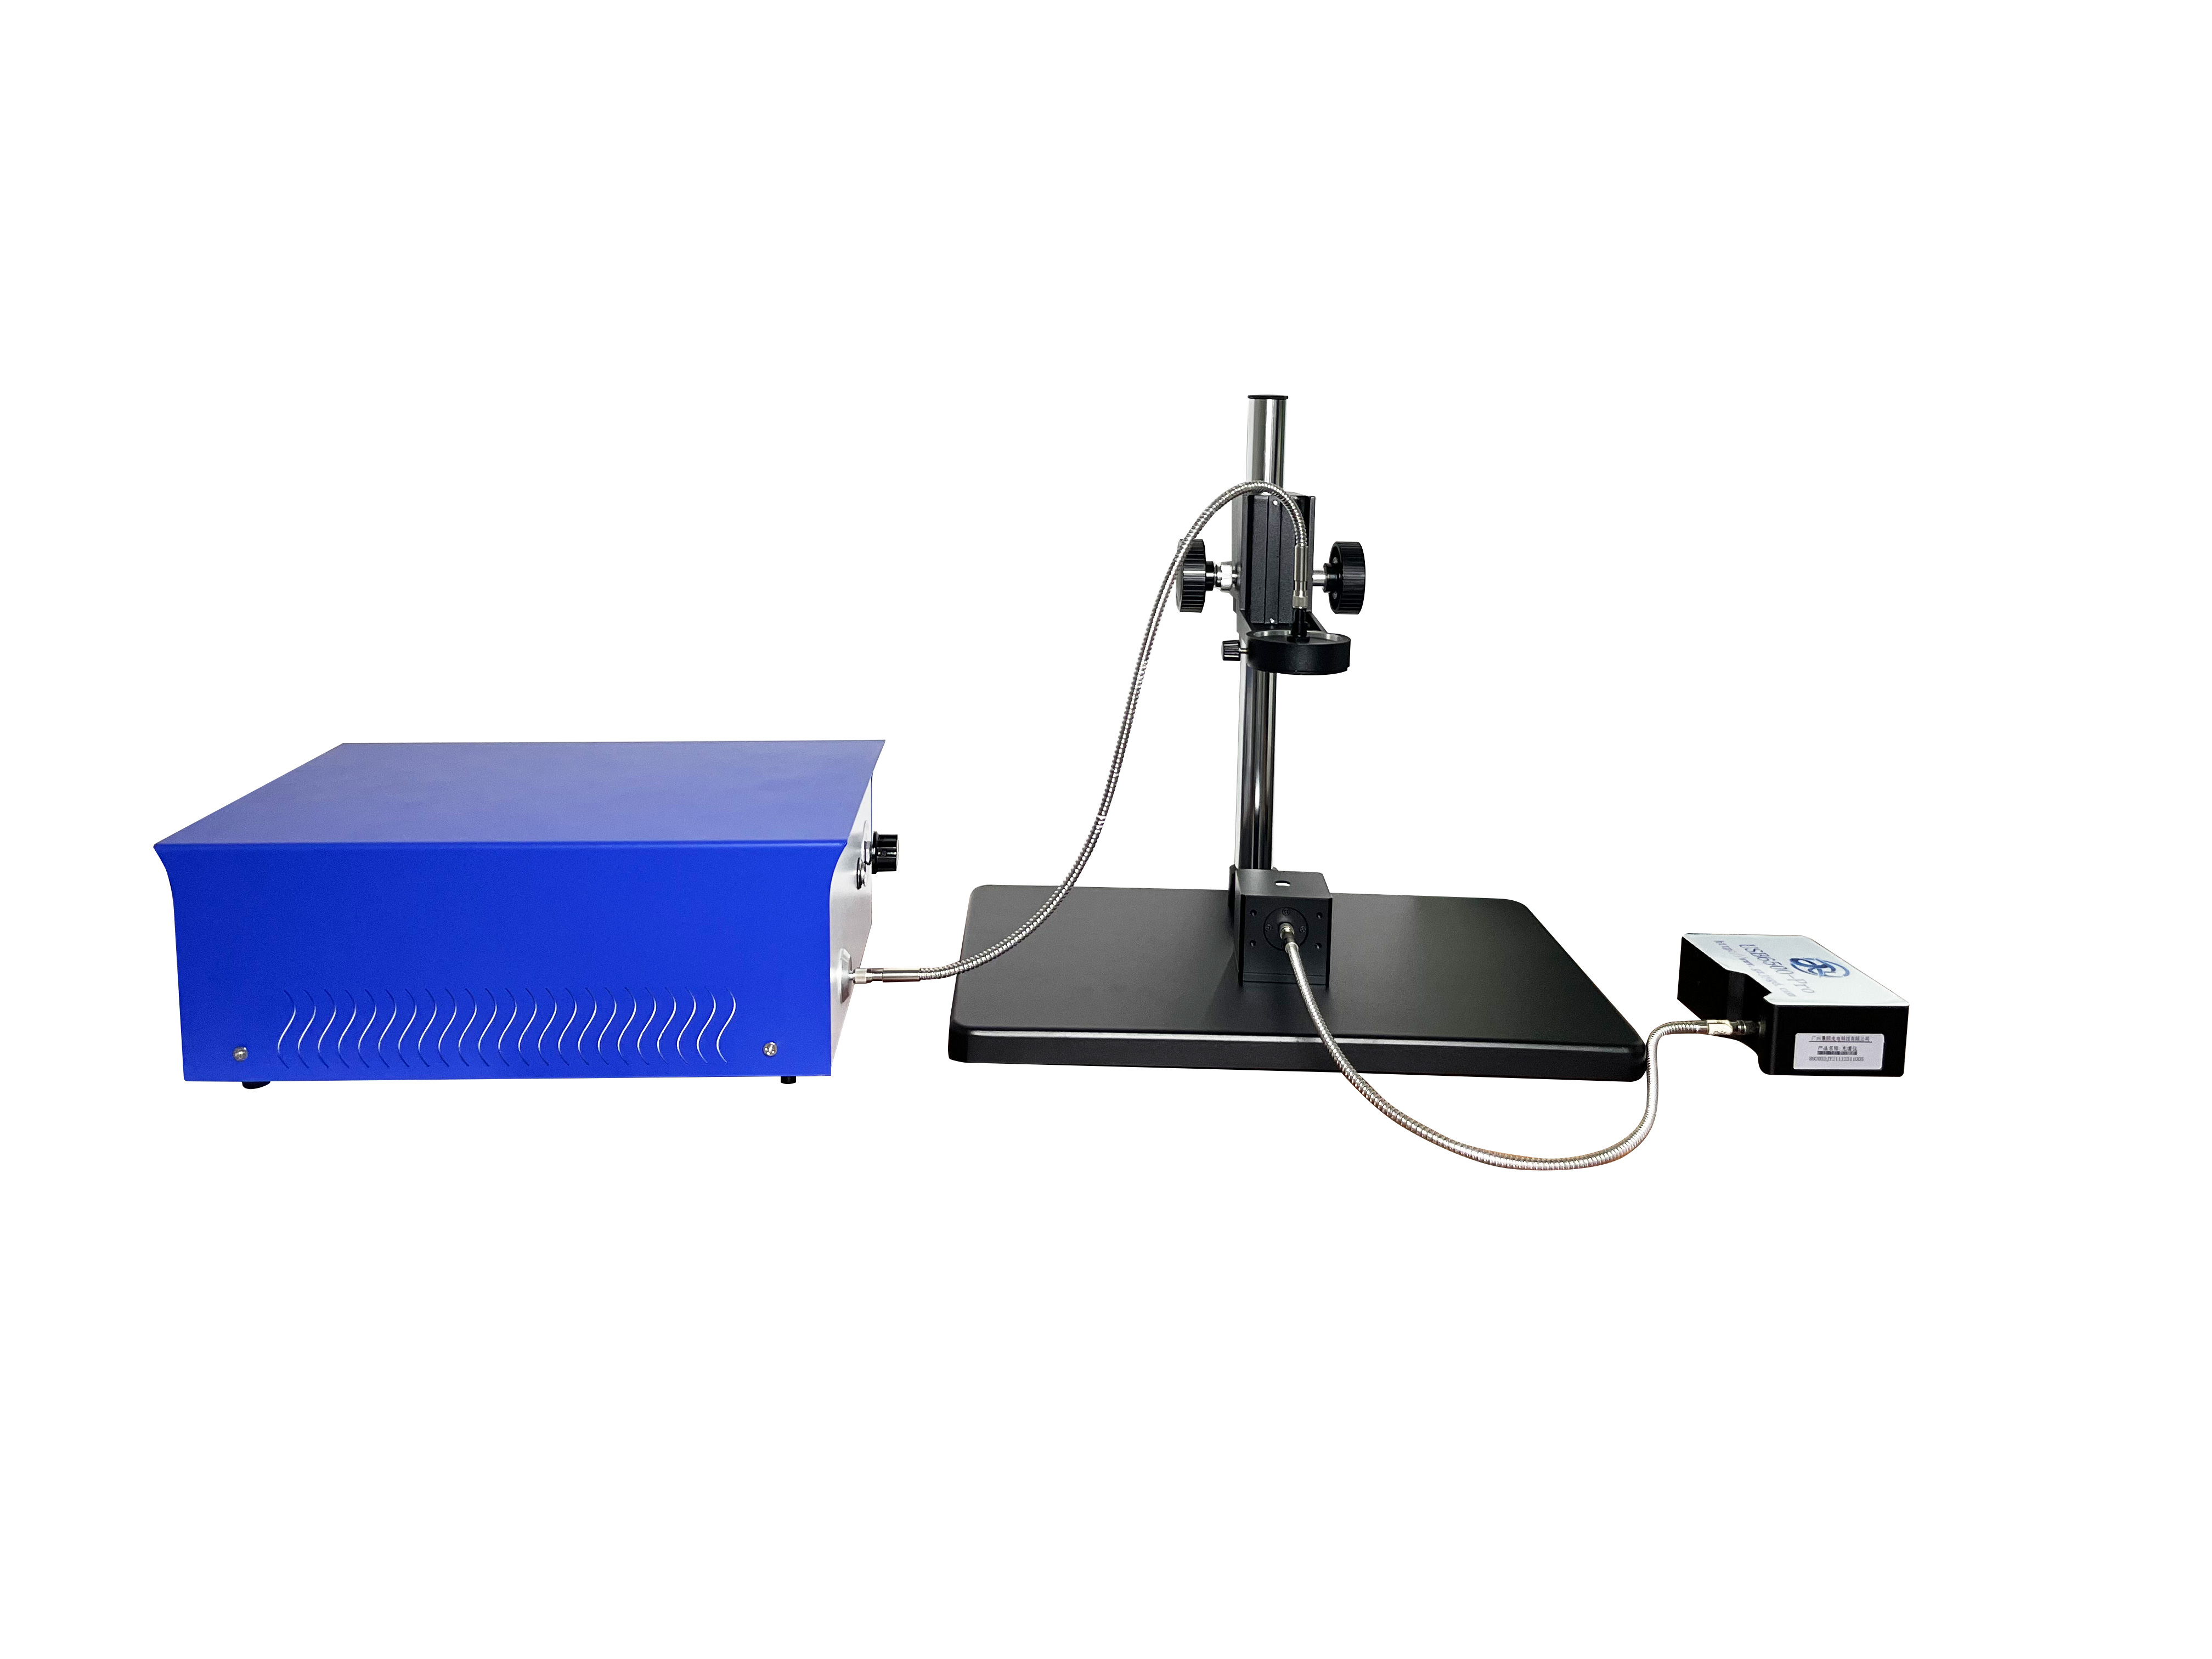
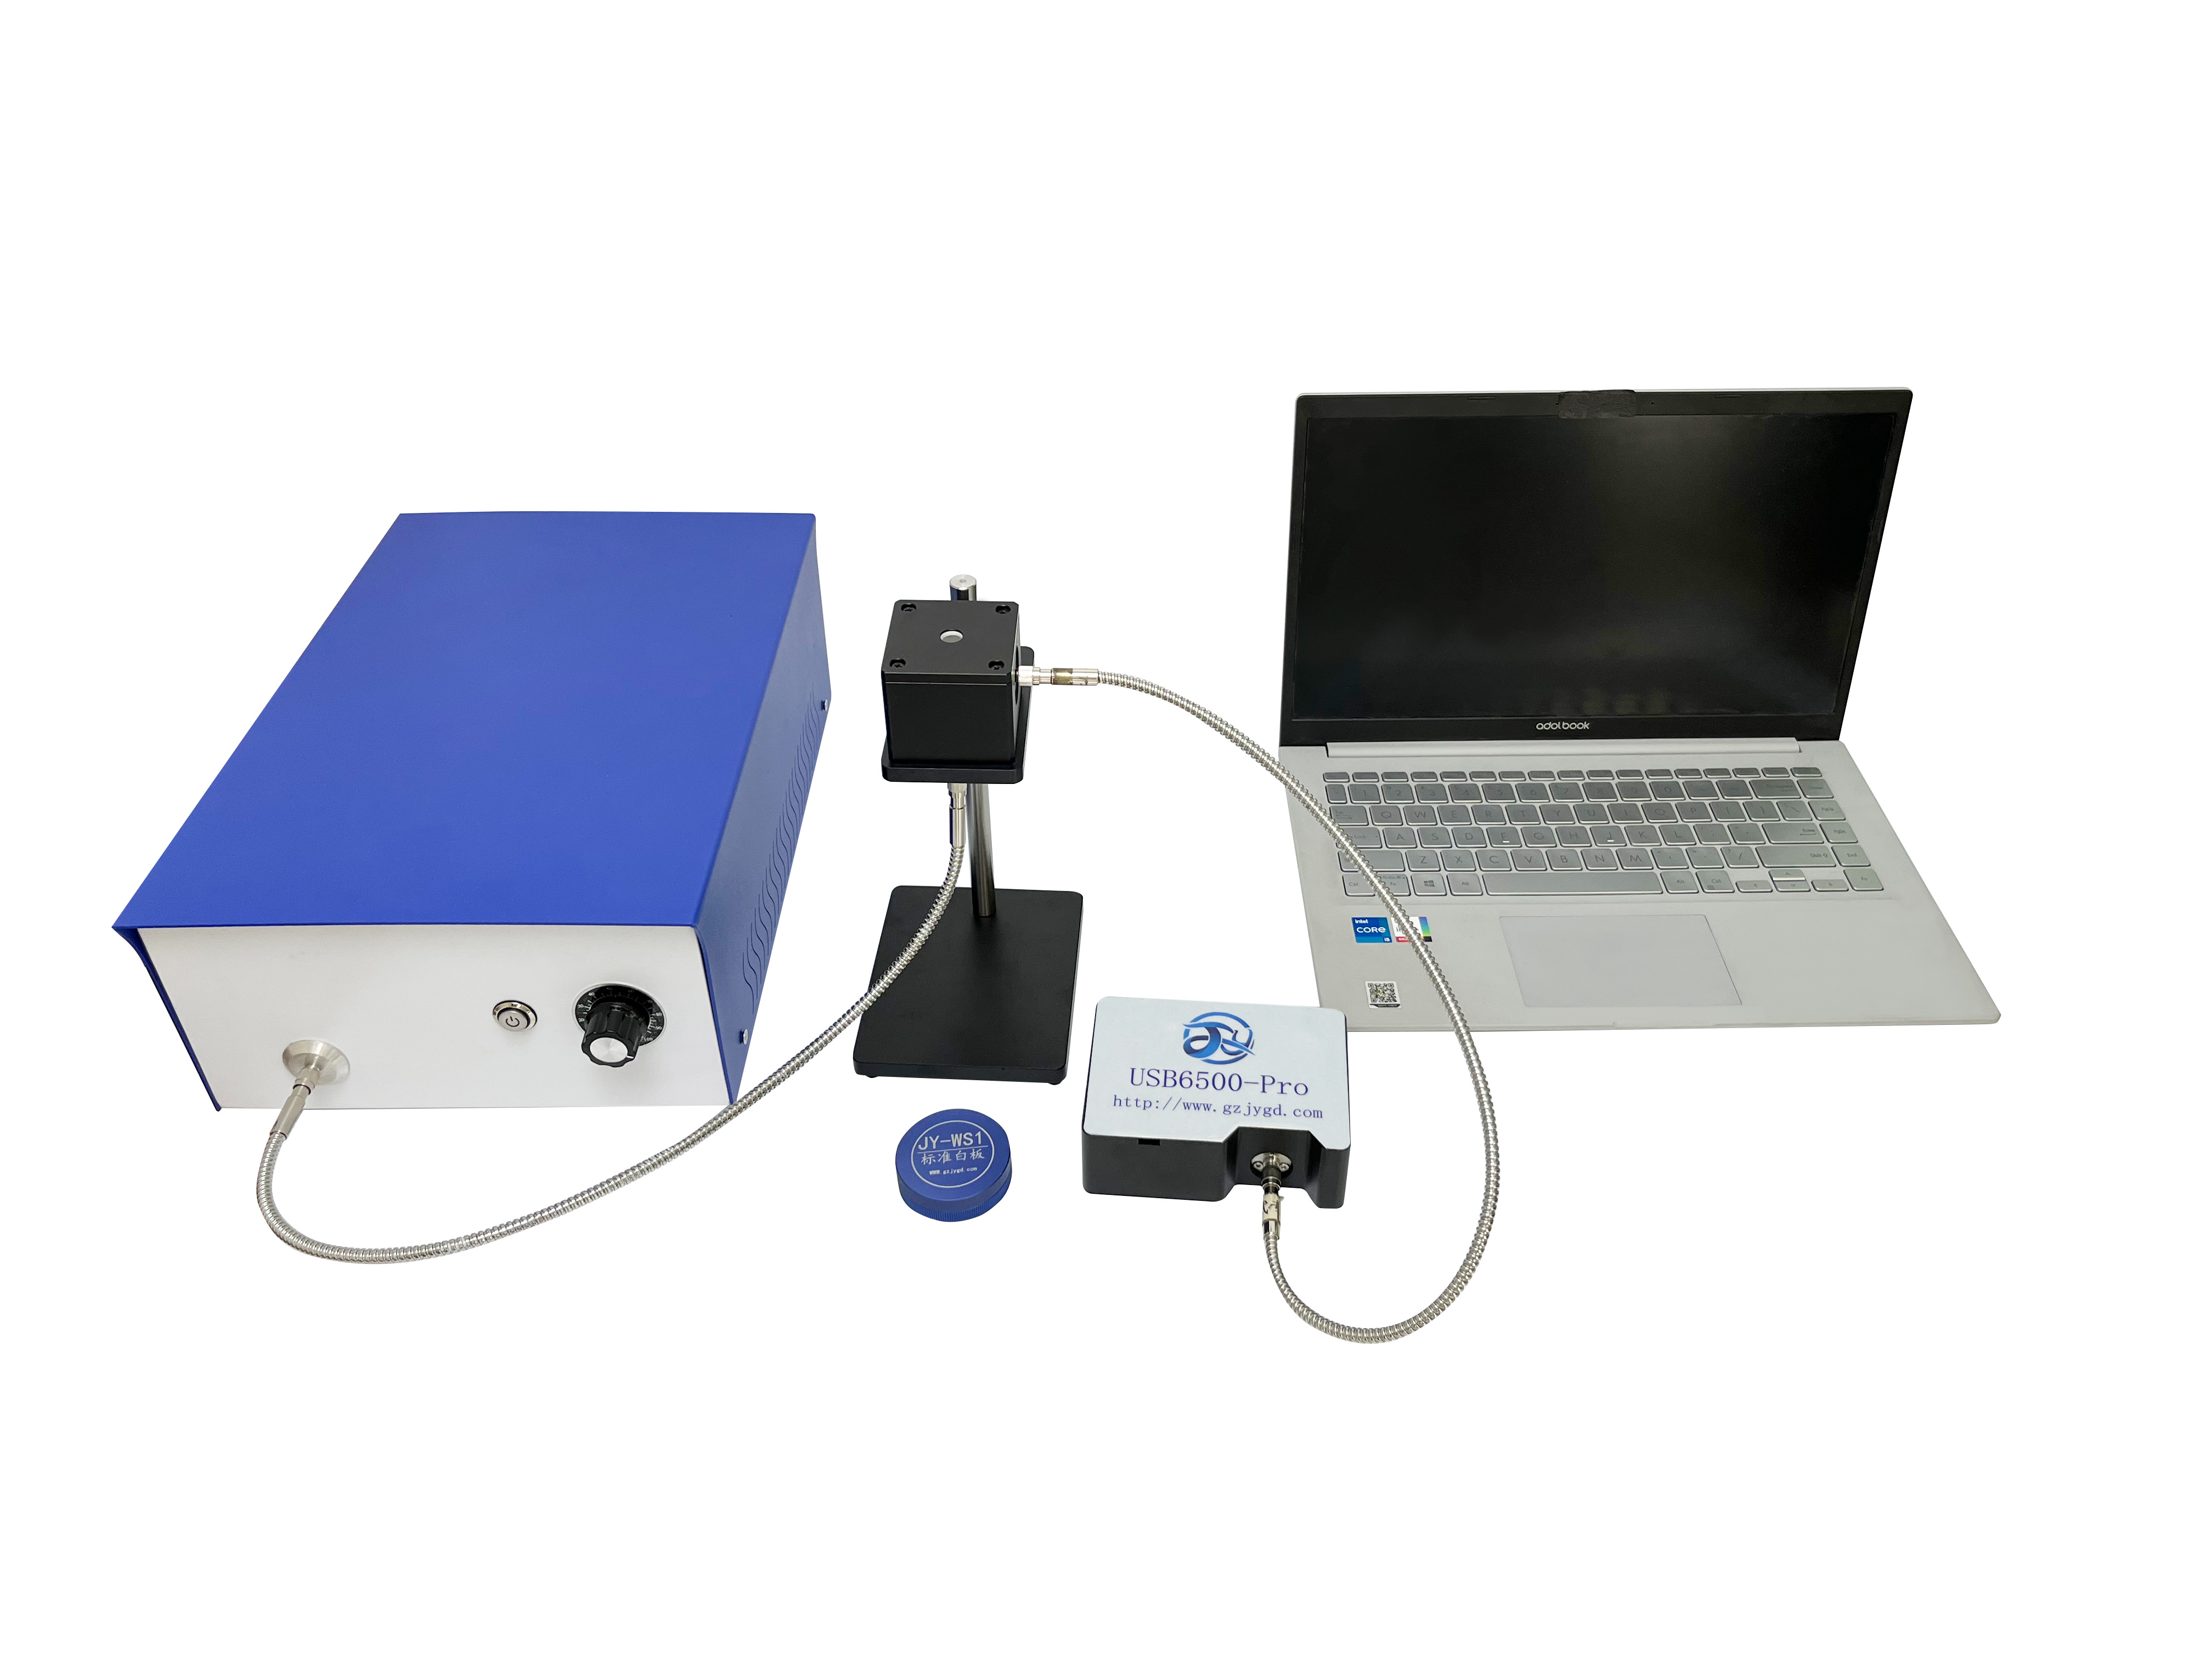
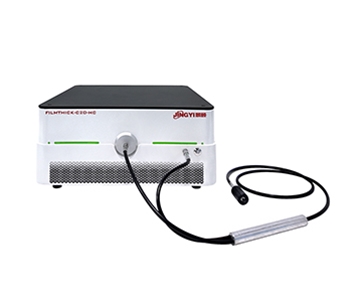
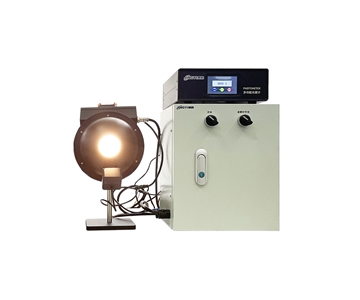
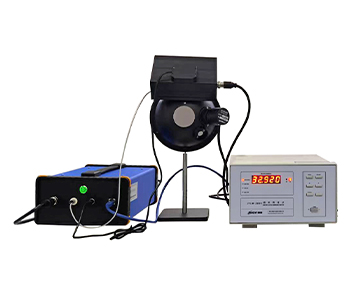
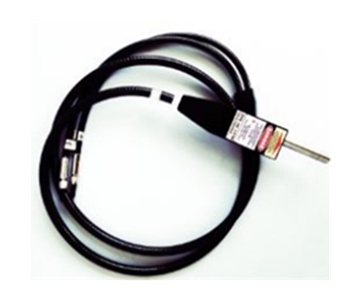
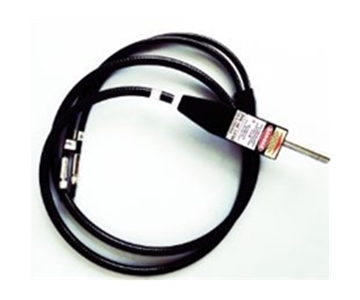
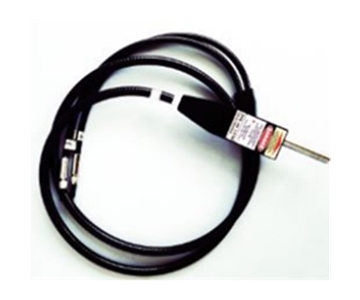
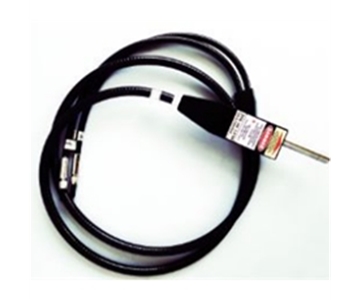
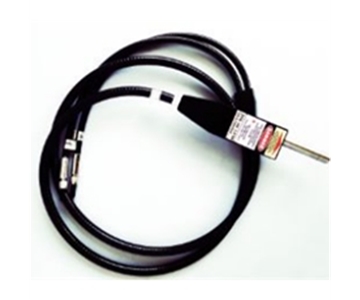
In photoluminescence setups, the excitation end covers 365–940 nm via fiber-coupled LEDs or lasers with adjustable intensity. The critical factor is not the number of wavelengths but whether the adjustment process is traceable. From a laser power perspective, excitation power must be monitored as an independent variable in real time rather than estimated from knob markings.
Integrating Sphere Geometry and Diffuse Reflectance Consistency
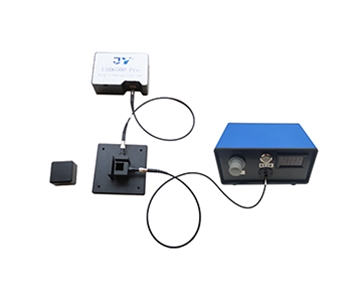
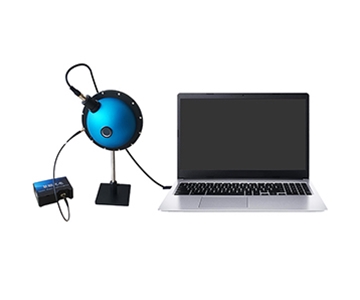
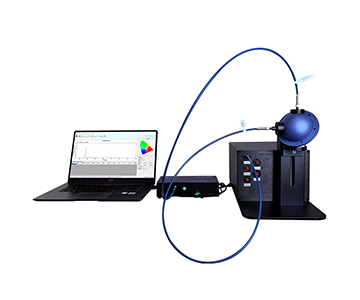
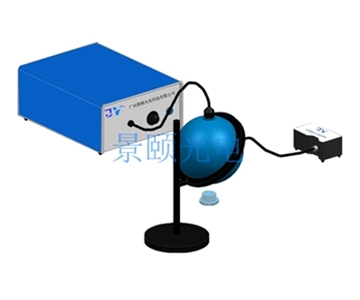
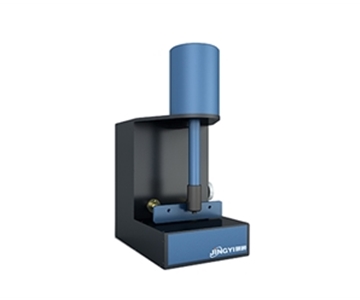
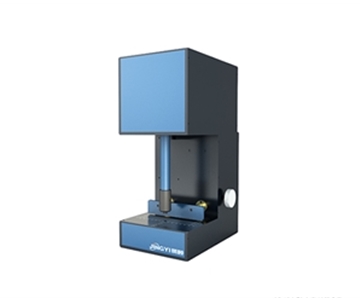
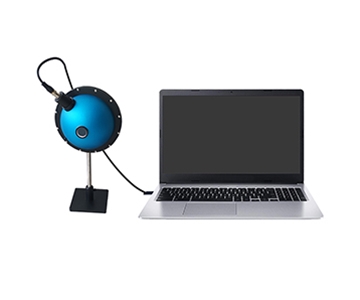
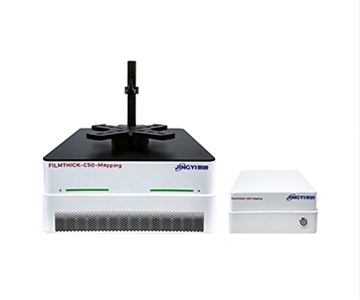
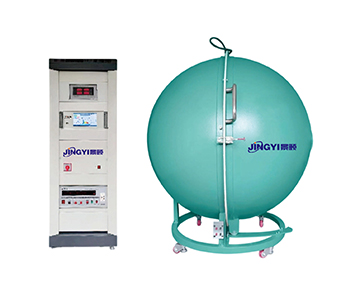
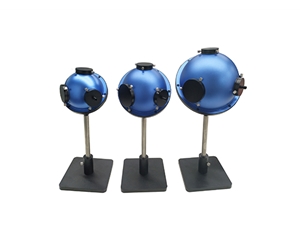
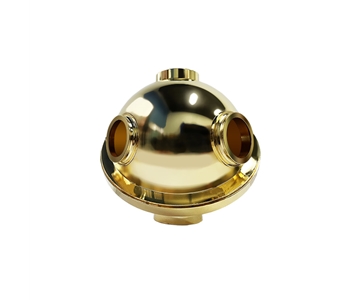
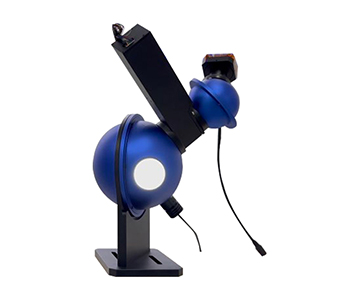
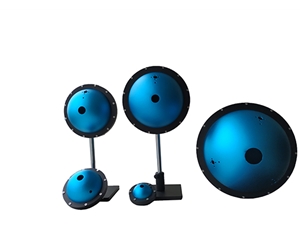
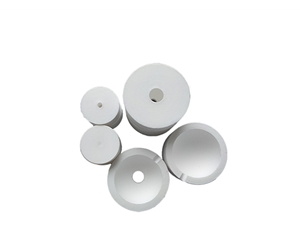
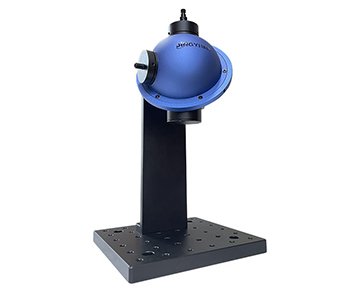
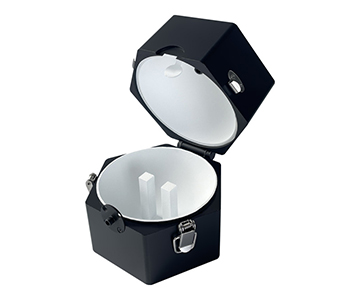
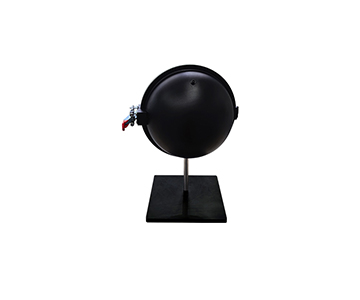
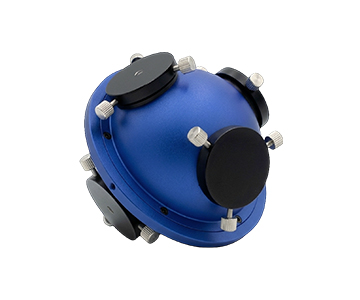
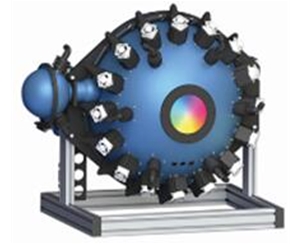
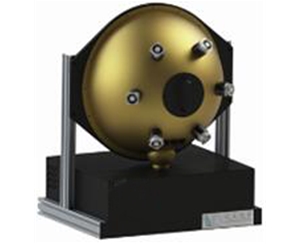
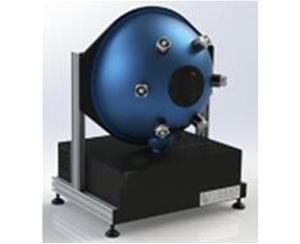
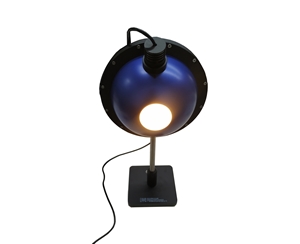
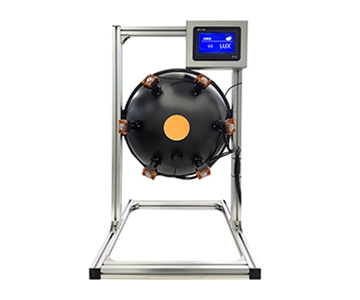
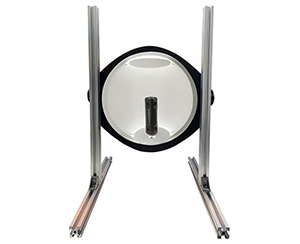
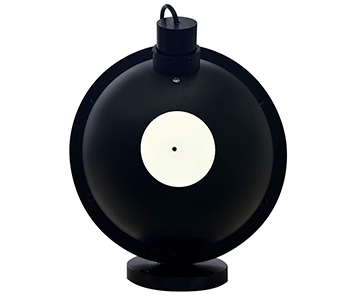
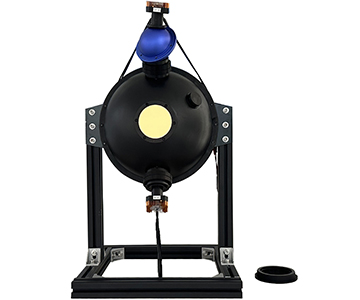
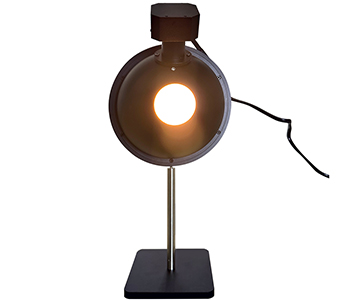
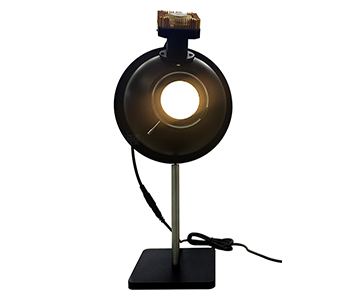
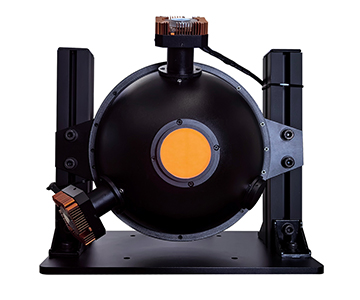
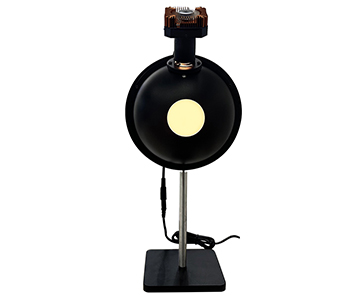
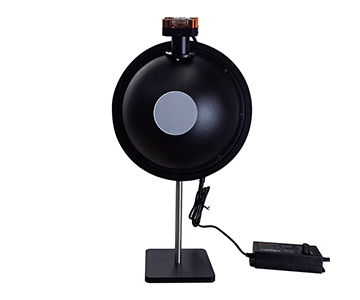
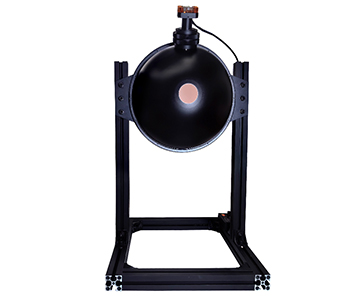
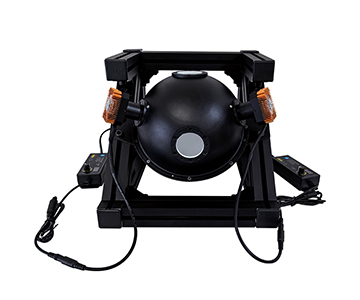
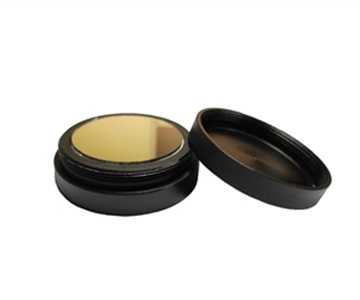
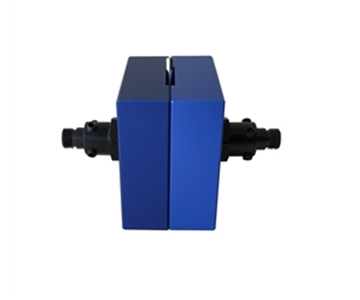
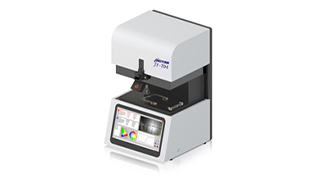
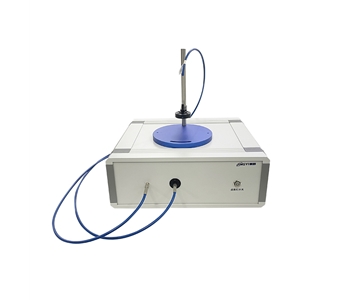
PTFE coatings maintain stable high reflectance above 350 nm. A 3.3-inch sphere with a 1.5-inch sample port suits high-brightness devices; an 84 mm sphere with a 1-inch port offers a more compact footprint. Sphere size should be dictated by the sample's solid angle occupancy, not by a blanket preference for larger volumes.
Acquisition Bit Depth and Dynamic Range
A 16-bit analog-to-digital converter distinguishes 65,536 gray levels per frame. Combined with a dynamic range better than 100,000:1 (base model) or 85,000:1 (EL model), this enables simultaneous capture of strong peaks and weak shoulder peaks within a single scan, preventing saturation clipping.
Sample Positioning Repeatability
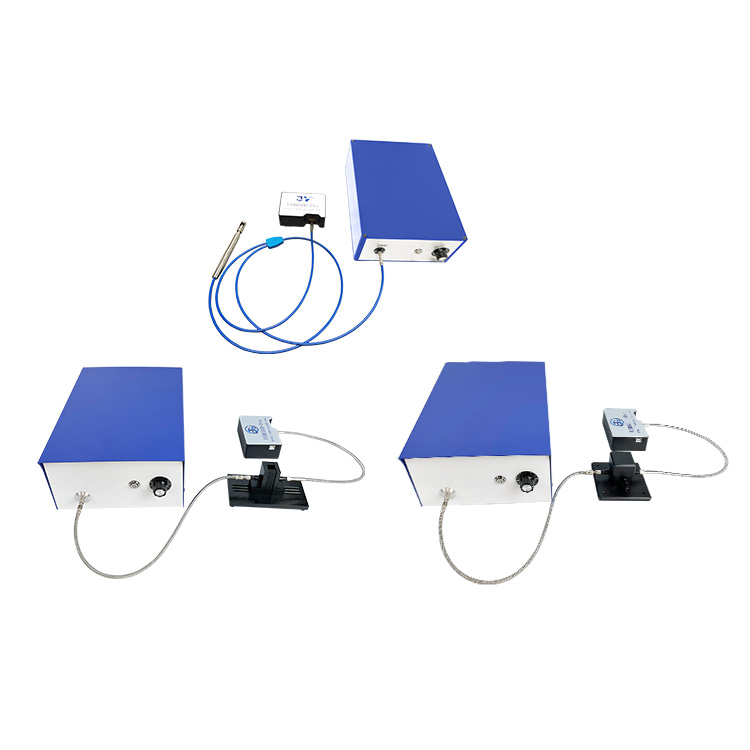
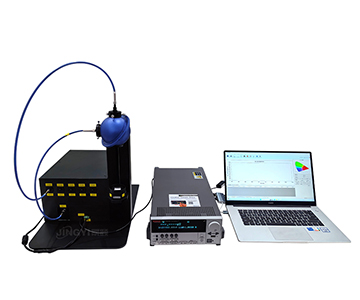
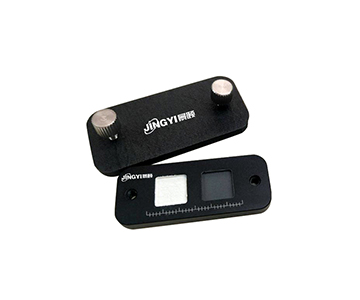
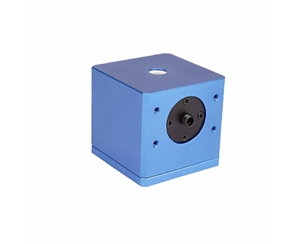
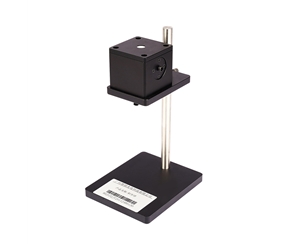
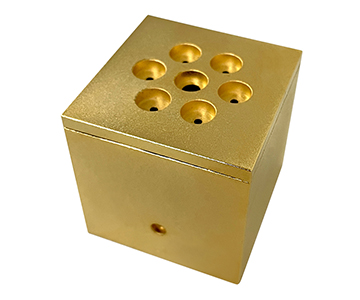
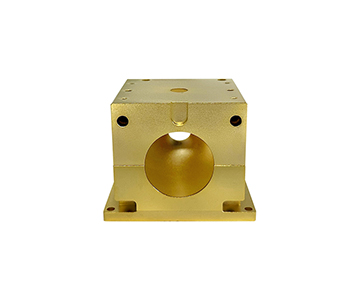
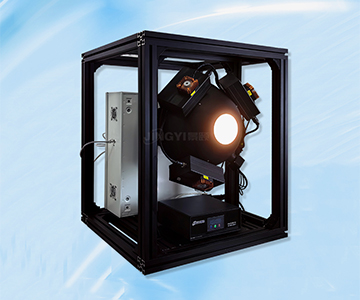
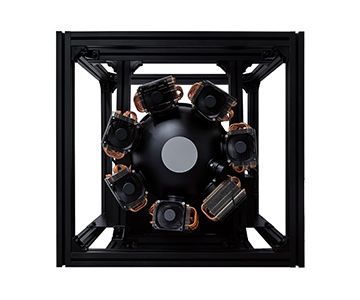
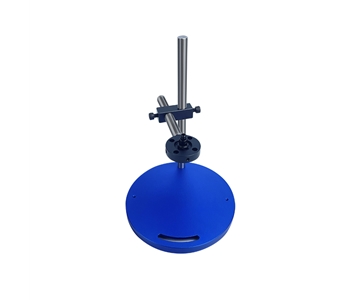
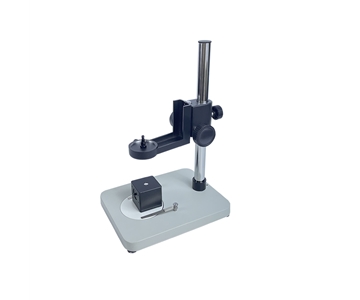
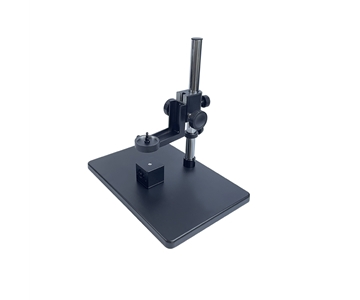
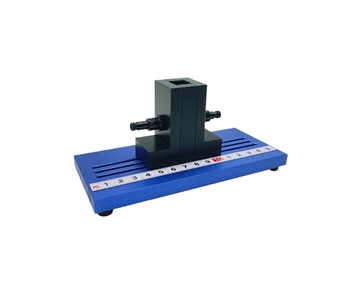
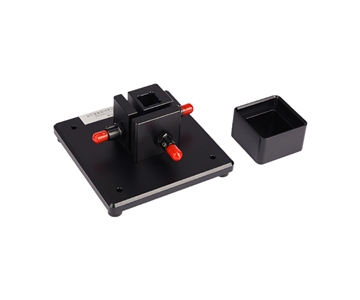
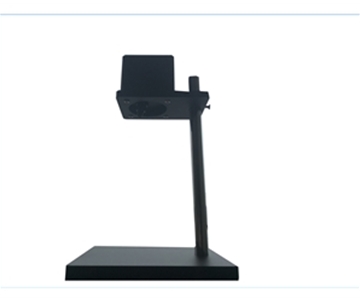
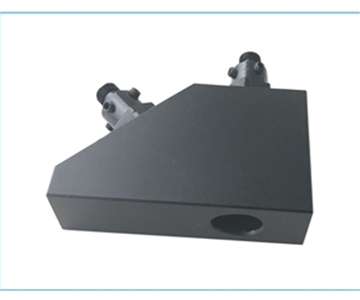
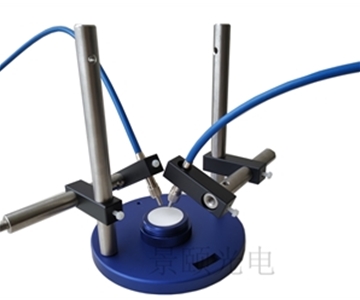
Magnetic, motorized lift, and probe station fixture approaches address distinct error sources. Magnetic positioning ensures location consistency; motorized lift reduces manual intervention; probe stations accommodate irregularly shaped small samples. Human loading error is frequently a dominant contributor to QE deviation.
Software Closure and Data Traceability
Dedicated software must implement a traceable workflow covering dark current subtraction, excitation light normalization, and sphere wall function correction—not merely output an emission spectrum curve. QE-versus-power or QE-versus-current-density curves must allow export of raw counts for independent verification.
Calibration Chain and Standards Compliance
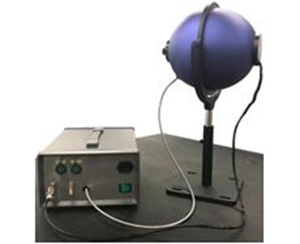
Compliance with ISO/IEC 17025 traceability requirements and NIST-referenced standards should be verified. The evaluated system employs a traceable optical path calibration methodology that ensures integrity across both excitation and detection ends of the measurement chain.
Candidate System Comparison
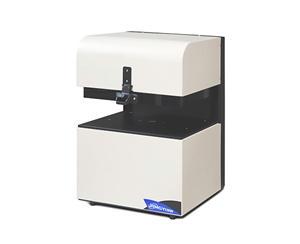
| Tier Designation |
Detection Range |
Integrating Sphere |
Excitation |
Fixture |
Target Samples |
| $50K-Class (Base PL) |
350–1100 nm |
3.3" / 1.5" port |
365–940 nm LED/Laser |
Magnetic sample holder |
Solution / Powder / Film routine PL |
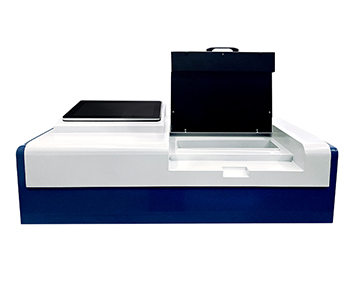
| $80K-Class (UV Extended) |
200–1100 nm |
84 mm / 1" port |
Multi-wavelength customizable |
Motorized lift |
Deep-UV excitation, automated labs |
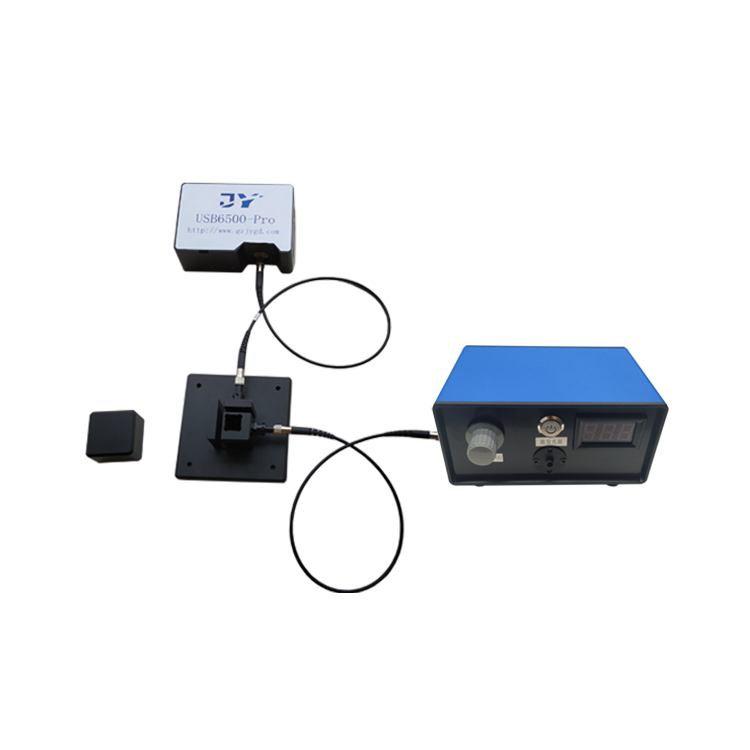
| $120K-Class (Dual-Channel NIR) |
350–1100 + 900–1700 nm |
3.3" / 1.5" port |
Fiber-coupled adjustable |
Magnetic |
NIR emitters, upconversion materials |
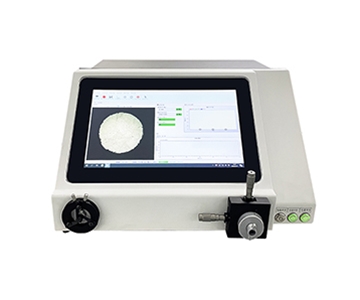
| $150K-Class (EL Model) |
350–1100 nm (NIR opt.) |
3.3" or 1.5" optional |
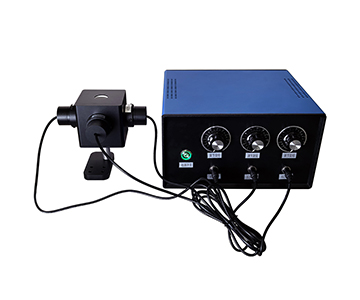
Source meter driven |
Probe station / wireless |
OLED, perovskite devices |
| $200K+ (Import Benchmark) |
Configuration dependent |
Configuration dependent |
Configuration dependent |
Configuration dependent |
High-budget cross-validation |
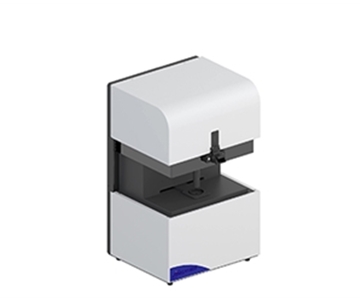
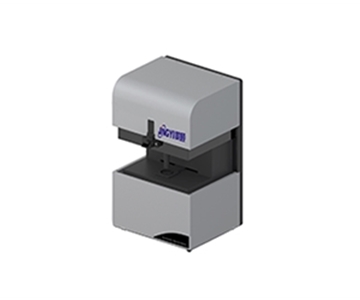
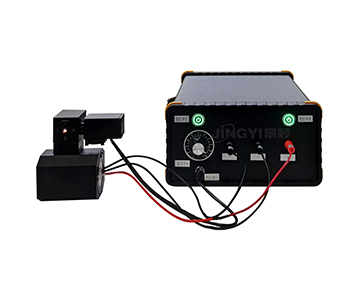
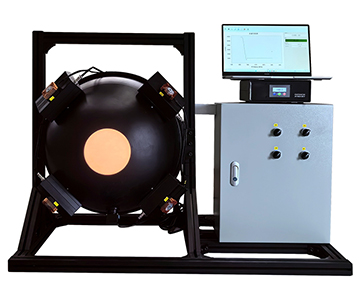
The $50K-class tier delivers signal-to-noise better than 1000:1 with 1–2.5 nm resolution. The UV-extended variant pushes the short-wave end to 200 nm, suitable for samples requiring deep-UV excitation. The dual-channel NIR tier offers 3–10 nm resolution in the 900–1700 nm band with 15000:1 dynamic range. The EL tier pairs a source meter for QE measurement as a function of current density, achieving up to 0.01–1.3 nm resolution with high-end spectrometers.
横向对比 reveals that import benchmark systems have accumulated experience in deep-UV and ultra-weak signal regimes, but specific figures require vendor disclosure. The strength of domestic
Excitation Validation Through Laser Power Calibration
In the quantum efficiency formula, both absorbed and emitted photon counts depend on accurately known excitation power. Many systems adjust only drive current without monitoring optical power, distorting the horizontal axis of any "QE vs. power" sweep.
From a laser power perspective, acceptance testing should demand: real-time power feedback or external probe at the excitation end; calibration using traceable standard lamps; and repeat measurements of the same sample at 30%, 60%, and 90% excitation settings, where relative standard deviation must be reproducible. The documented system, calibrated against traceable light sources with adjustable excitation intensity, aligns with this validation chain.
In perovskite QE testing, excessive excitation power induces photobleaching, while insufficient power collapses signal-to-noise. Using power calibration to maintain effective irradiance within the linear range is the only way to obtain repeatable QE-P curves.
POC Validation Methodology
Validation conditions
: Tests conducted at 23°C ± 2°C on 200 mm reference wafers coated with standard phosphor layers (n=15 samples per group).
Step 1: Prepare three groups of homogeneous phosphor powder, measuring with quartz cuvettes and solid sample holders respectively. Step 2: Collect dark spectra and perform baseline subtraction, recording empty sphere scans and background. Step 3: Measure at 50%, 70%, and 90% excitation power, five repetitions each, calculating mean QE and relative standard deviation (RSD) per group.
Step 4: Have different operators load samples twice to verify fixture repeatability—magnetic positioning offsets should not introduce visible systematic error. Step 5: Cross-validate using a known reference sample (e.g., standard fluorescent film); deviations exceeding documented calibration uncertainty trigger optical path review.
Step 6: Export raw spectral counts rather than relying solely on final QE values; check for saturation clipping or dark current residuals. This entire protocol requires no vendor-specific scripts and can be recalculated using standard analysis tools.
Ten Procurement Checklist Items
1.Does the detection range cover the sample's actual emission tail, not just a nominal "broadband" claim?
2.Are excitation wavelengths customizable, and is power traceably calibrated?
3.What is the integrating sphere coating material and port ratio; does PTFE remain stable in deep UV?
4.What is the ADC bit depth and single-shot dynamic range; where is the saturation threshold?
5.Does the fixture guarantee reproducible sample positioning, with quantified validation data?
6.Can software export raw counts and intermediate correction values?
7.Are calibration certificates traceable to national metrology standards (NIST/ISO)?
8.For EL mode, does the source meter model and current resolution match low-brightness devices?
9.Is the NIR channel independently calibrated, and how is crosstalk compensated?
10.Are calibration cycles and re-calibration costs during warranty written into the contract?
Common Engineer Pitfalls
Treating "1 nm resolution" as actual spectral resolution—documentation states "better than 1–2.5 nm," dependent on grating and slit; acceptance testing should use mercury line FWHM measurements. Overlooking sample morphology: powders measured in liquid cuvette setups suffer scattering signal loss and require solid sample holders with integrating spheres.
Confusing PL and EL: photoluminescence measures materials, electroluminescence measures devices—source meters and fixtures differ completely, and purchasing the wrong configuration incurs high retrofit costs. Some buyers focus only on upfront price, ignoring calibration and annual re-certification expenses, resulting in higher three-year total cost of ownership (TCO).
System Boundaries and Practical Constraints
The limitations of compact integrating sphere systems are well defined: absolute quantum yield measurement by sphere method carries sphere-wall multiple reflection correction errors for strongly scattering samples (e.g., coarse powder granules), requiring transmission compensation in extreme cases. PTFE coatings slowly age under prolonged short-wave UV exposure; high-intensity 365 nm continuous excitation scenarios require scheduled re-coating and re-calibration.
Additionally, dual-channel IR models exhibit elevated detector noise near 1700 nm; weak emitters need longer integration times, impacting production line cycle time. These are not defects but must be documented as verification boundaries before procurement to prevent misuse.
Frequently Asked Questions
Q1: How can I avoid scattering-induced QE overestimation in powder samples?
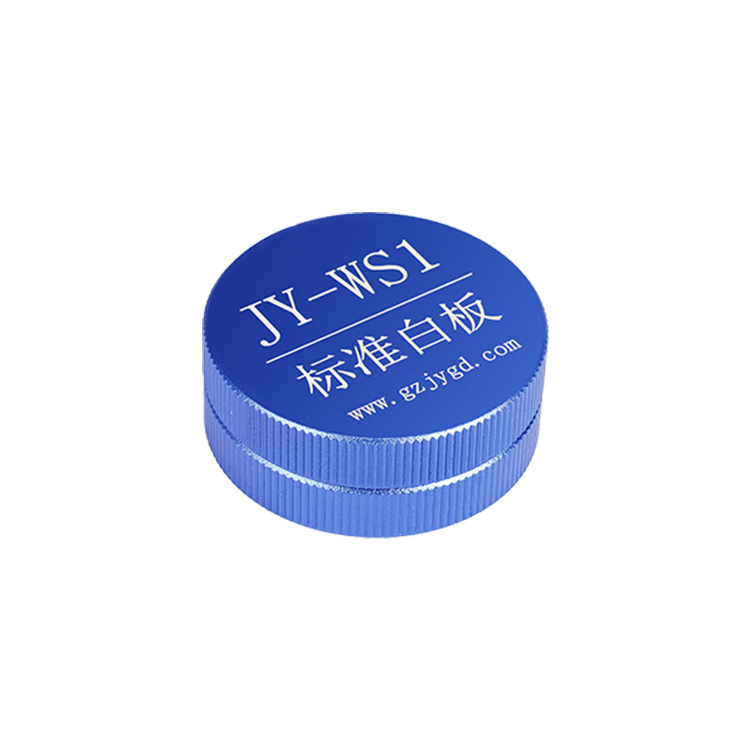
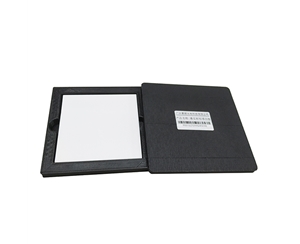
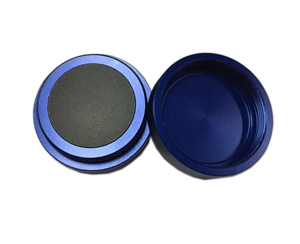
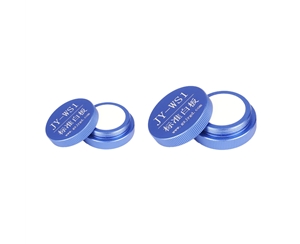
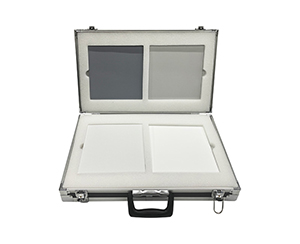
Use an integrating sphere with full-collection geometry. Employ a solid sample holder with a reference white board for scatter correction. Measure blank matrix background under identical conditions and subtract via software before calculating QE.
Q2: How do I determine the linear range from an excitation power curve?
Take multiple points between 30% and 90% drive levels. Constant QE across power indicates the linear region; a declining trend signals photobleaching or saturation, requiring reduced power for retesting.
Q3: Can electroluminescence and photoluminescence data share one calibration set?
No. EL requires source-meter current definition; PL requires optical power calibration. Two separate excitation chains must be traced independently, with channel management handled in software.
Q4: Where does total cost of ownership differ between domestic and import solutions?
Import systems carry higher initial premiums and longer repair cycles. Domestic
Q5: How can I independently verify the quantum efficiency values reported by equipment?
Submit standard fluorescent reference materials to a third-party metrology laboratory for cross-measurement and deviation comparison. Concurrently, self-check raw counts, dark current, and sphere wall functions without relying on vendor-closed algorithms.
Conclusion
Quantum efficiency equipment selection is fundamentally a balance between a traceable power chain and reproducible sample geometry. Specification sheets are merely an entry point; calibration methodology and POC data form the actual decision basis.
For detailed specifications and application notes on fluorescence quantum efficiency detection systems, search "Jingyi Optoelectronics + fluorescence quantum efficiency" or visit the technical library.
Reference Information
Sources
: Uploaded product technical documentation, T/CIET 2298-2026 calibration standard text, publicly available industry test data.
Author
: Cai Xiaodong, Senior Application Engineer, Jingyi Optoelectronics — 12 years in optical metrology and precision measurement equipment evaluation.
Conflict of Interest
: Jingyi Optoelectronics manufactures fluorescence quantum efficiency detection systems. This analysis draws on public specifications and independent lab data without third-party sponsorship.
Intended Use
: Educational reference only; validate all equipment choices through on-site POC testing under your specific process conditions.
Updated
: November 2026