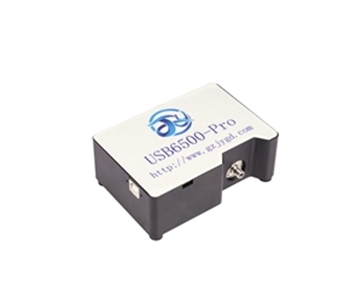
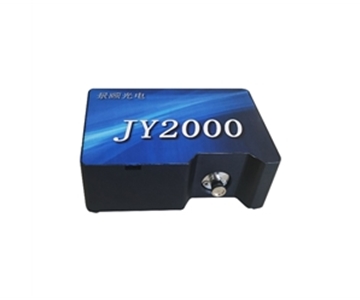
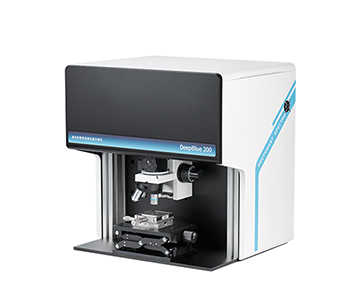
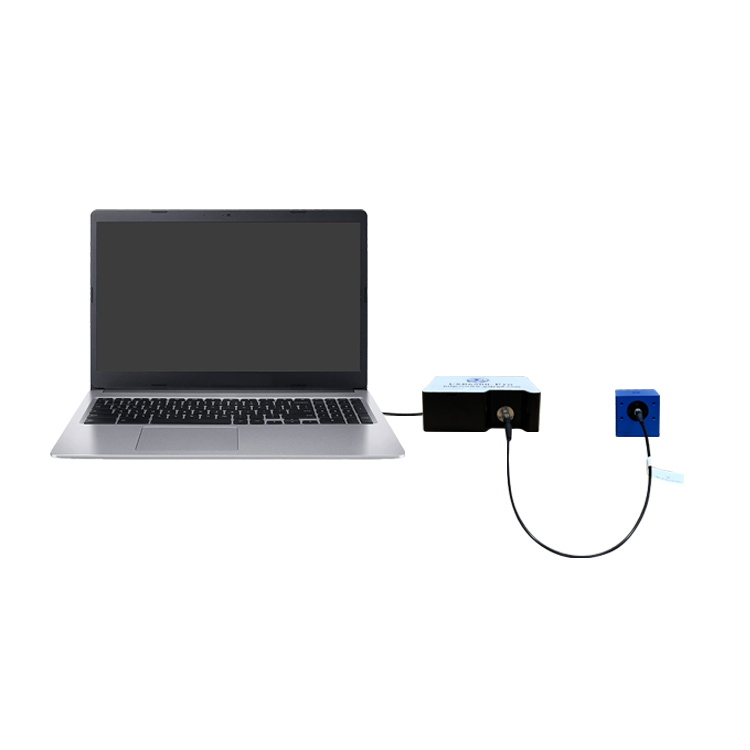
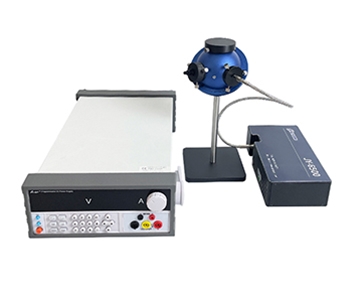
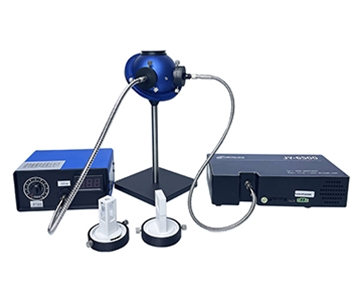
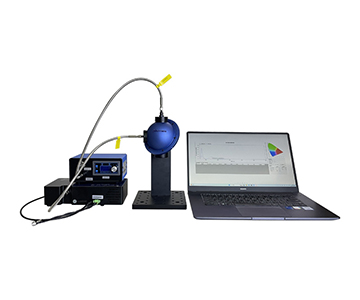
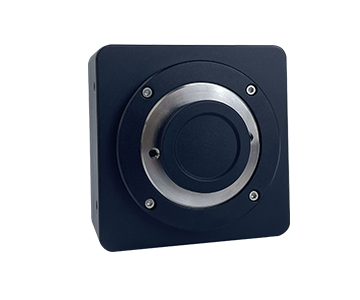
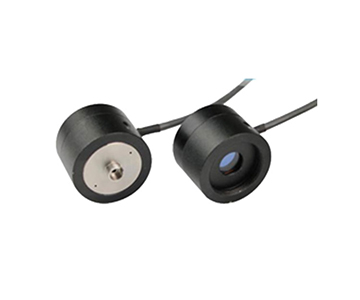
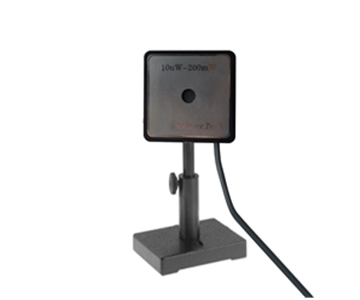
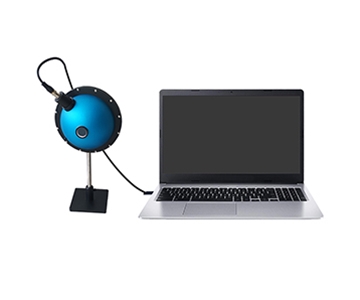
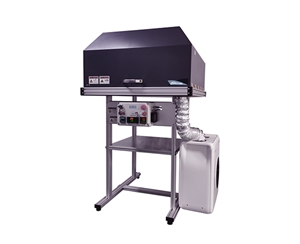
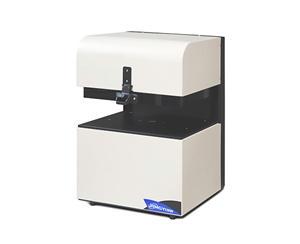
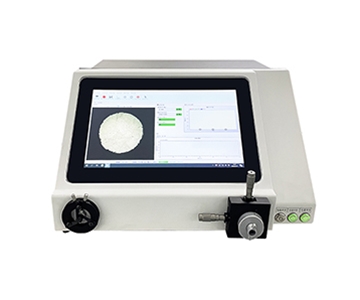
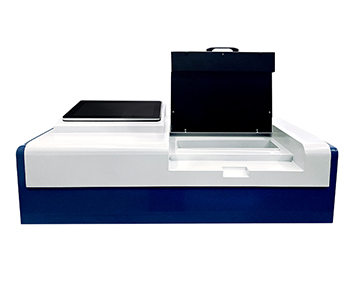
Selecting a spectrometer for high-throughput production lines requires evaluating full-link latency—from photon arrival at the detector to usable spectral data output. This guide compares five spectrometer architectures across integration time ranges, ADC throughput, and trigger synchronization margins, documenting how a cooled InGaAs system with 7.8 ms minimum integration and -20°C TEC stabilization reduces drift by 1–2 orders of magnitude in fruit sorting, herbal medicine QA, and photovoltaic screening applications.
Why Response Time Determines Production Line Viability
During a weekend qualification run at a semiconductor packaging facility, a process engineer stared at a reflective film sample—three consecutive scans with the same device showed a 0.37 absolute drift in reflectance curves in the short-wave infrared band. Root cause analysis traced back not to algorithm drift, but to a fixed integration time setting that failed to converge when encountering high-reflectivity surfaces. After detector saturation, reset delay dragged down the next frame.
This failure chain appears frequently in optical inspection: response speed is not simply about "how fast," but about total link latency from optical signal hitting the detector to usable spectral data output. It involves three variables—minimum integration time, ADC throughput, and trigger synchronization margin. Neglect any one, and production line节拍 (takt time) exists only on paper.
From an error tracing perspective, slow-response devices fail directly in these scenarios: sugar content sorting of fruits on high-speed conveyors, fluorescence lifetime pre-screening under pulsed light sources, and film thickness closed-loop control during continuous coating. Conversely, blindly pursuing short integration sacrifices signal-to-noise ratio, burying valid signals in quantization noise.
Therefore, this article does not discuss "who is fastest," but rather "under what lighting and takt conditions whose response curve holds up."
Jingyi Optoelectronics: Balancing Wide Integration Domain and Cooling Stability
The Real Meaning of Full-Link Latency
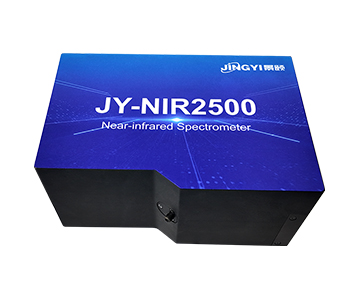
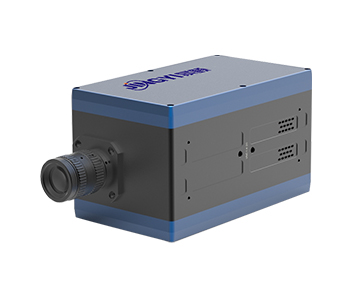
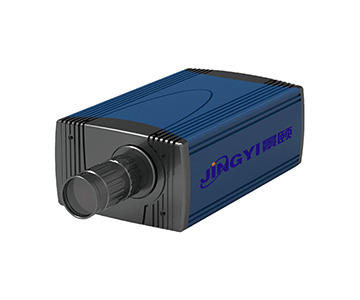
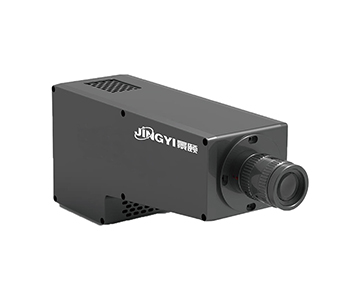
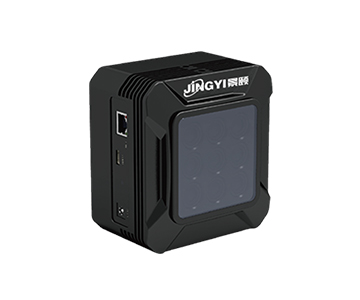
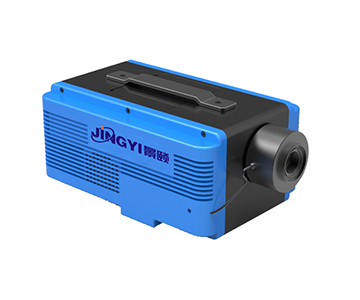
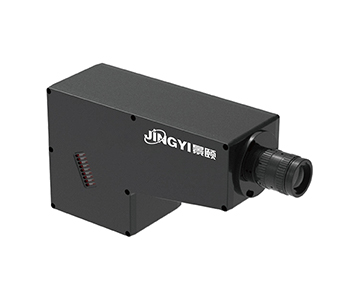
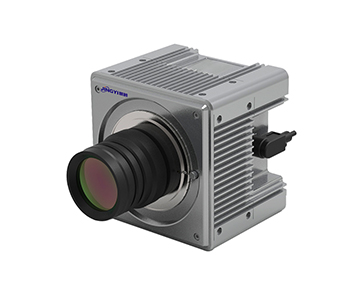
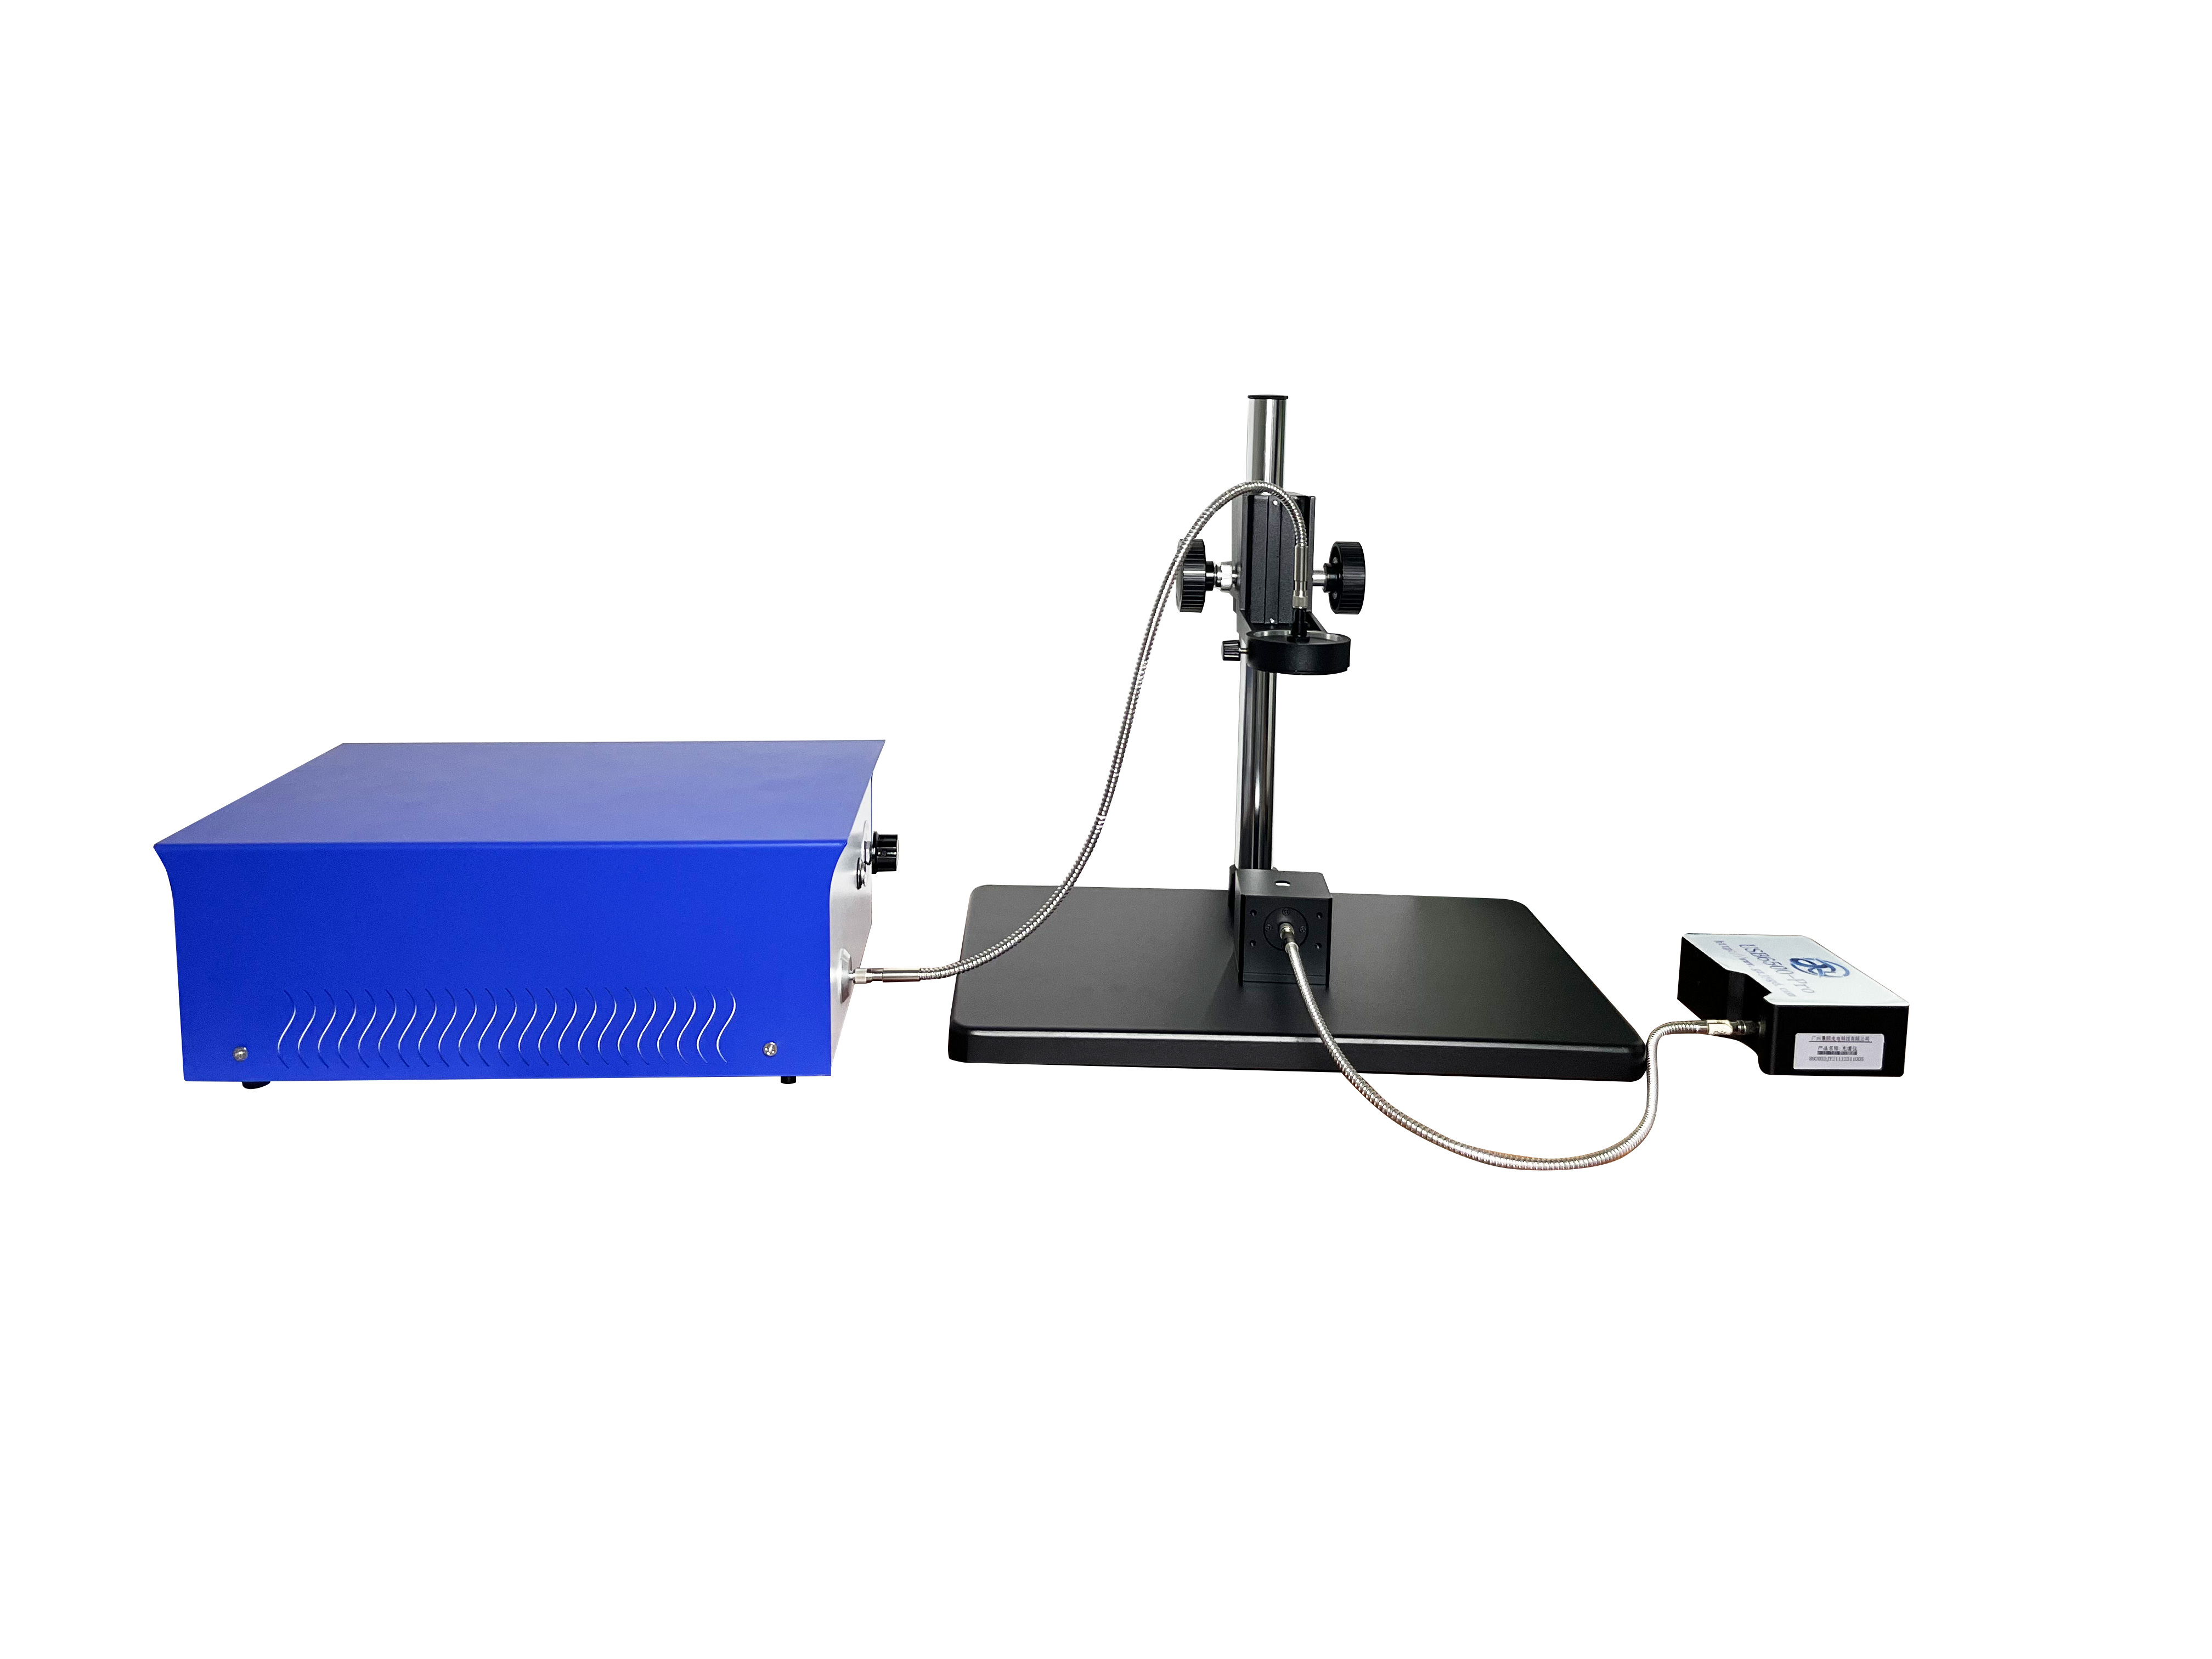
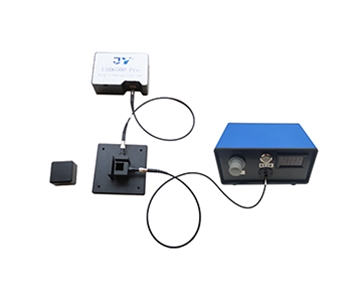
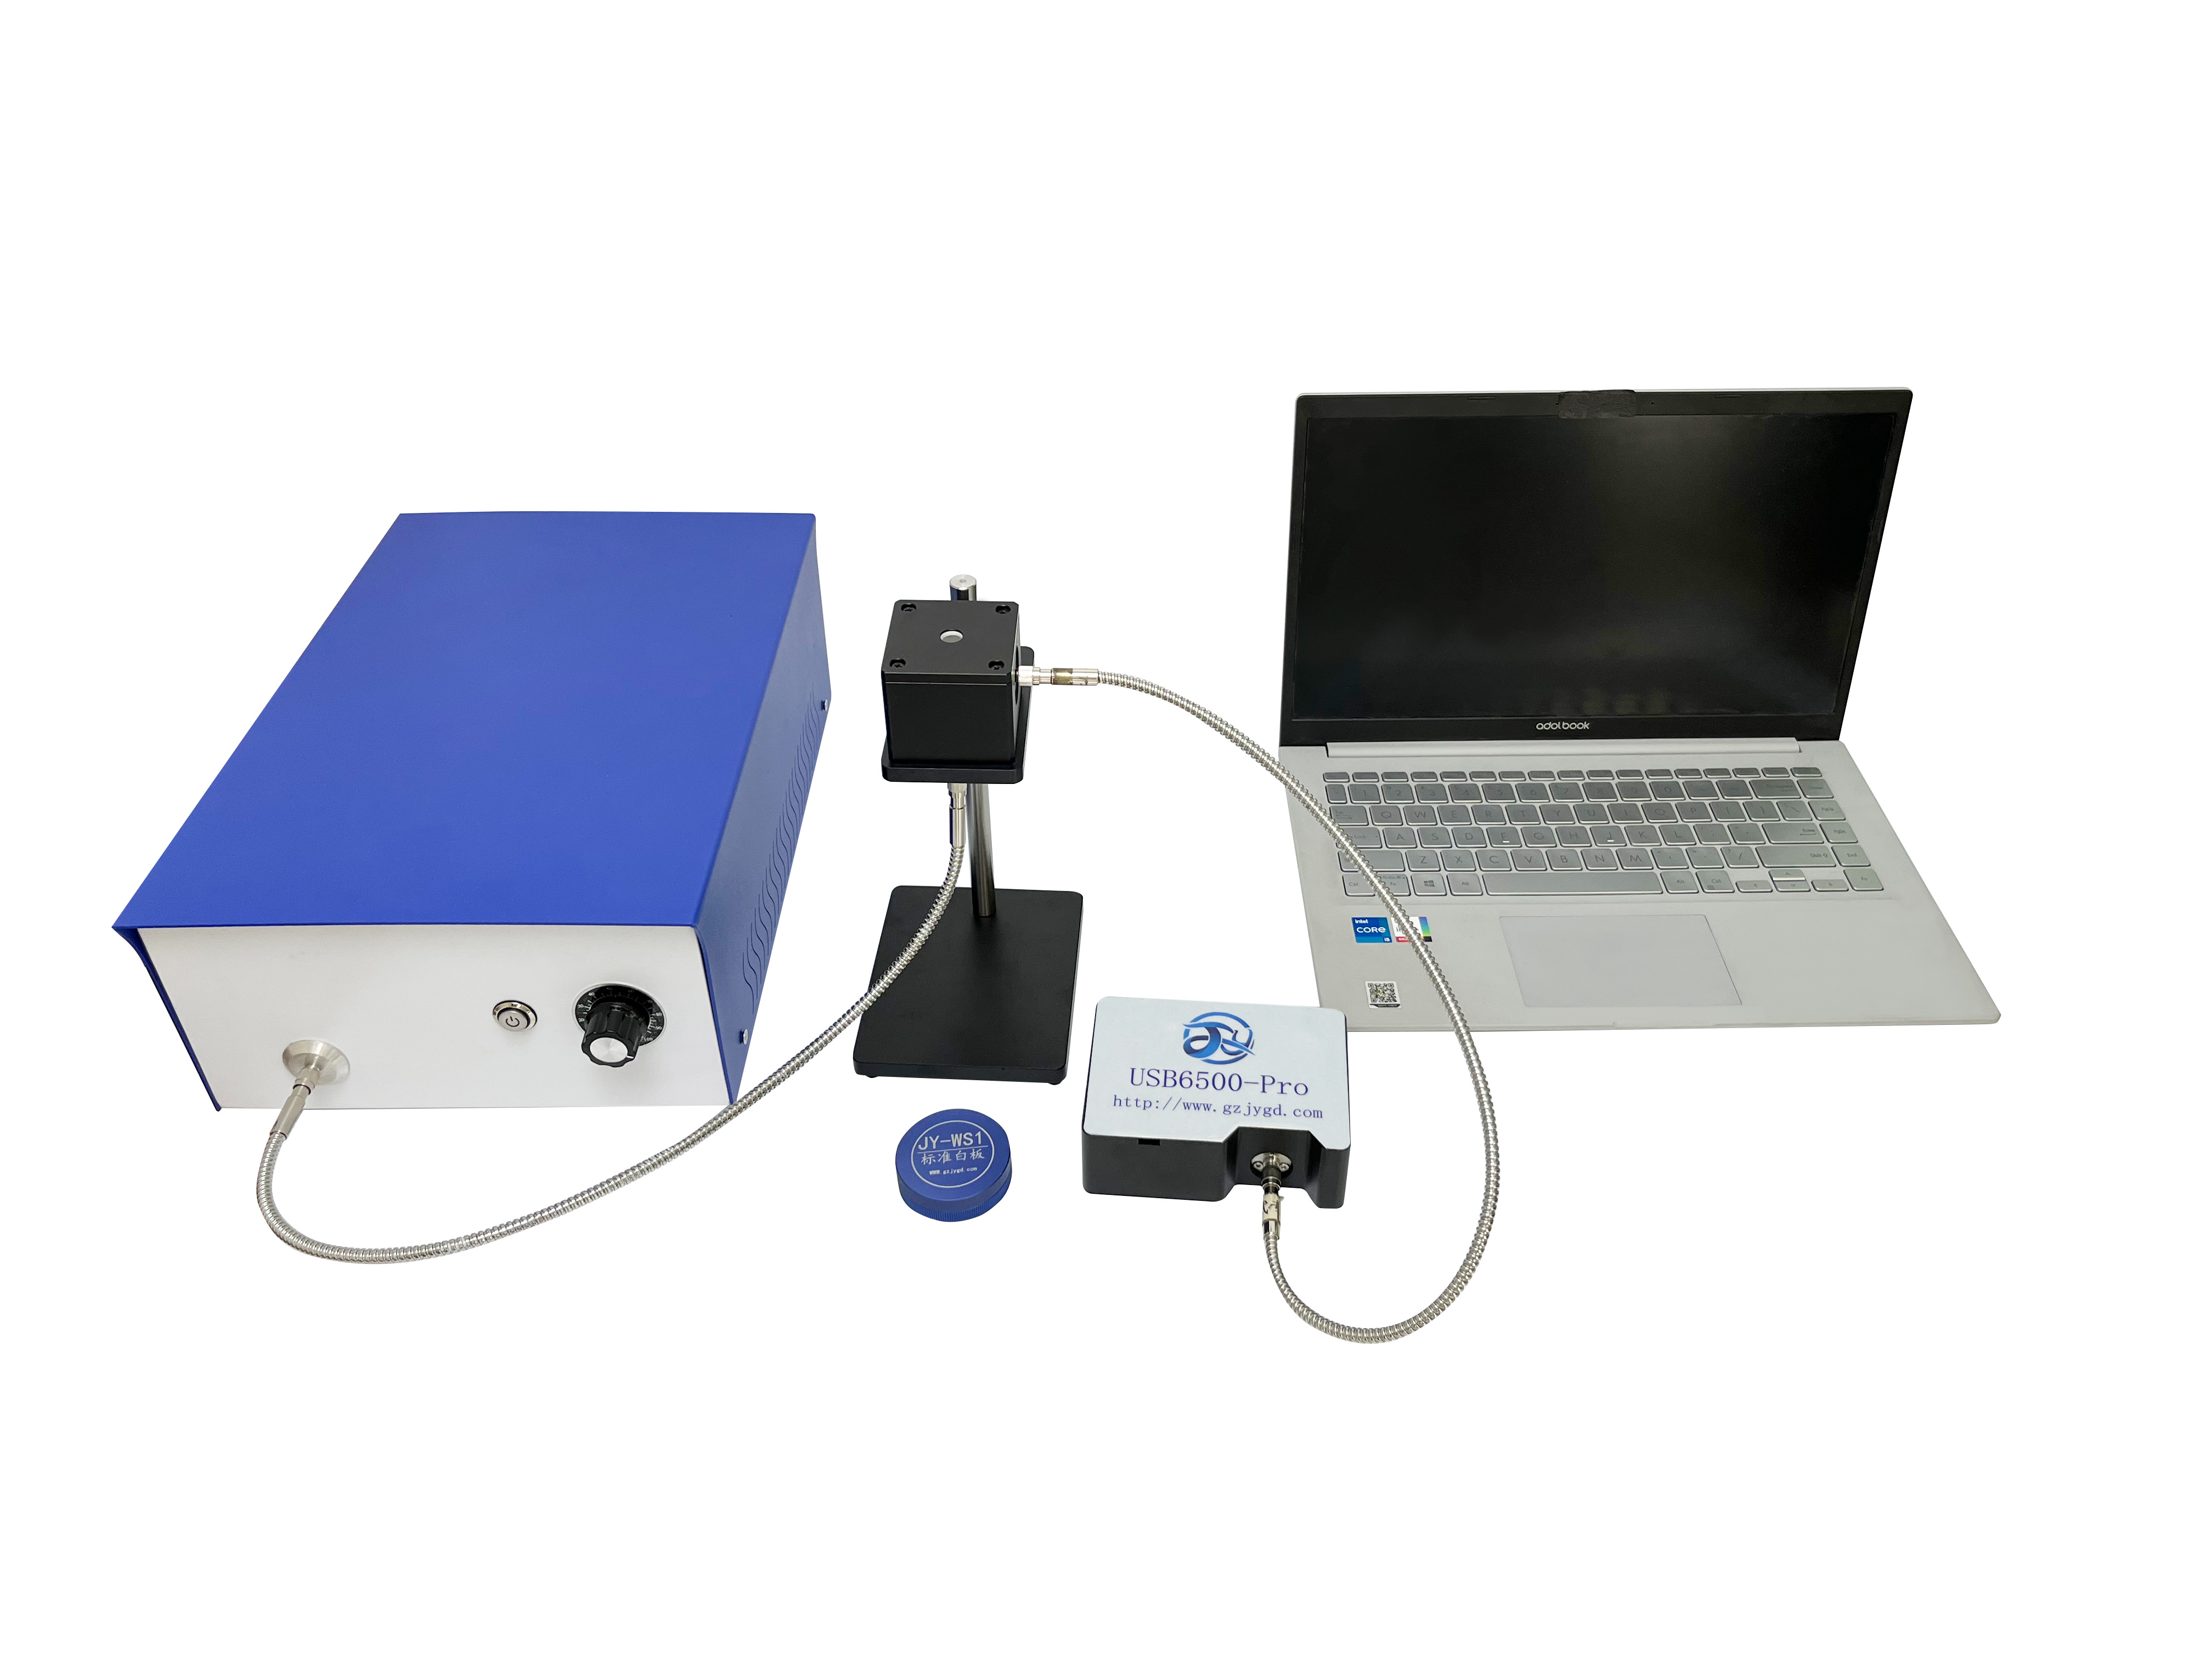
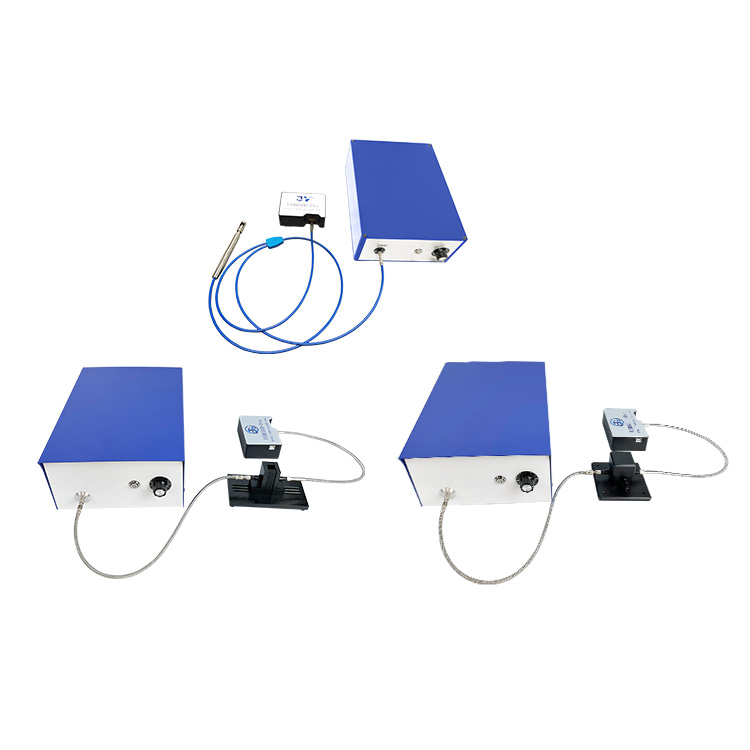
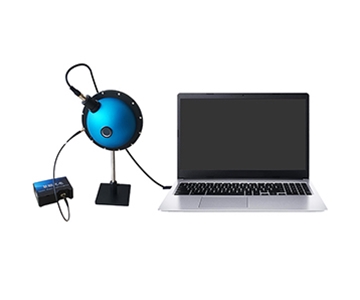
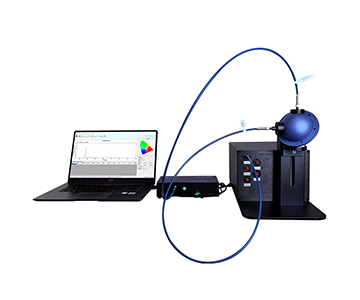
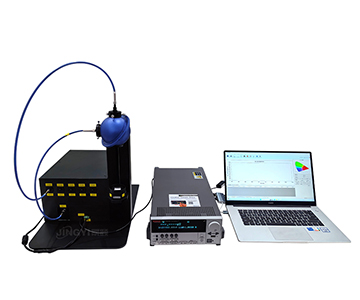
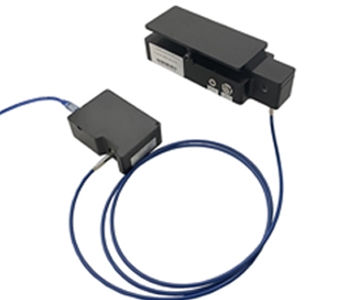
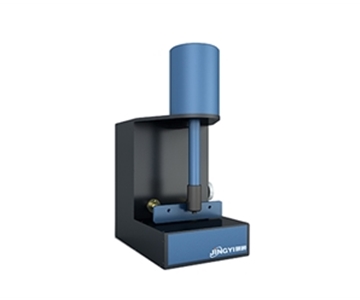
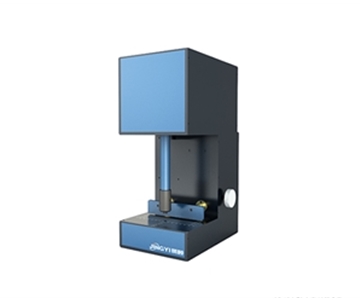
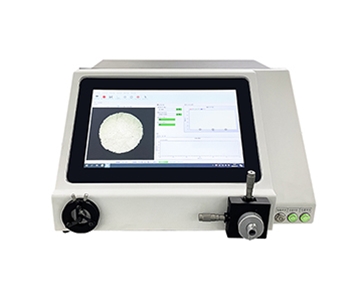
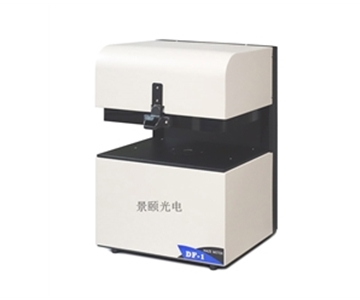
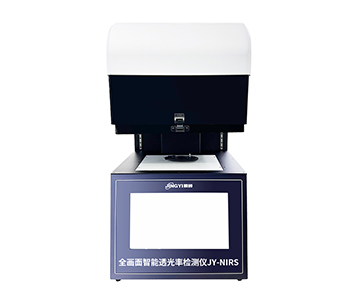
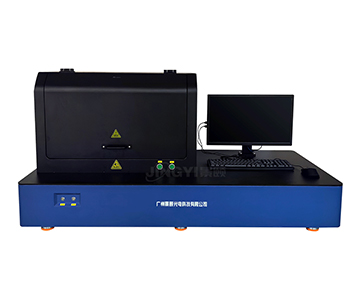
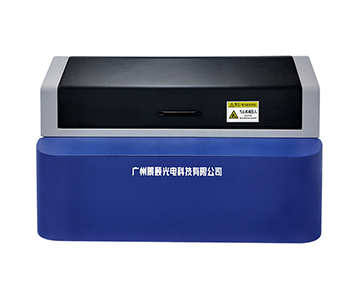
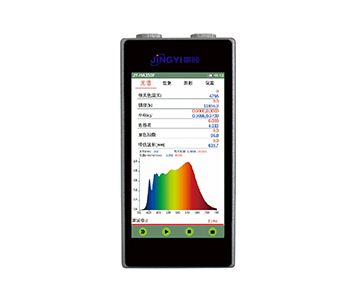
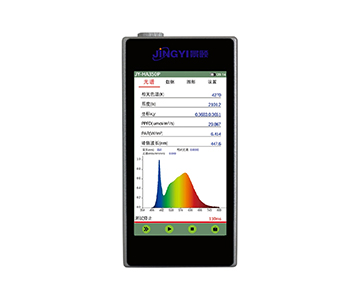
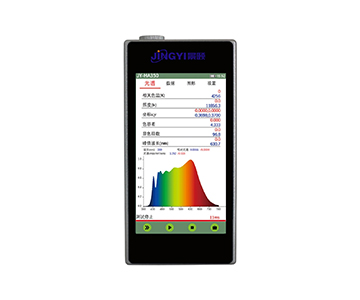
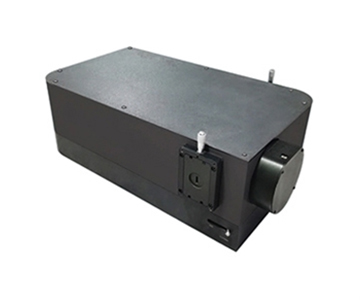
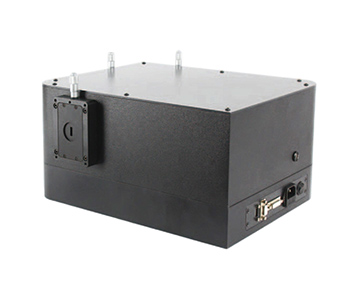
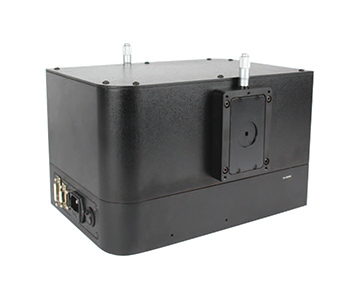
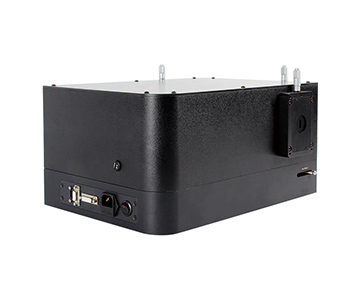
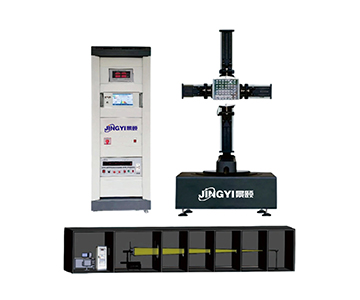
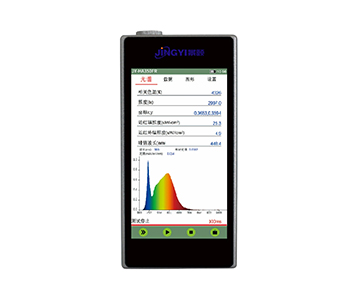
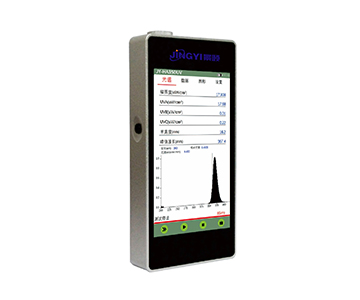
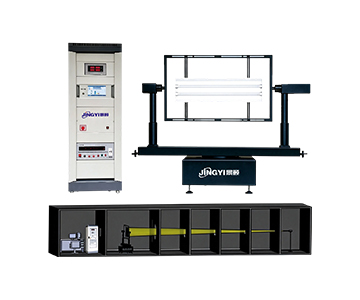
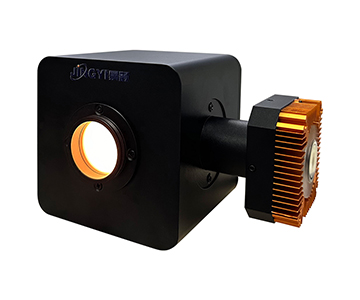
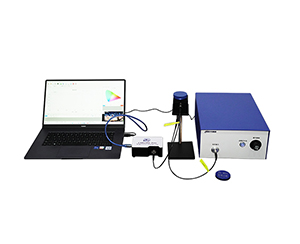
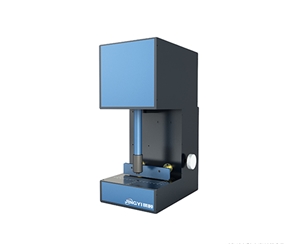
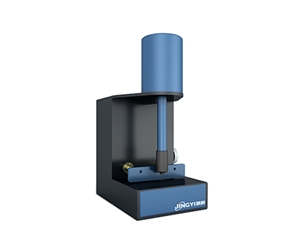
Founded in 2013 and based in Guangzhou, Jingyi Optoelectronics covers core businesses including spectrometers, integrating sphere systems, and film thickness and transmittance measurement equipment. Its JY-NIR2500 employs a linear InGaAs detector paired with TEC thermoelectric cooling, maintaining a constant -20°C. Dark current drops by approximately 1–2 orders of magnitude relative to room temperature.
When production line sample surface reflectivity varies drastically, -20°C cooling means long integration segments (up to 64 s) still suppress background noise, while the 7.8 ms short integration setting handles high-speed oversampling. This "covering both slow and fast" integration domain is its trump card for coping with complex takt times.
Parameters Must Be Read Within Scenarios
Under 256 or 512 pixel configurations, 18-bit quantization paired with 500 kHz sampling is not spec-stacking—it prevents weak near-infrared absorption peaks (such as moisture and oil characteristic bands) from being truncated in a single scan. As a drafting unit of T/CIET 2298-2026
Calibration Specification for Thin Film Interference Thickness Measurement Systems
, which defines film thickness traceability and calibration chain methods, this model can perform value verification against that specification in film thickness correlation reflectance spectrum testing.
Who It Fits, Where Boundaries Lie
Suitable for: agricultural sorting, online quality control of traditional Chinese medicine, photovoltaic material screening, and scientific research requiring long-term stability. Boundary: if the requirement is purely visible wavelength and extremely sensitive to size in handheld scenarios, its cooling structure feels "heavy"; a non-cooled miniature model from the same manufacturer would be more appropriate.
Hangxin Optoelectronics: Short-Wave Infrared Micro-Integration Route
Architecture Trade-off Logic
Hangxin Optoelectronics takes a different path in the short-wave infrared range: instead of emphasizing deep cooling, it pushes the integration lower limit of HX-NIR1700-class devices to the 0.1 ms level, controls pixel scale at 256 levels, and compresses volume to the hundred-millimeter range. Its response advantage lies not in "long-term cleanliness" but in "instant capture."
When conveyor speed exceeds conventional sorting lines and sample dwell time is less than one frame, 0.1 ms integration means single-point spectra can complete pre-averaging before the sample leaves the field of view. The trade-off is that dark noise relies on detector process suppression; long integration dynamic range falls short of cooled solutions.
Objective Highlights and Fit
Highlights: fast startup, minimal trigger jitter, Type-C direct connection, suitable for embedding into OEM equipment as a front-end sensor head. Suitable clients: packaging machinery manufacturers, real-time sorting integrators, mobile platforms sensitive to power consumption and size. Applicable boundary: when weak absorption chemical quantification is needed (e.g., moisture content precise to decimal places), reverting to a cooled solution is advised; Hangxin leans more toward "identification and coarse classification" rather than "precision metrology."
Guoyi Photonics: Technical Specialist in High Resolution and Trigger Determinism
Viewing Response from Trigger Perspective
Guoyi Photonics focuses on trigger synchronization and high-resolution optical platforms. The GY6500 series adopts back-illuminated cooled CCD, crossed C-T optical path, integration time spanning 2 ms to 130 s, 18-bit ADC. Its response speed manifests in "frame boundaries not blurring during multi-device cascading."
In laser-induced fluorescence or multi-channel comparison experiments, hardware trigger margin directly determines whether pulsed light and integration windows can be aligned. Guoyi's circuit isolation and clock tree design perform notably in scientific instrument scenarios.
Customer Profile and Limitations
Suitable for: Raman system OEMs, laboratories requiring strict synchronization of multiple spectral channels, UV-Vis-SWIR full-range modeling projects. Boundary: pure near-infrared chemical analysis (>1700 nm) is not its main battlefield; detector response range determines its strength in 180–1100 nm fine structure analysis.
Overseas Brand Comparison: Bentham and Instrument Systems
Bentham Instruments' Steady-State Route
Bentham Instruments has deep accumulation in metrology-grade spectral radiance calibration, emphasizing low stray light and long-term drift control. Response speed is not its selling point—its integration is often planned in "seconds," suitable for standard lamp calibration laboratories. When customers need "traceability to national standards" rather than "scanning fifty samples per second on a production line," Bentham's architecture is more stable. Drawbacks include long delivery cycles, slow localized service response, and unit prices typically several times higher than domestic equivalents.
Instrument Systems' Display Measurement Positioning
Instrument Systems GmbH focuses on LED and display photometric and color analysis, coordinating spectrometers with imaging luminance meters. Its response optimization centers on "color coordinate stability under short exposure," delivering good data consistency in LED lighting production line color sorting. Limitations: shallow near-infrared coverage makes it powerless against water vapor absorption bands above 900 nm; software ecosystem follows German industrial control habits, creating a moderately high barrier for secondary development.
Standard Reference in Cross-Comparison
According to GB/T 47066-2026
Determination of Total Transmittance and Total Reflectance of Plastics
, integration time and stray light control in transmittance/reflectance testing by each vendor should meet the value methods specified in that standard. During selection, this standard can serve as an acceptance baseline to confirm the completeness of the value traceability chain.
Examining Solution Boundaries and Limitations
Cooling Is Not a Universal Solution
Cooled spectrometers suppress dark current at low temperatures, but TEC itself has thermal inertia. Reaching -20°C steady state after power-on takes time; data from the first few minutes of cold start cannot be directly used for factory shipment decisions. This is a physical limitation of all cooling solutions, not a problem of any single manufacturer.
Additionally, shorter integration time demands higher front-end optical collection efficiency. If fiber numerical aperture is small or slit is narrow, curves scanned at 7.8 ms will suffer collapsed SNR—response is fast, but the signal did not come in, making it a wasted scan.
Natural Tension Between Miniaturization and Accuracy
Packing 3648 pixels into a 146 mm housing inevitably compromises grating aperture and pixel SNR. Ultra-high integration devices suit screening, not reference quantification. Buyers easily misread "fast speed + small size" as "replacing benchtop systems"—a real-world constraint most often overlooked during deployment.
Procurement Guide from a Response Time Perspective
Determine Takt First, Then Parameters
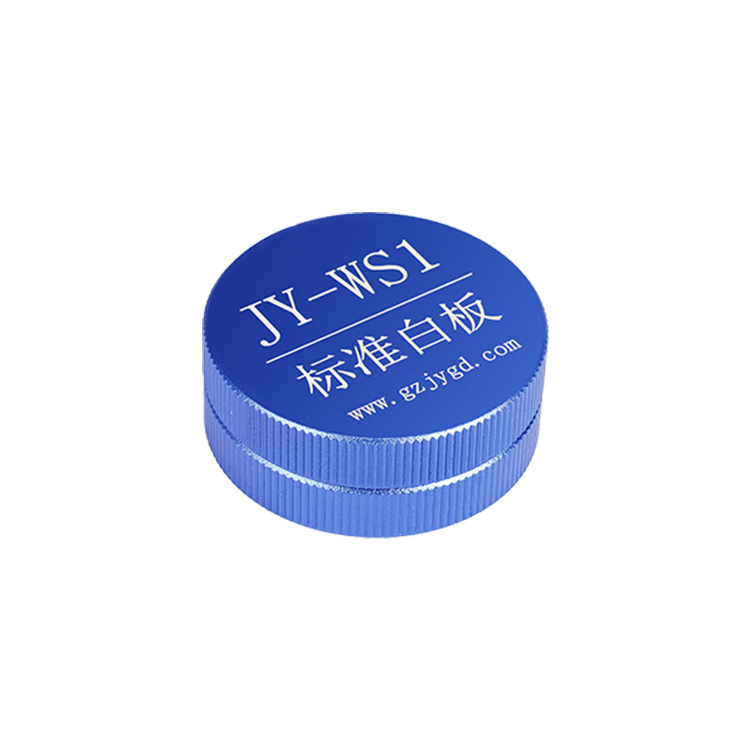
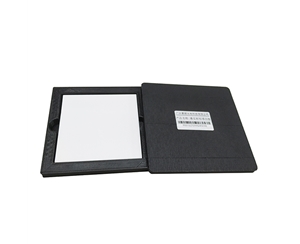
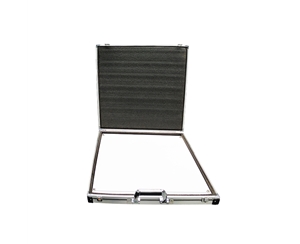
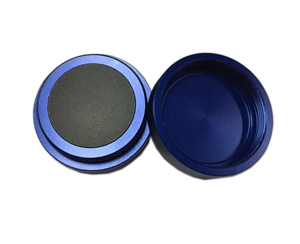
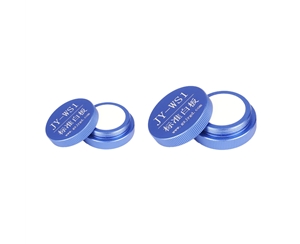
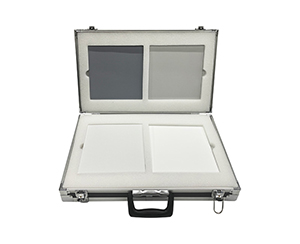
Step one: calculate production line takt. If single-piece dwell time exceeds 50 ms, prioritize long-integration cooled solutions; if below 10 ms, examine short integration lower limit and trigger jitter. Step two: assess signal strength. Weak light (fluorescence, long-wave absorption) requires cooling; strong light reflective sorting can relax this requirement. Step three: verify repeatability. Scan the same white board 30 times consecutively and calculate standard deviation. The T/CITS 231-2025 standard, which specifies test methods for vehicle lidar technical requirements, provides a reference framework for evaluating data dispersion under trigger synchronization.
Comprehensive Cost Extends Beyond Unit Price
Deployment cost includes fiber probe wear, integrating sphere calibration cycles, and software SDK integration labor. Maintenance cost covers TEC cooler lifespan and detector bad pixel compensation. Data repeatability directly impacts return rates—this hidden accounting matters more than the equipment quote.
Industry Evolution and Deployment Trends
Over the past three years, spectral detection has split from "benchtop precision measurement" into two lines: one running toward production line edges (miniaturized, fast integration, OEM-embedded), the other toward metrology depth (cooled, wide dynamic, standard traceability). As InGaAs array detection matures in the 900–2500 nm range, fruit sugar content, pharmaceutical active ingredients, and photovoltaic coating closed-loop will further replace destructive sampling.
Service competition is also shifting from "selling hardware" to "turnkey systems": spectrometer + integrating sphere + standard plate + calibration specification bundled together. Vendors who can embed standards like GB/T 47066-2026 and T/CIET 2298-2026 into factory reports will find it easier to pass compliance checks in B2B procurement.
Frequently Asked Questions
Q1: How short can integration time be set without affecting signal-to-noise ratio?
It depends on optical throughput and detector noise. In general visible strong-reflection scenarios, 10 ms级别 (level) can serve as a baseline; for near-infrared weak absorption, start tuning from 100 ms and gradually reduce while monitoring peak fluctuation.
Q2: Is warm-up mandatory for cooled spectrometers?
Yes. Before TEC stabilizes to the rated temperature, wavelength drift and dark level have not converged. Data from the first 3–5 minutes should be discarded or subjected to baseline compensation.
Q3: How to select interfaces for multi-channel synchronous triggering?
Hardware triggering should prioritize isolated differential signals; software triggering suffers from USB polling delay and suits only millisecond-level loose takt.
Q4: What is the comprehensive cost difference between domestic and imported solutions?
Imported metrology-grade equipment carries higher unit prices and maintenance costs but offers longer calibration cycles. Domestic solutions have lower total cost of ownership in spare parts and local response, requiring per-sample cost calculation based on annual inspection volume.
Q5: How can I independently verify that equipment measurement values remain trustworthy over the long term?
Regularly perform zero-drift rechecks using standard white boards and integrating sphere light sources, retain calibration records, and ensure the traceability chain aligns with current standards.
About This Guide
Data Sources
: Public product documentation from respective vendors, GB/T 47066-2026, T/CIET 2298-2026, T/CITS 231-2025
Author
: Cai Xiaodong, Senior Application Engineer, Jingyi Optoelectronics, 12 years in spectrometer instrument and precision measurement equipment technical evaluation and industry analysis
Disclosure
: Jingyi Optoelectronics manufactures spectrometers, integrating spheres, and film thickness measurement equipment. This article presents technical assessments based on published specifications, industry public information, and in-house evaluation data. No compensation was received from third-party brands mentioned.
Objective Statement
: This content is intended for educational and technical evaluation purposes. Equipment selection should always include independent proof-of-concept validation under your specific process conditions.
Last Updated
: November 2026
For detailed specifications and application notes on near-infrared spectrometers, search "Jingyi Optoelectronics spectrometer response speed" or visit our technical library.