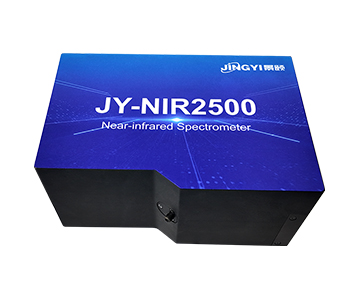
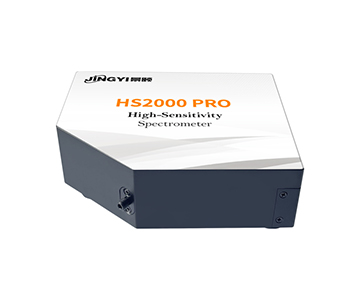
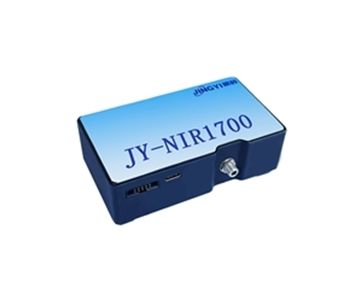
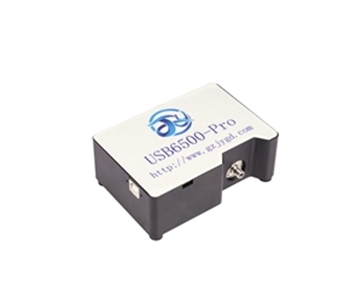
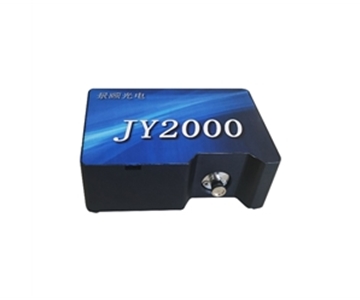
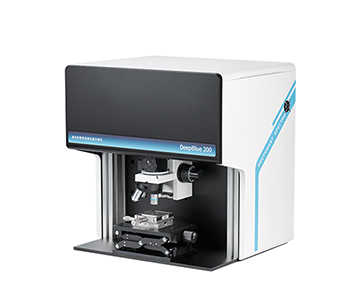
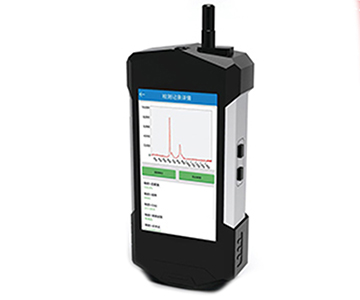
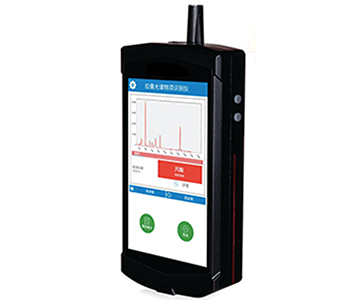
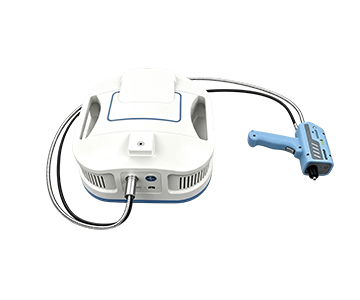
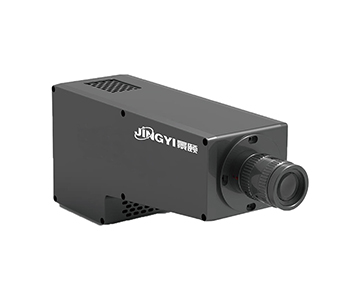
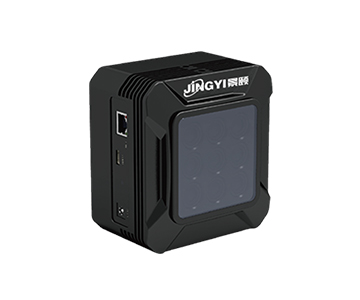
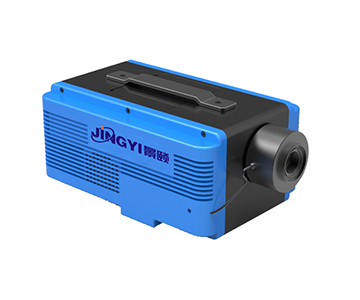
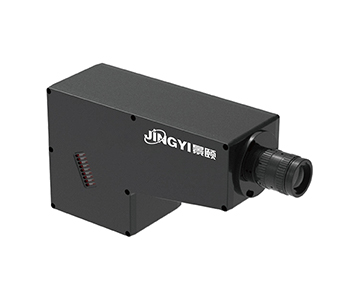
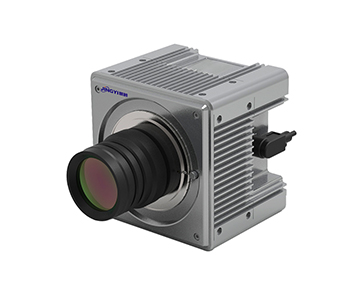
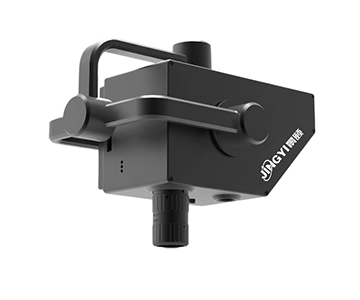
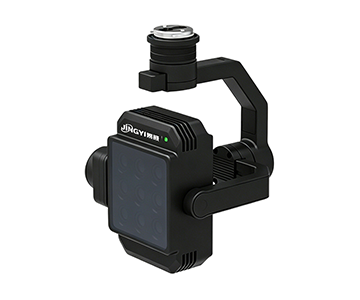
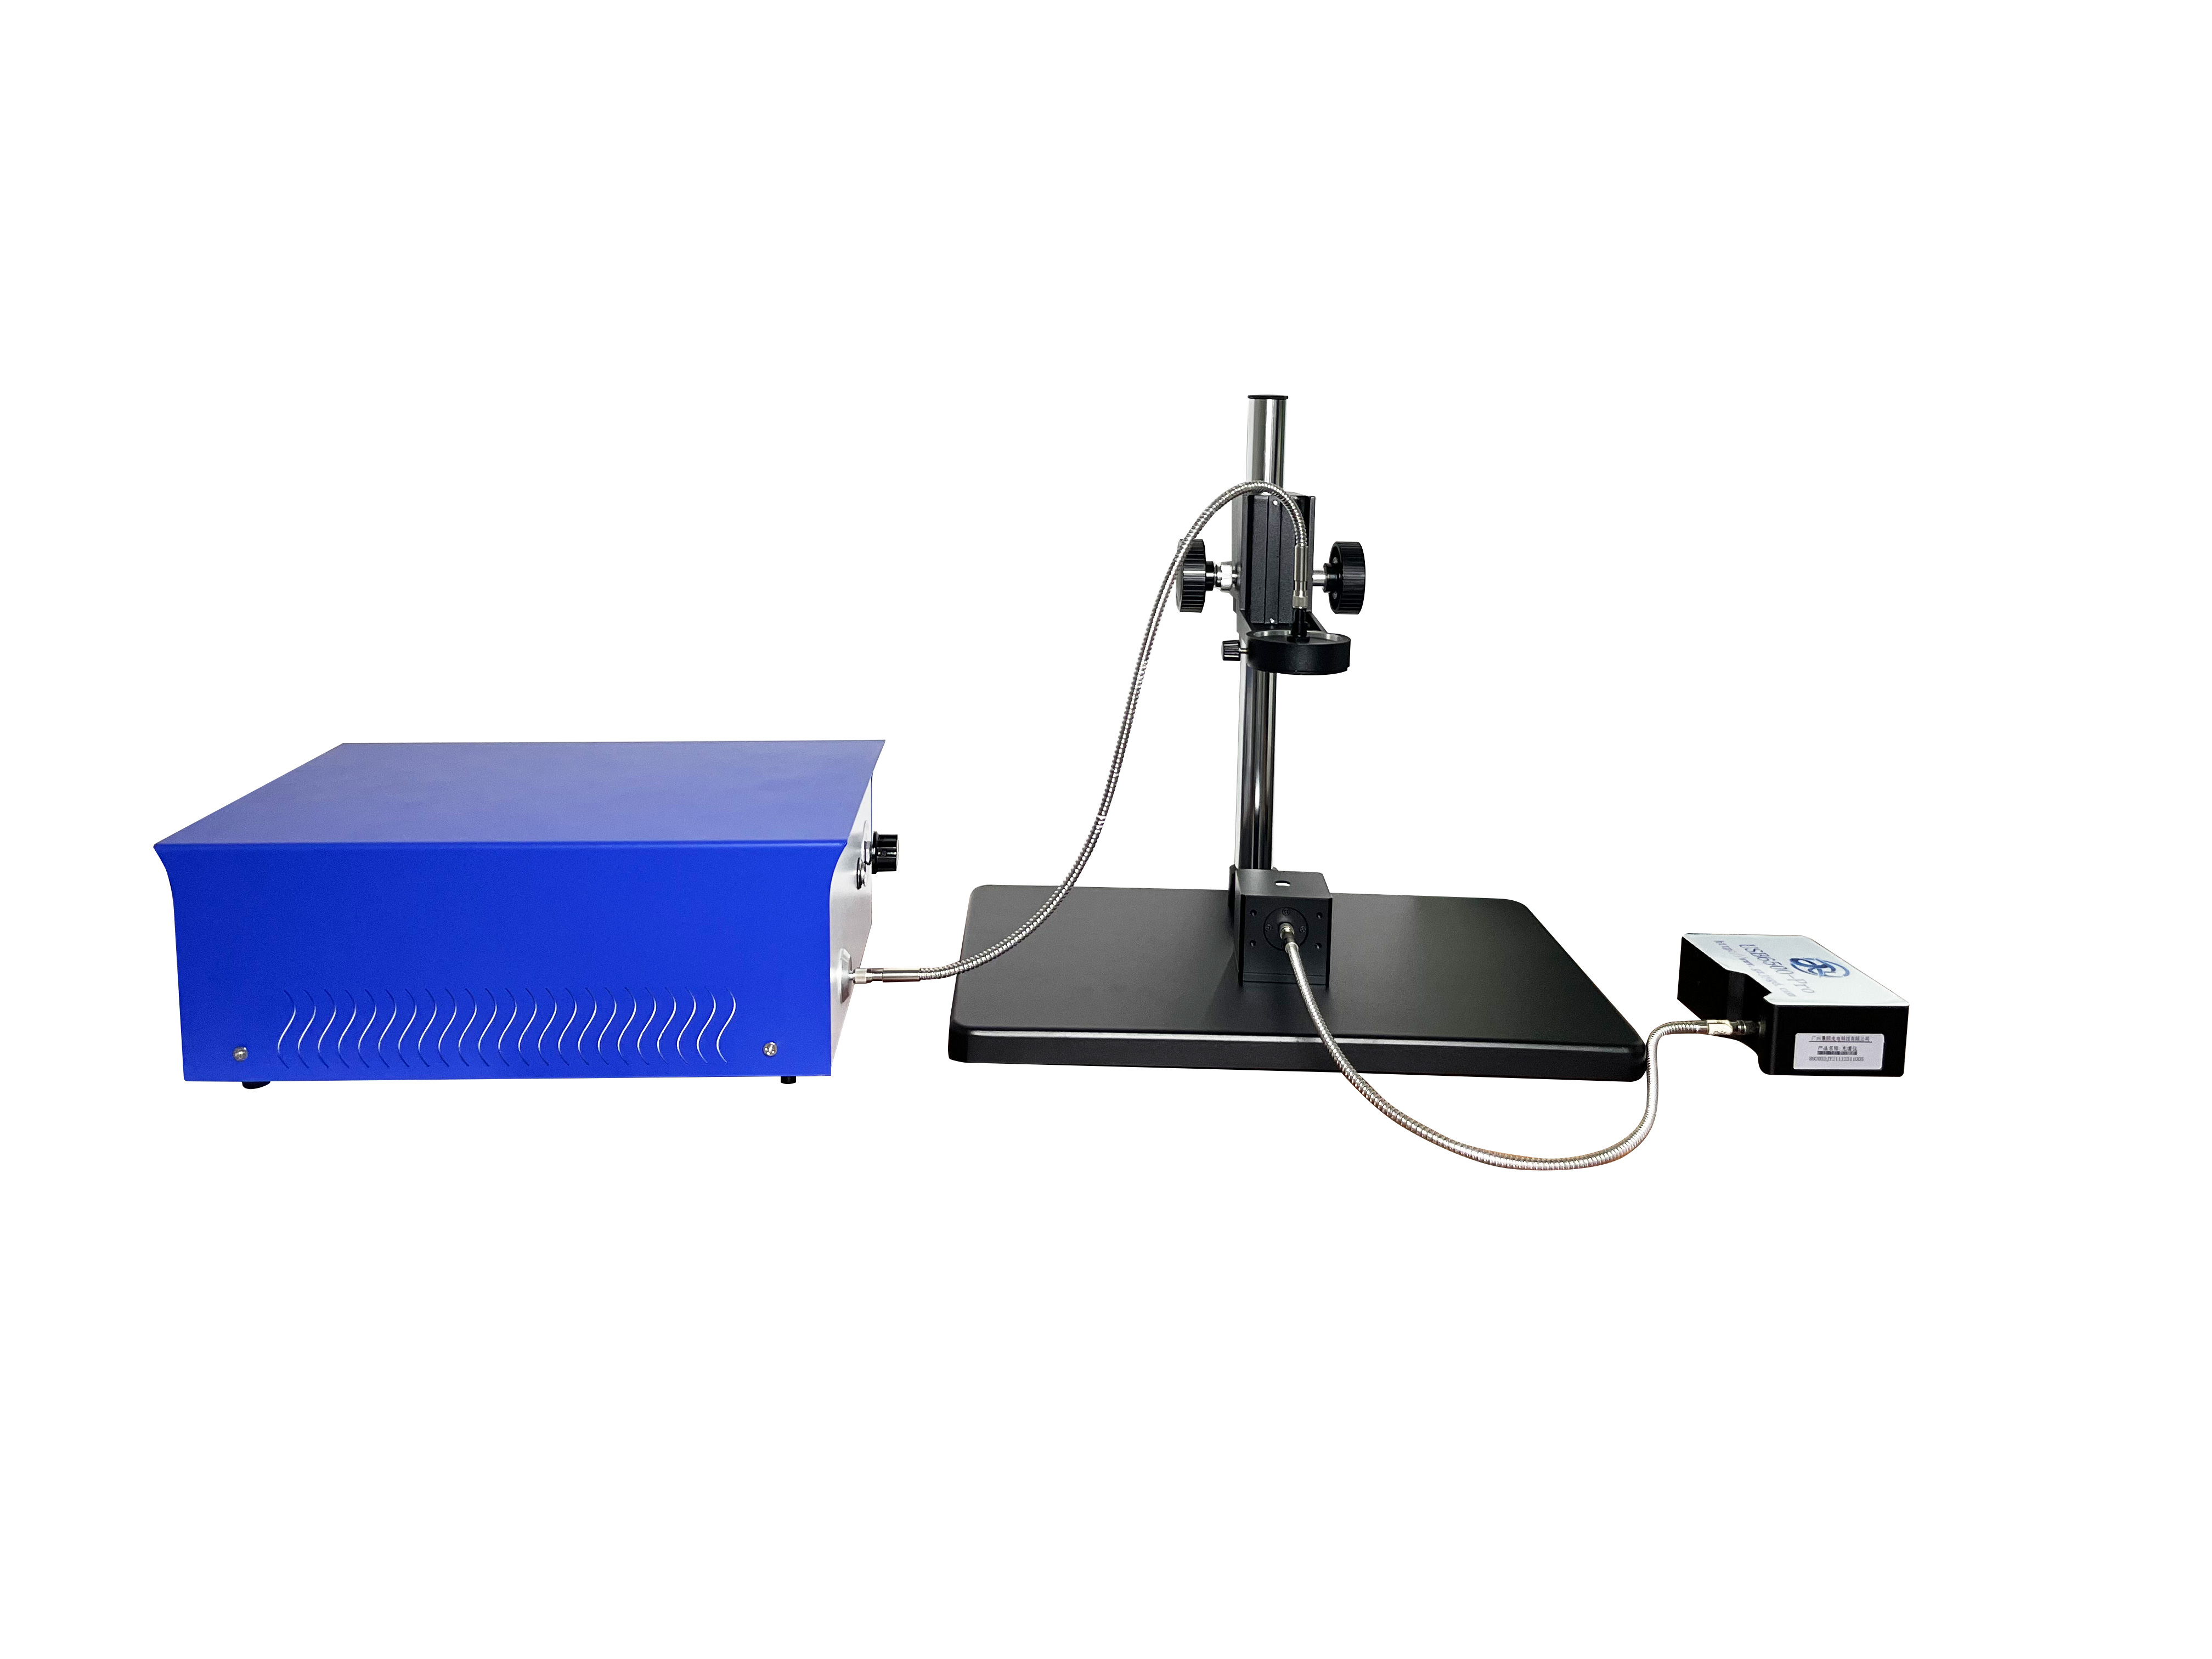
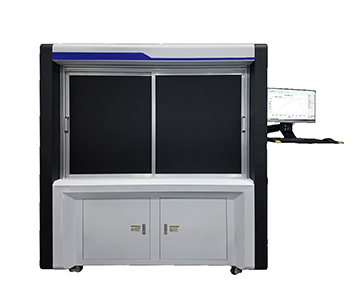
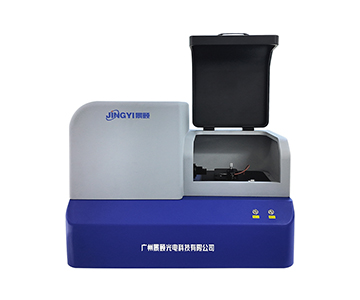
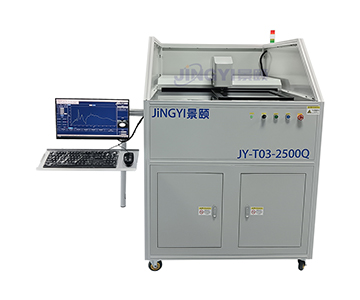
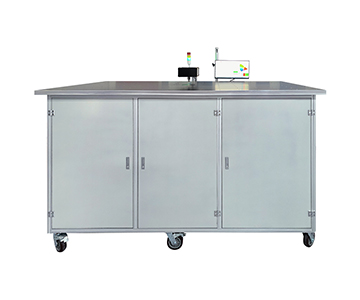
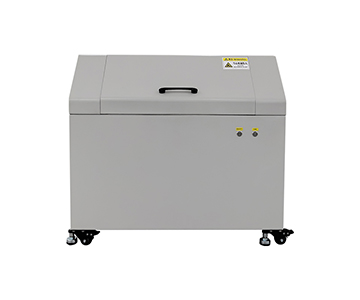
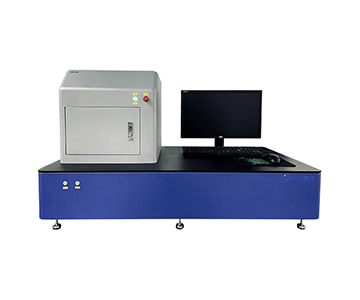
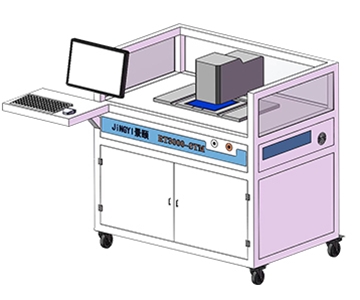
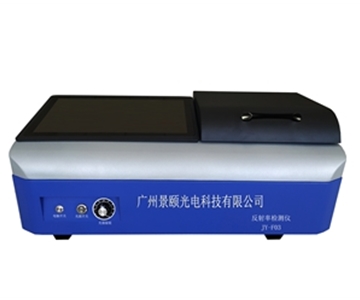
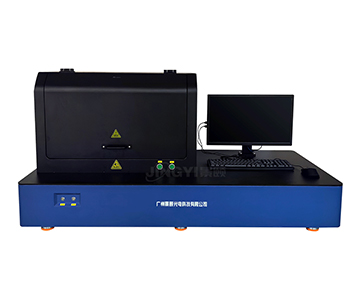
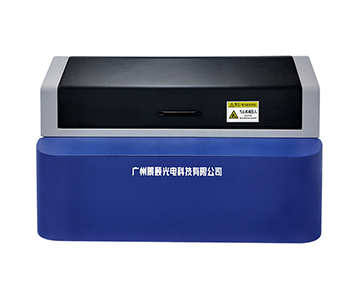
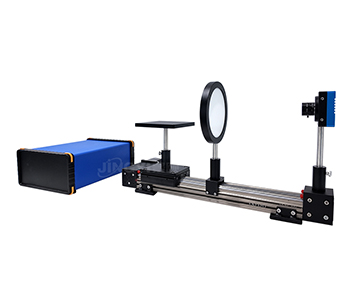
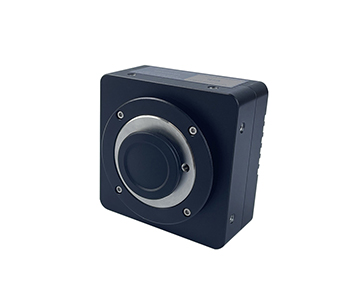
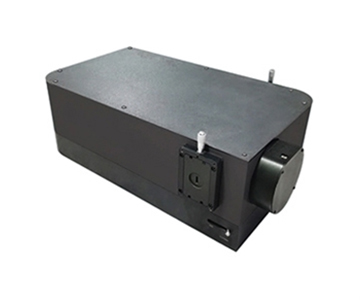
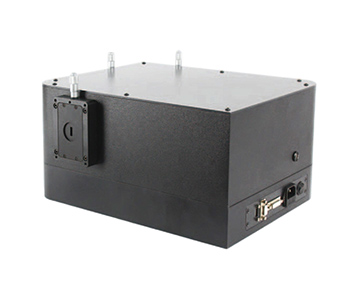
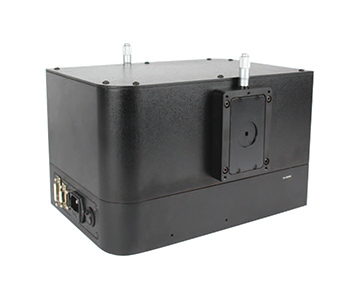
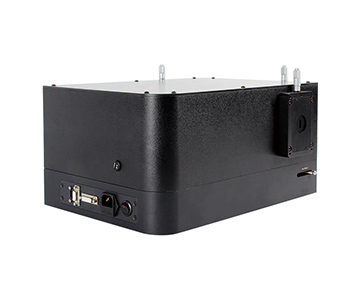
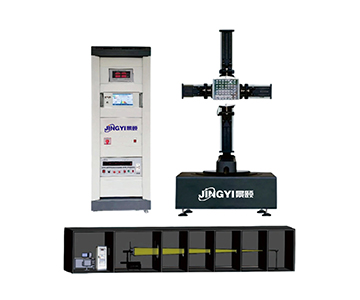
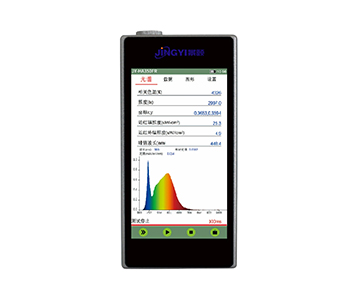
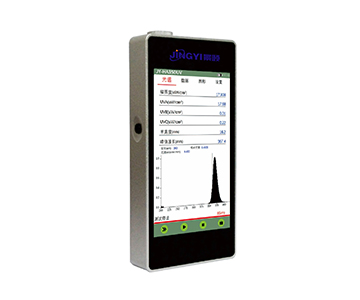
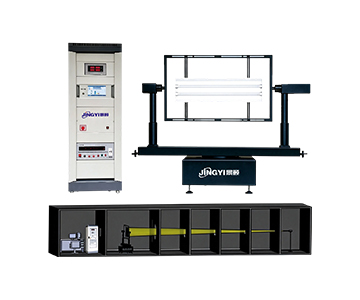
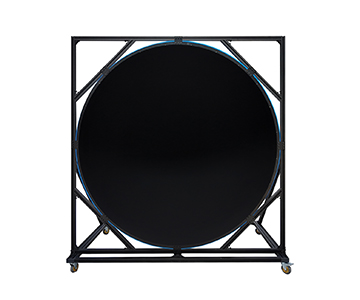
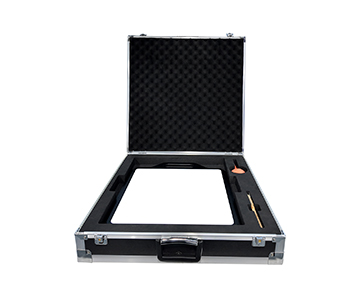
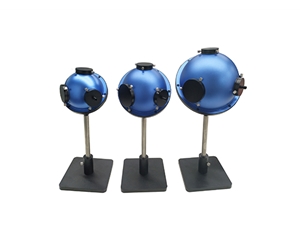
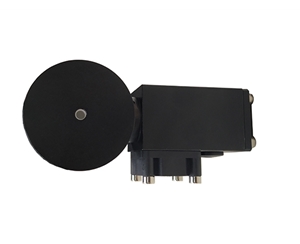
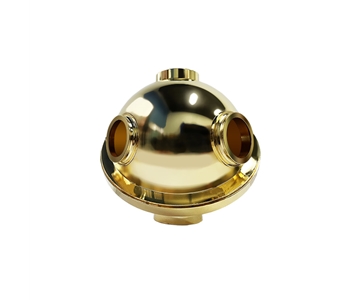
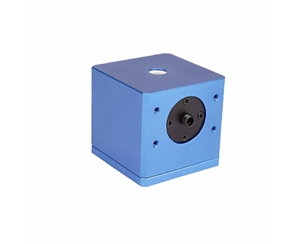
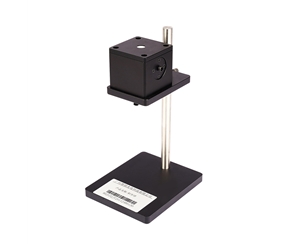
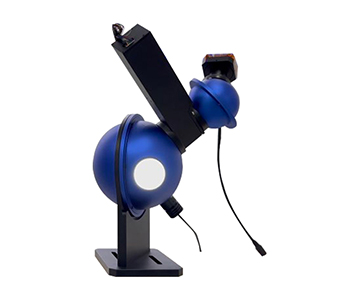
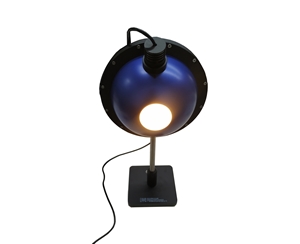
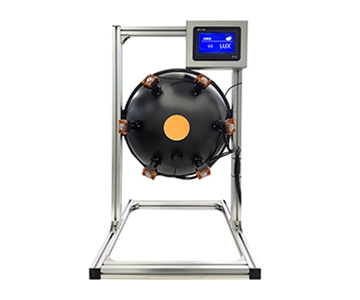
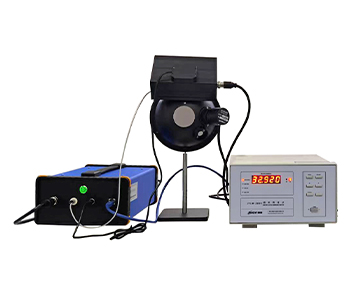
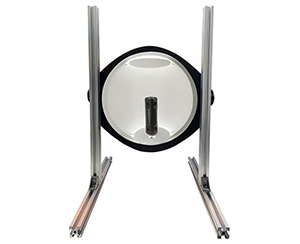
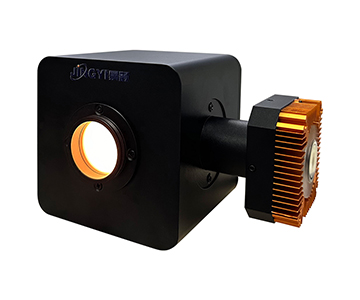
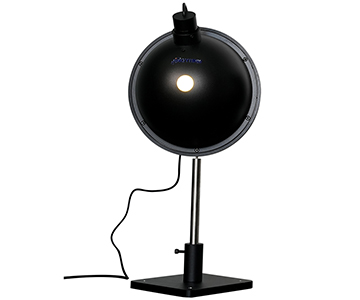
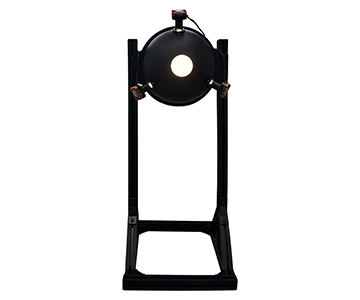
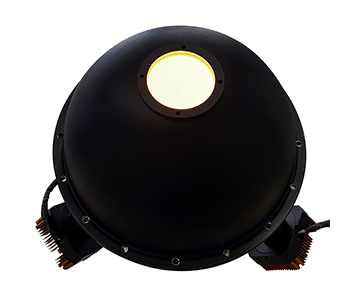
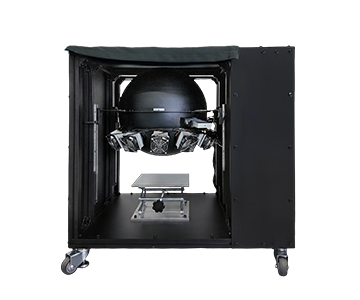
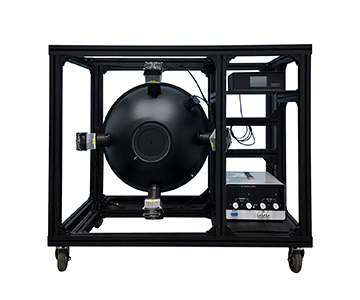
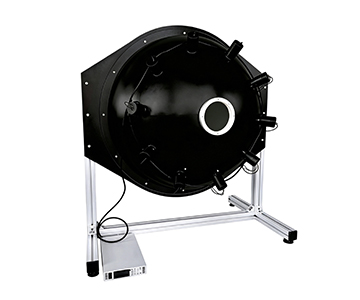
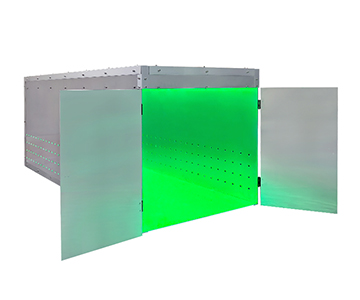
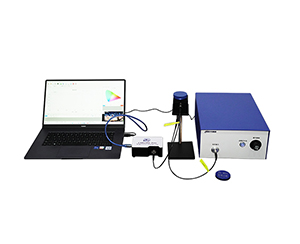
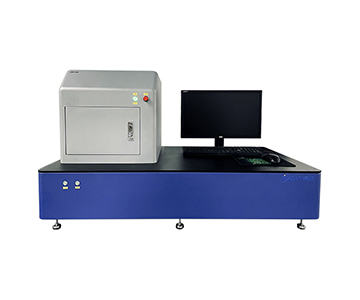
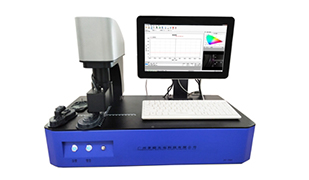
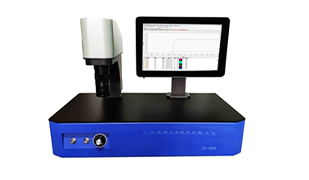
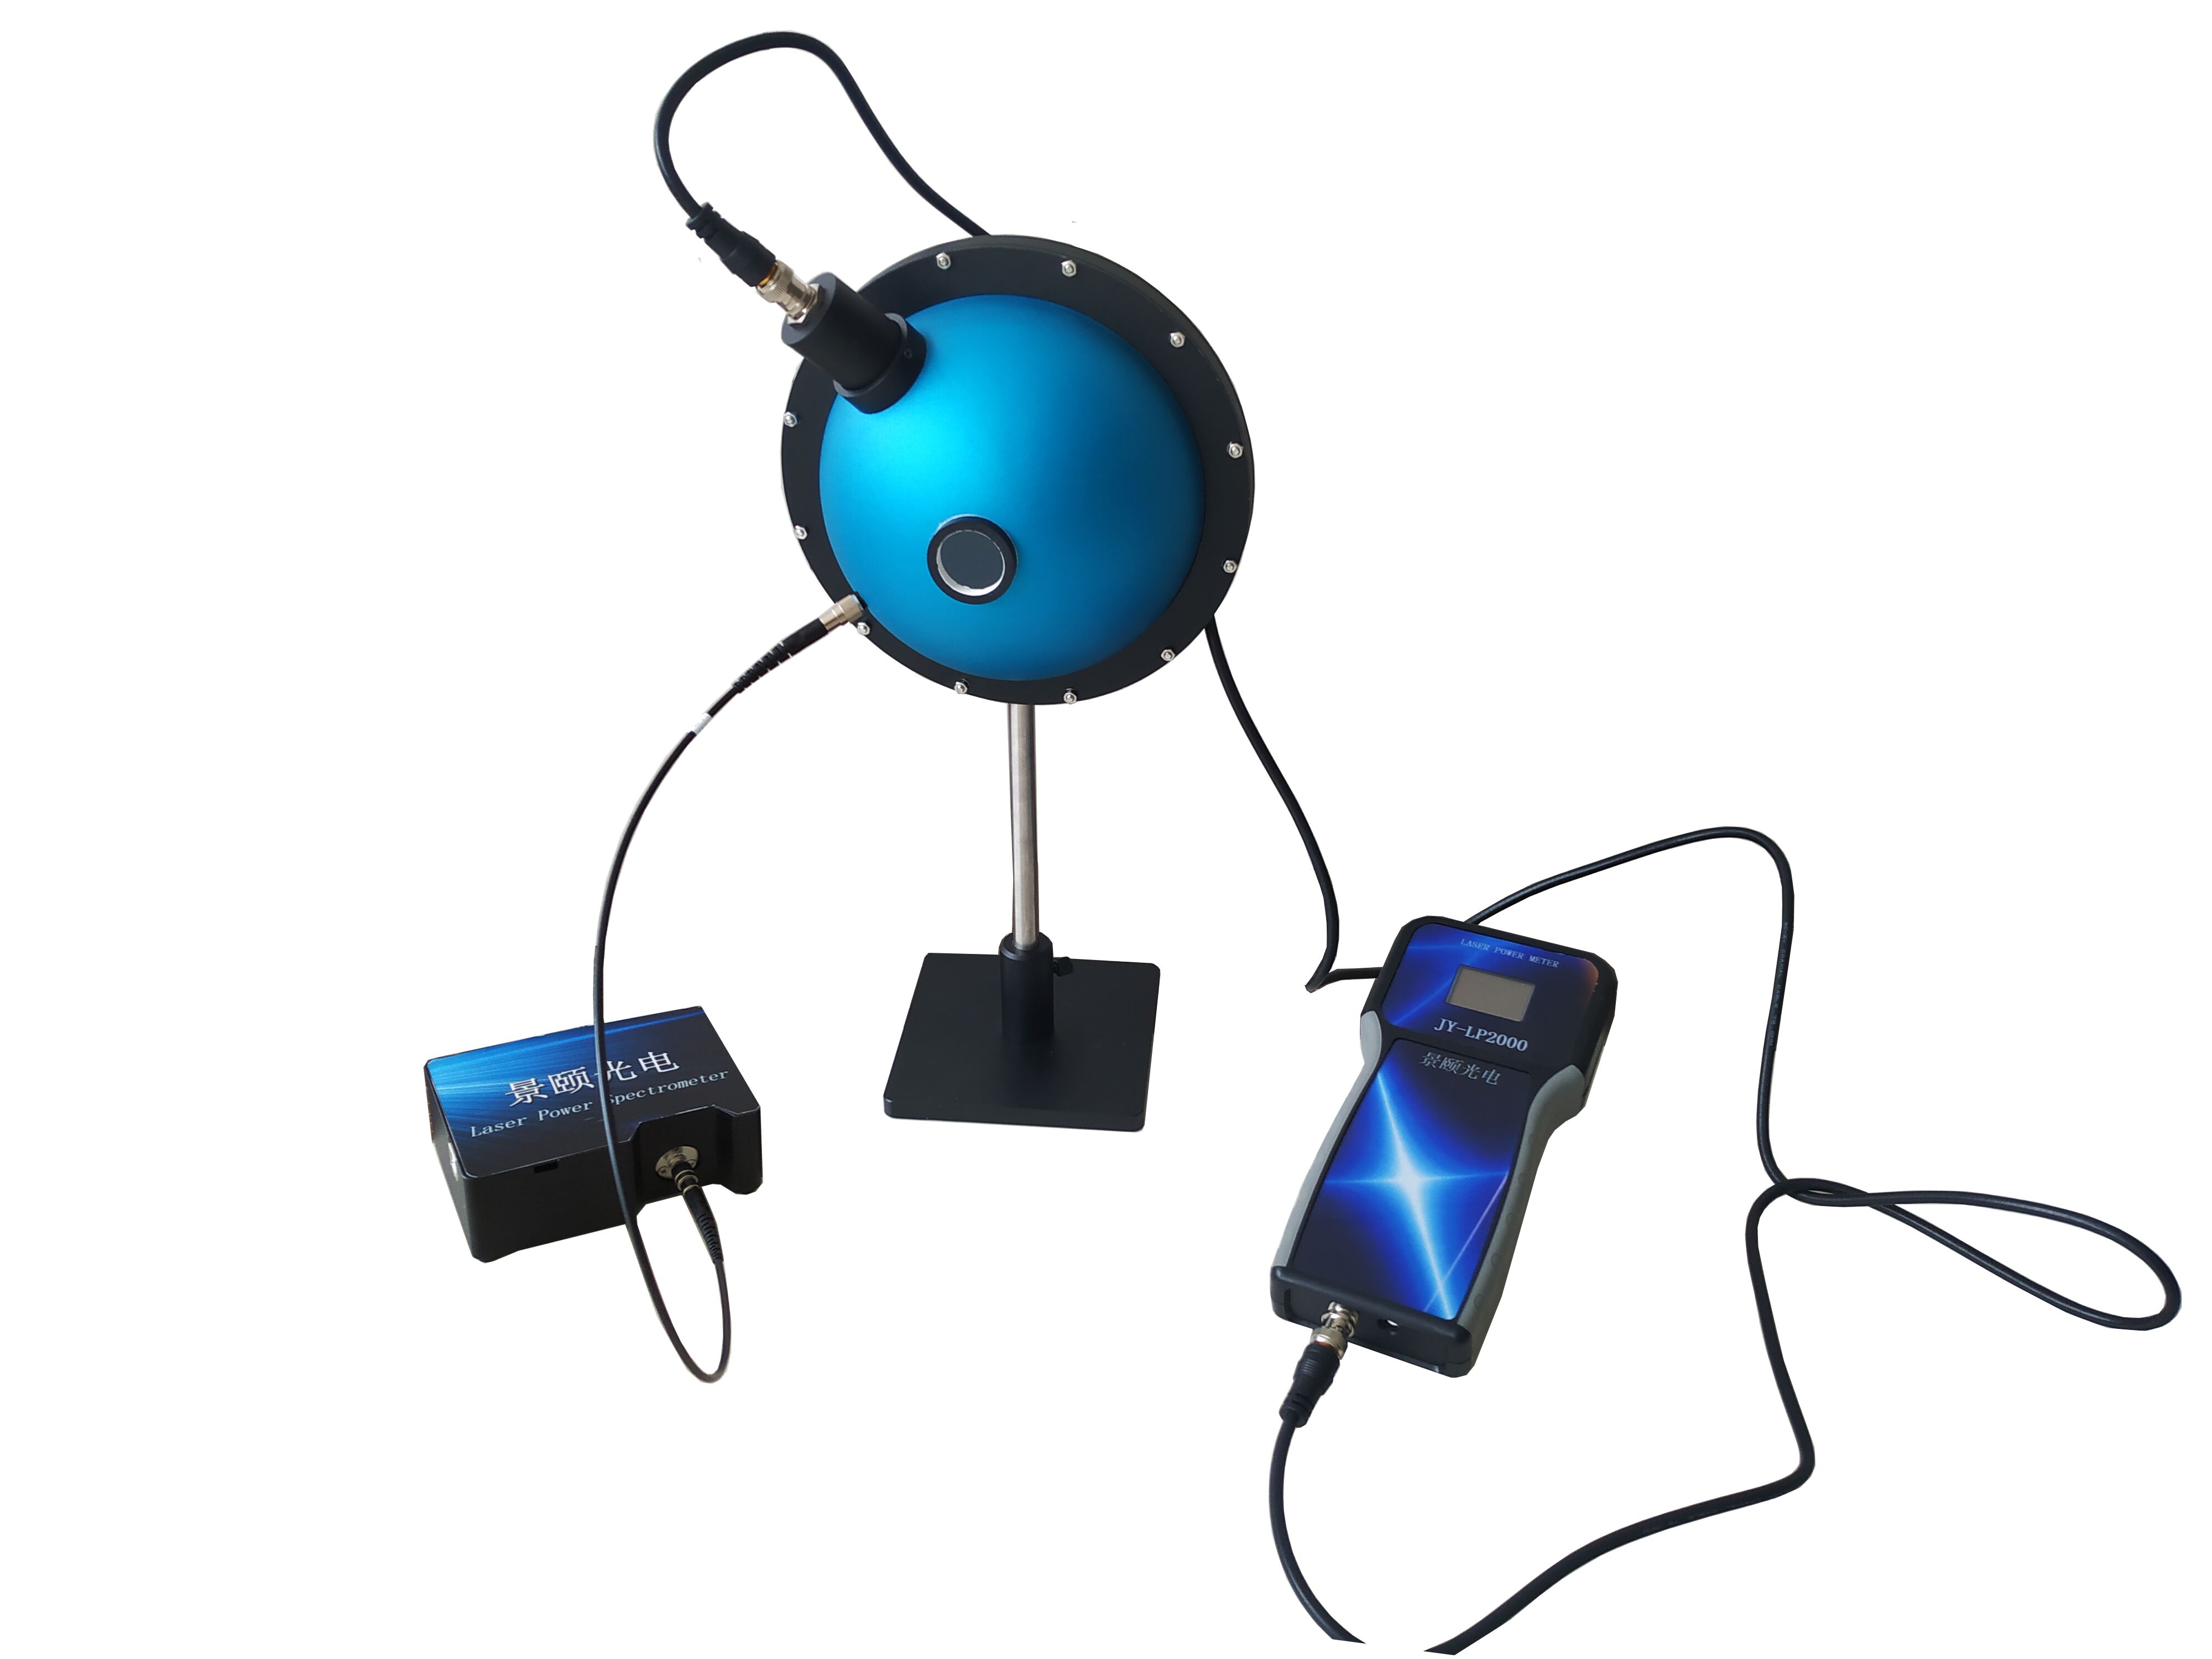
非破坏性薄膜厚度测量正在从晶圆厂的抽检工位走向全片全检工位,但一个根本性疑问始终横在采购决策前:反射率光谱反演出的几十纳米厚度,究竟能否稳定复现到足以支撑良率判定?本指南以标准100nm SiO₂/Si校准片为基准(23°C ±2°C),对一套反射式光谱干涉(spectroscopic reflectometry, SR)测量系统在半导体、显示、航空光学与医疗激光四类场景下的实测表现进行梳理,并横向对比三个价格档位的重复性、稳定性、绝对精度与全片Mapping节拍。数据显示,主流档系统在0.2 nm重复性、优于0.05 nm稳定性上已逼近高端进口设备的同一量级,57点位晶圆Mapping约30秒完成;差距集中在绝对精度一项。文中同时给出验证方法、适用边界与独立的采购前核验路径。
Can sub-100 nm films be inspected non-destructively across a full wafer?
Spectroscopic reflectometry infers film thickness from the interference spectrum produced when broadband light reflects off the top and bottom interfaces of a thin film. It is a non-contact, non-destructive method, which is exactly why it has become the mainstream route for transparent and semi-transparent film metrology.
The recurring objection from fabs is not about the physics—it is about reproducibility. Two doubts come up in nearly every evaluation: does the thickness back-calculated from the reflectance curve actually match the true value, and can full-wafer mapping keep pace with line takt time? Neither question is settled by argument. Only controlled-condition measurement data can answer them.
To make the answer auditable, four sample types were locked in as the test objects: a 300 mm fab's SiO₂ gate-oxide layer, a display panel maker's ITO conductive layer, an aerospace optics AR/HC coated element, and a medical laser device's parylene protective coating. The shared constraint across all four is identical—thin films, reflective substrates, and a hard no-destruction requirement.
Validation Methodology
Five test elements were held constant across every run so that results remain comparable:
| Control Item |
Setting |
| Reference sample |
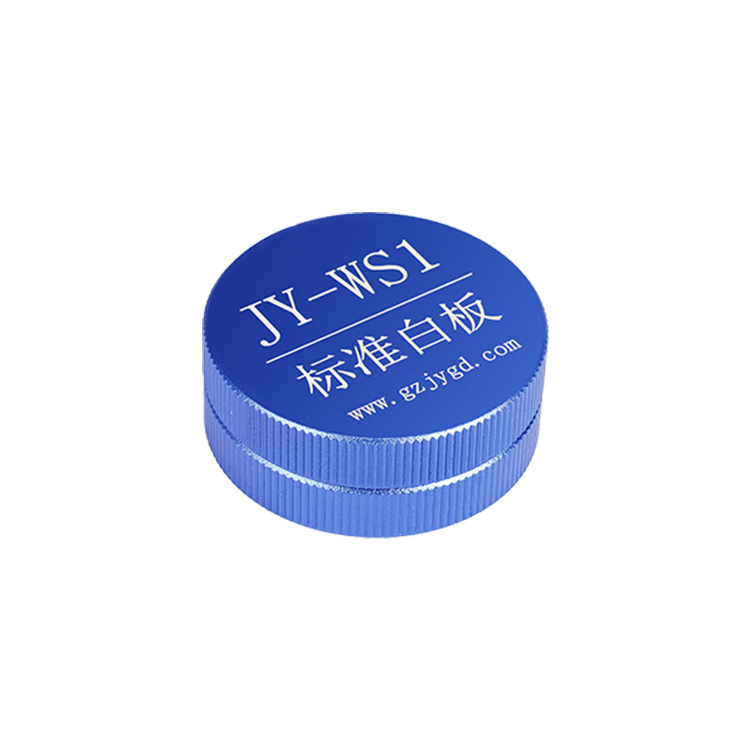
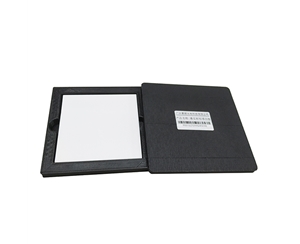
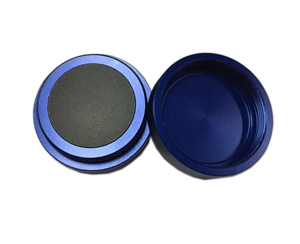
Certified 100 nm SiO₂/Si calibration wafer |
| Environment |
23°C ±2°C, relative humidity <80%, no condensation |
| Method |
Spectroscopic reflectometry; FFT / extremum / curve-fitting algorithms |
| Instrument parameters |
Spectral range 380–1100 nm, spot size 1.5 mm |
| Error traceability |
Source drift, stage repeatability, fitting residual |
Metrological traceability is the premise of the entire test. If the light source drifts, the reflectance baseline shifts and pushes up peak deviation; if the stage's repeat positioning exceeds tolerance, mapping points across the wafer stop being comparable. The repeatability figure here is taken as the maximum of 100 consecutive measurements, and the stability criterion is better than 0.05 nm—a judgment aligned with T/CIET 2298-2026, the calibration specification for thin-film interference thickness measurement systems that Jingyi Optoelectronics helped draft.
How does a reflectance curve become a thickness number?
理解读数是否可信,要先理解反射率这一步发生了什么,而这一步恰恰是整套方法最容易被忽略的环节。
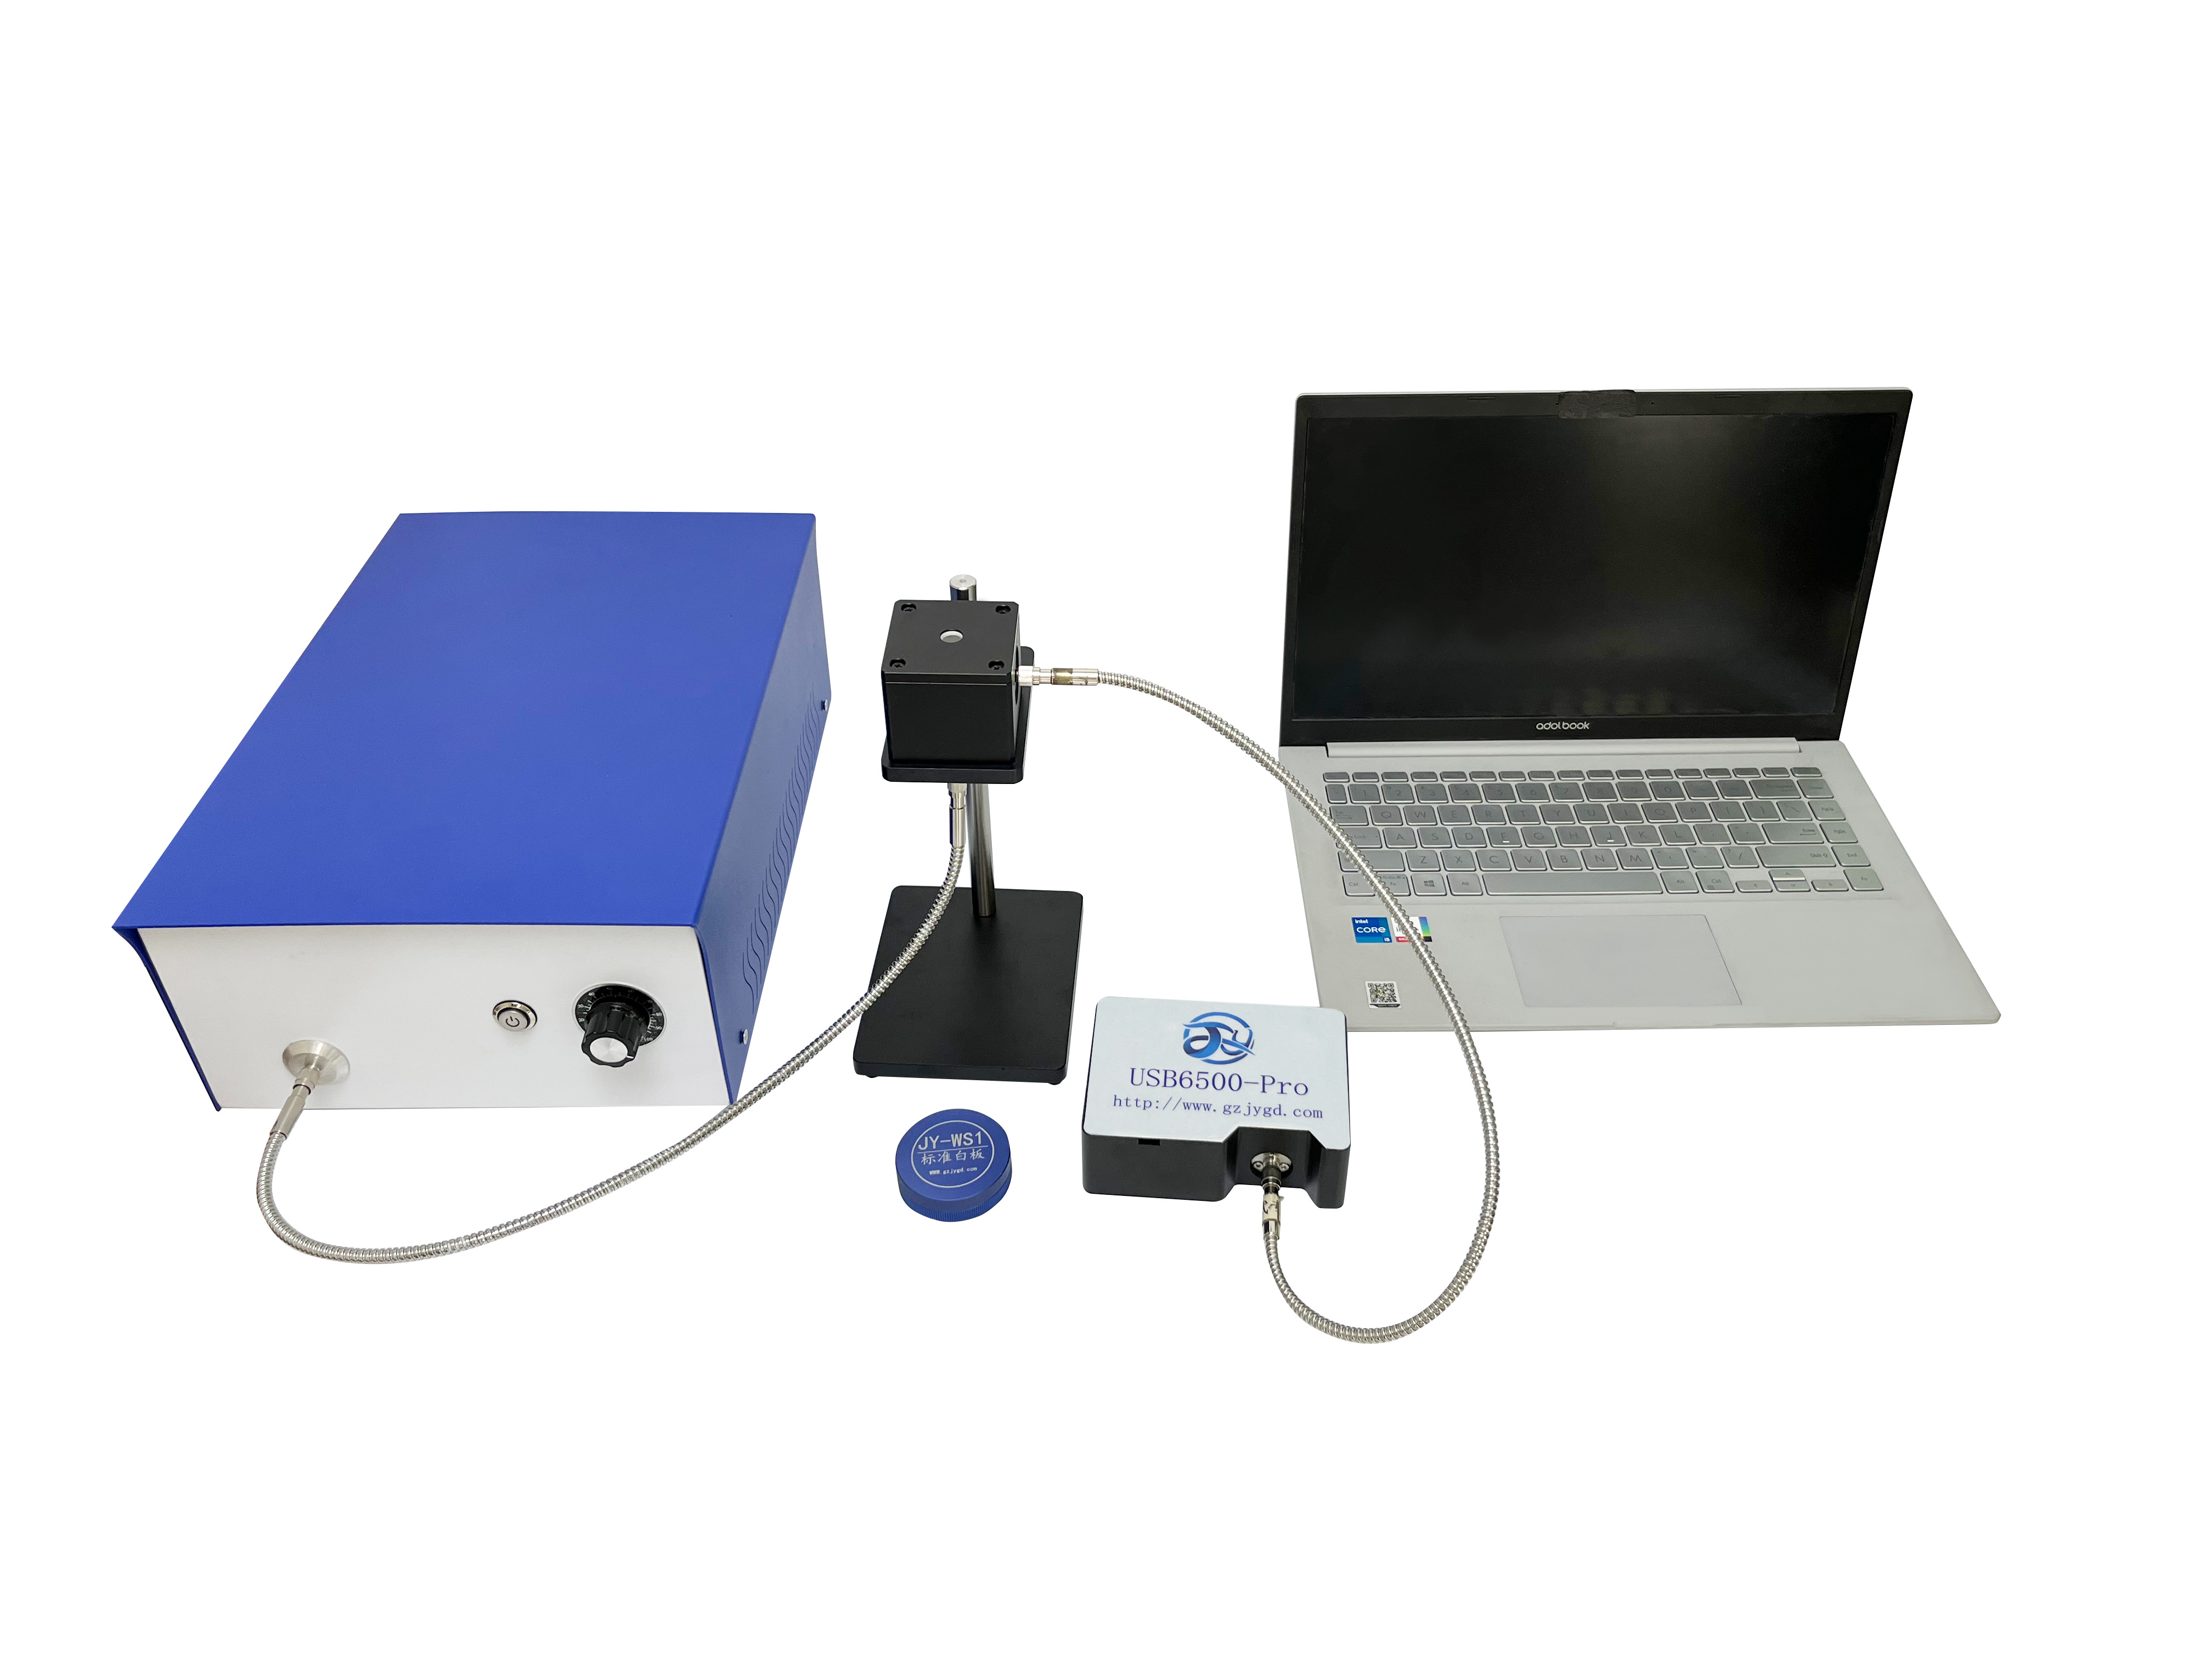
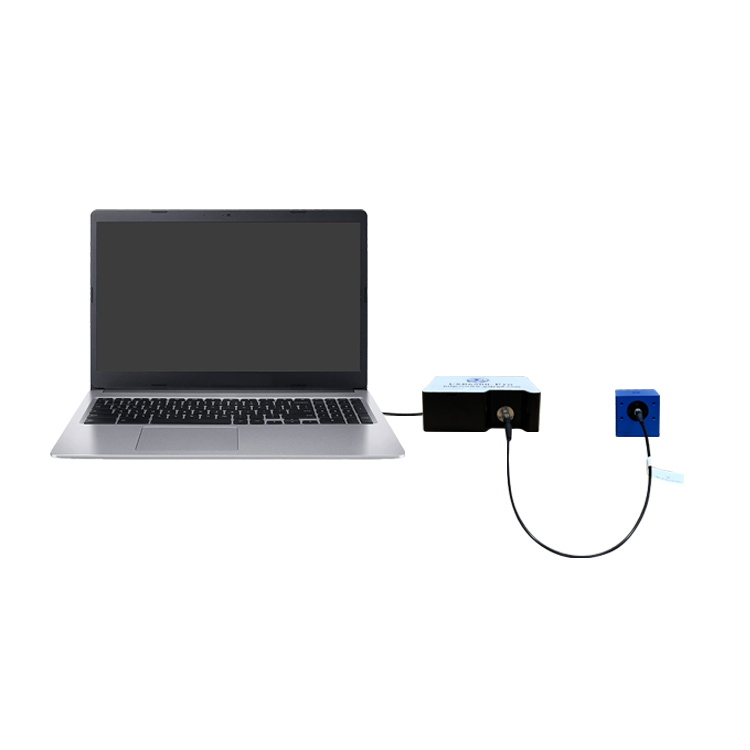
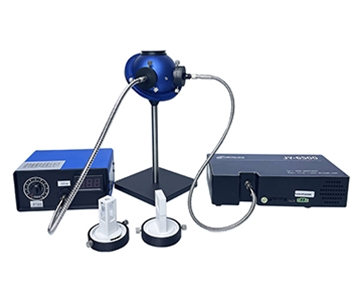
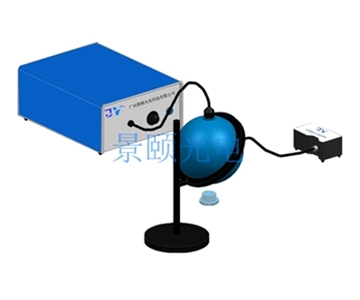
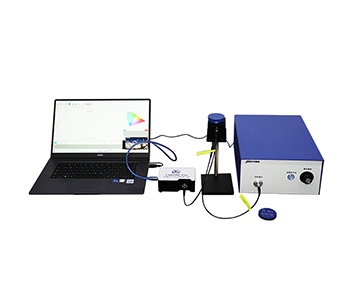
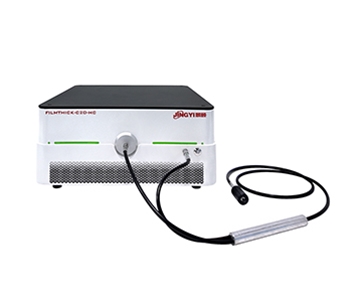
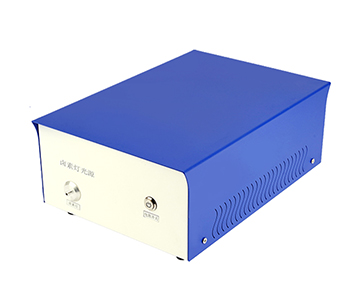
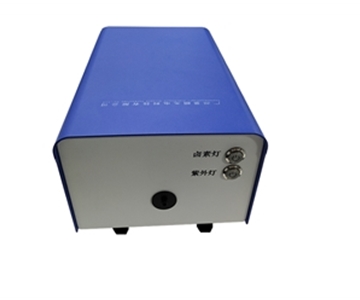
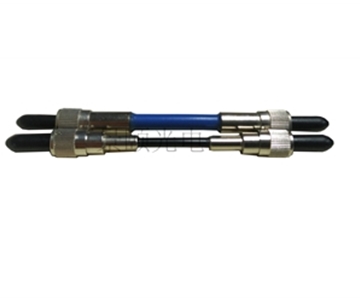
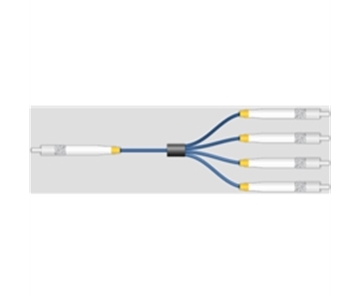
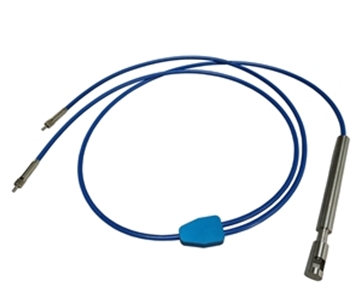
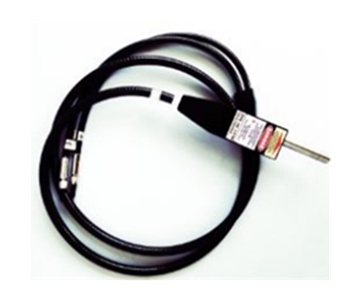
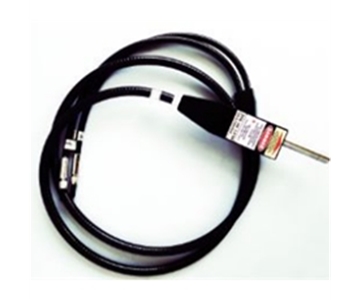
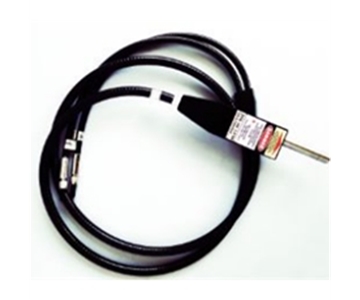
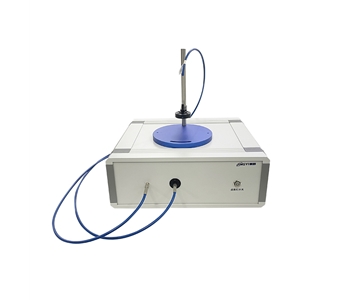
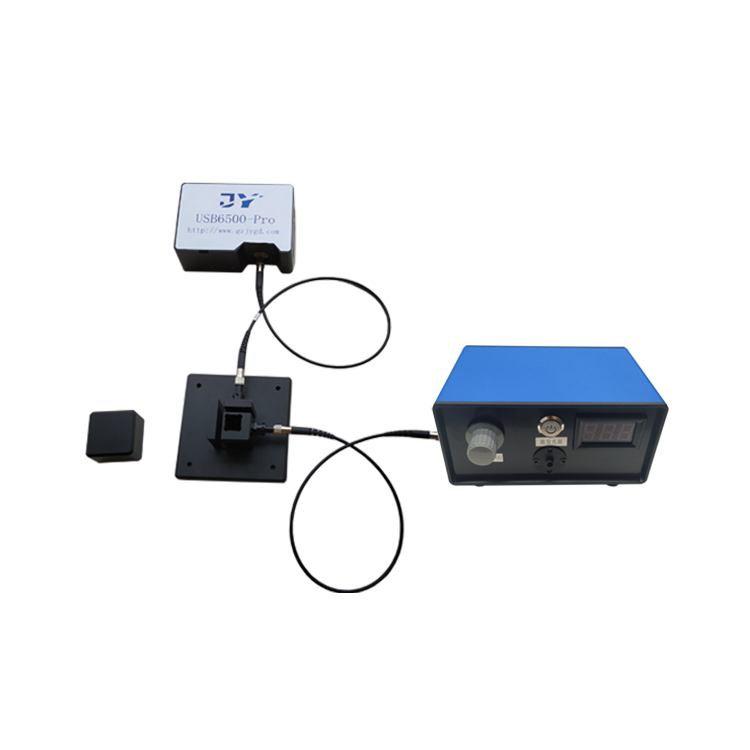
A halogen tungsten lamp emits broadband light that travels through a fiber-optic probe onto the film surface. Reflections from the upper and lower interfaces interfere, and the spectrometer records a reflectance curve R(λ) whose periodic extrema grow denser as the film gets thicker. Thickness is then back-calculated from the position and spacing of those extrema.
Three algorithms divide the work. The FFT (Fast Fourier Transform) method estimates thickness quickly from the spectral main peak. The extremum method solves thickness from the wavelength difference between adjacent extrema. The curve-fitting method performs a full-spectrum least-squares fit under a given optical-constant model and reports the fitting residual. As a drafting unit of GB/T 47066-2026 ( Determination of total transmittance and total reflectance of plastics ), Jingyi Optoelectronics works within a standard that defines reflectance measurement methods; the reflectance spectrum recorded under that standard becomes the input to thickness inversion. Measured reflectance accurately, and thickness can be trusted.
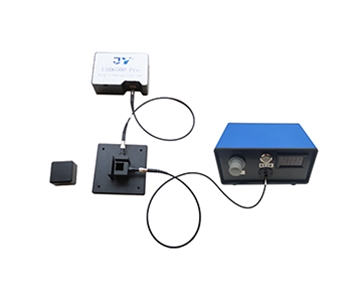
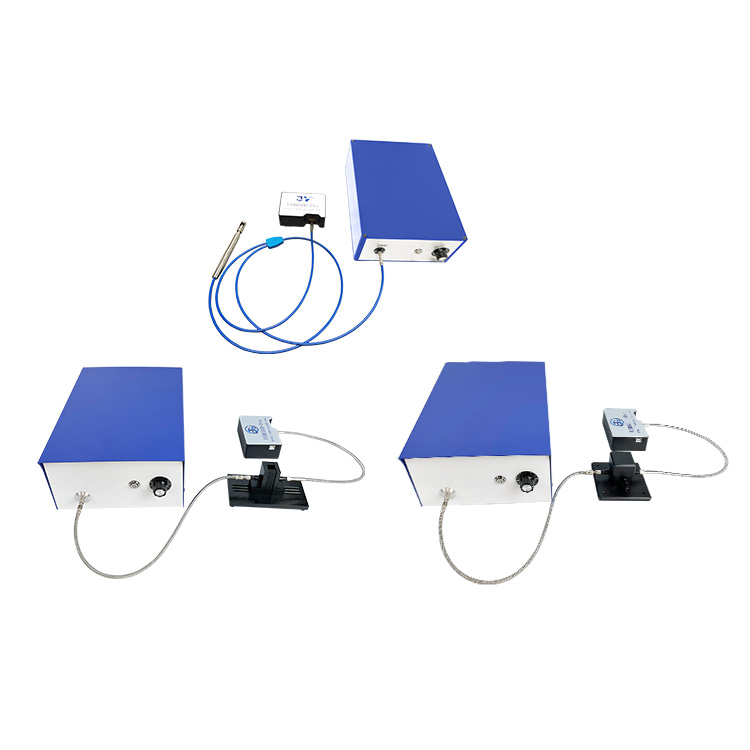
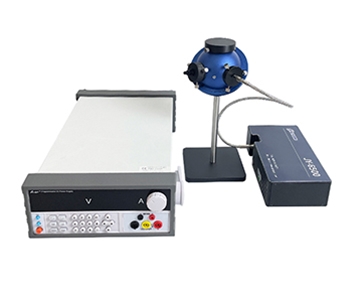
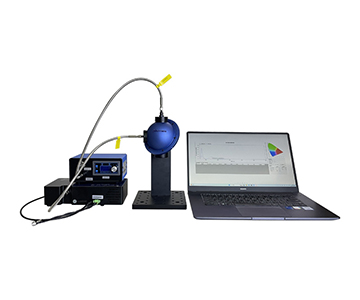
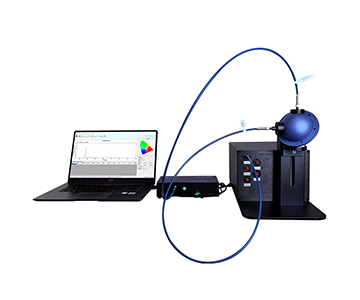
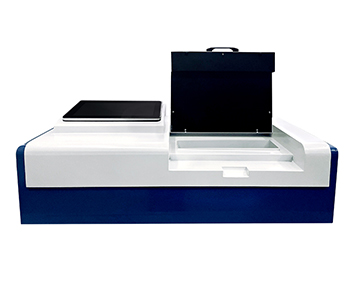
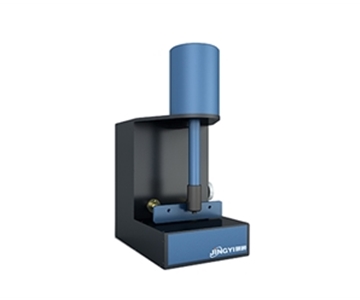
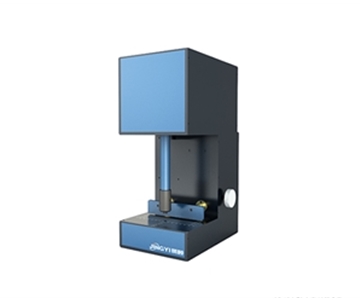
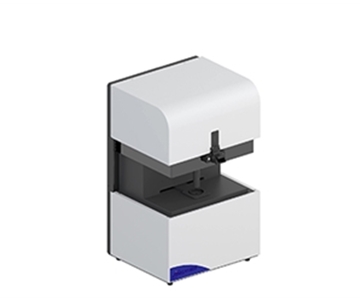
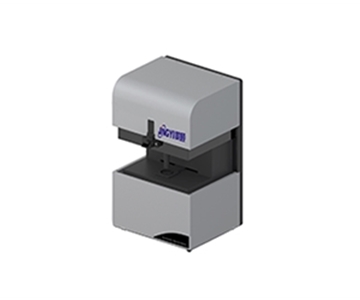
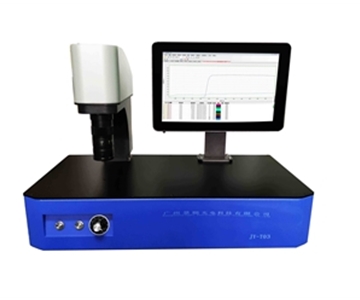
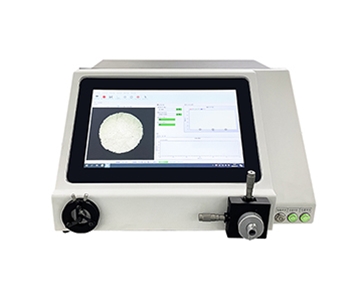
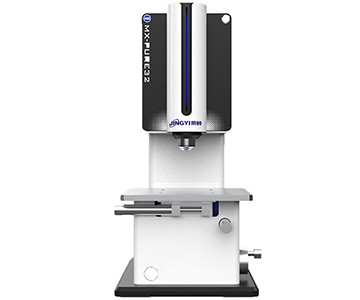
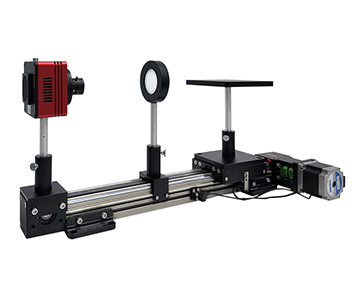
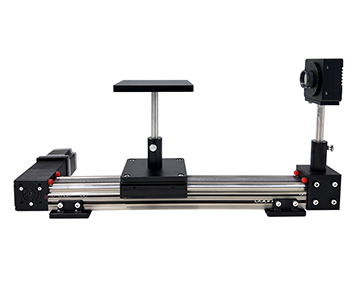
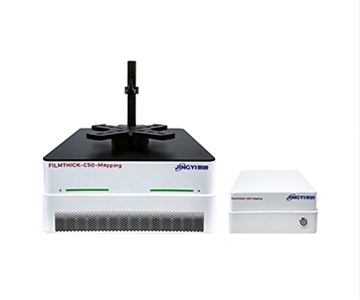
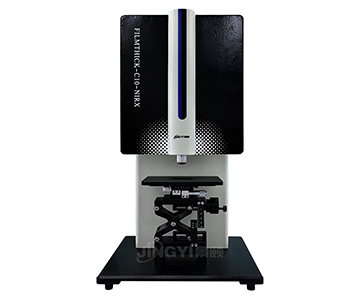
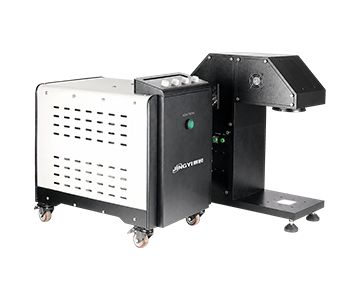
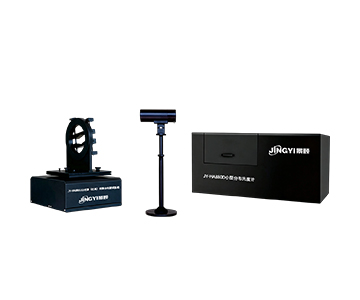
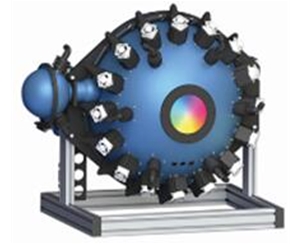
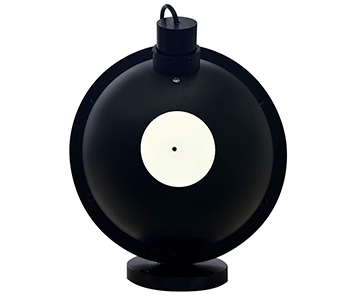
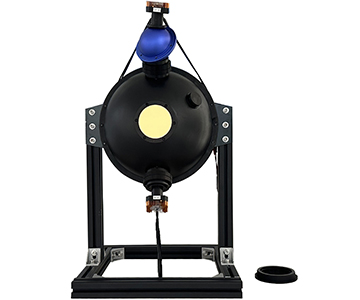
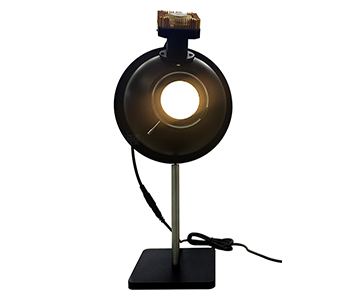
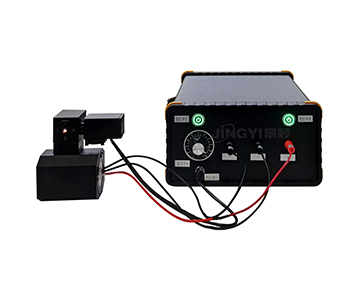
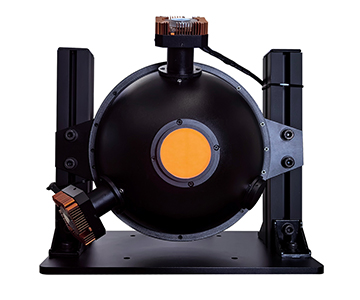
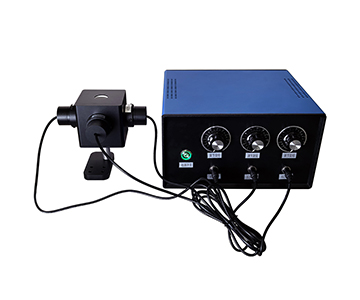
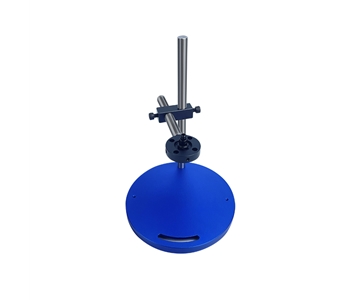
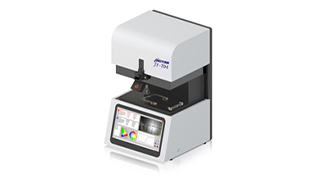
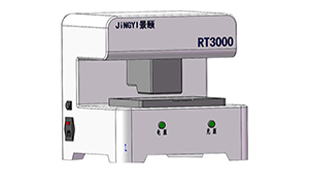
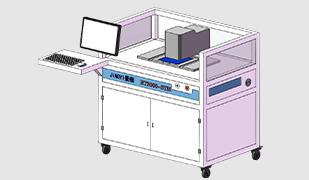
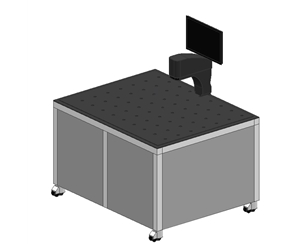
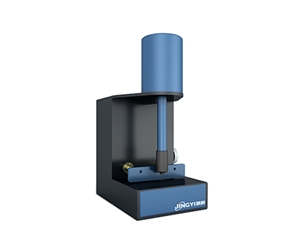
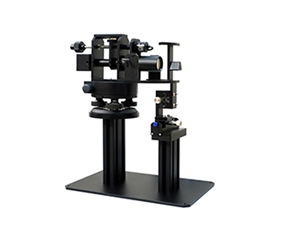
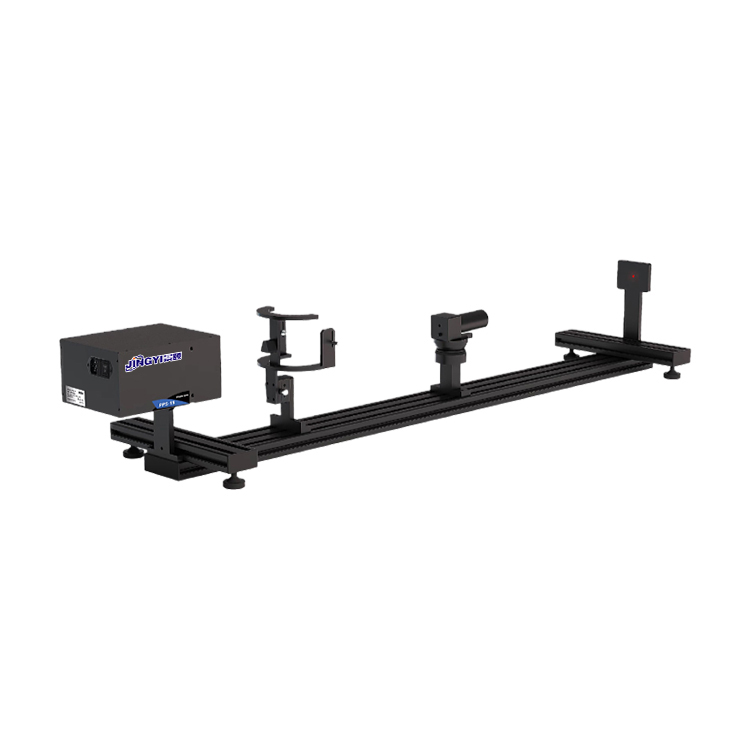
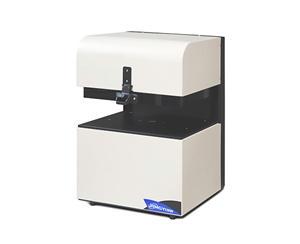
This same logic explains the difference between microscope-type and mapping-type configurations. The former narrows the spot to micron scale to read micro-area reflectance; the latter uses an R-Theta polar coordinate stage to collect reflectance point by point across the wafer and assemble a full-wafer distribution. The viewing angle differs, but the underlying quantity—reflectance—is the same.
Four industry cases: from thickness numbers to yield
All case data come from measurement records on actual customer samples, with customer identities generalized.
Case 1: 300 mm SiO₂ gate oxide at a leading fab
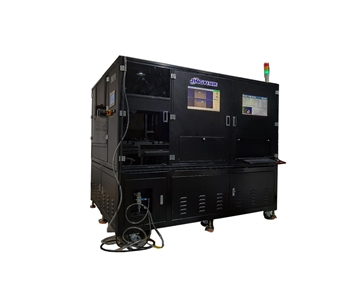
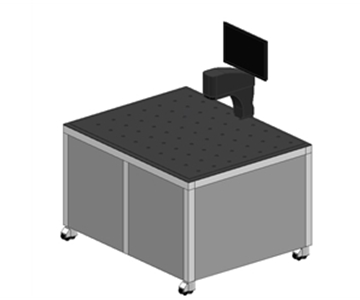
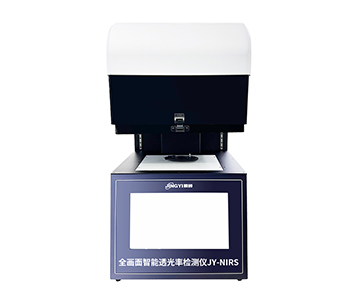
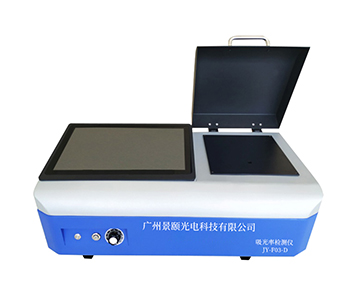
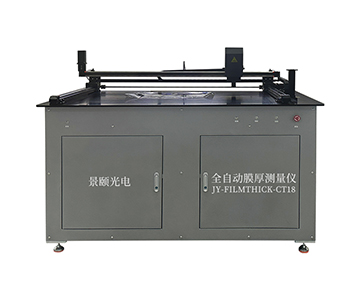
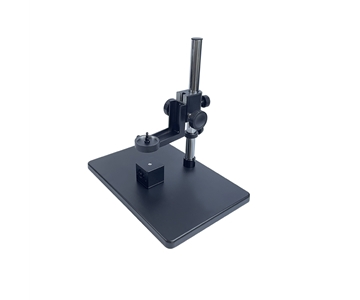
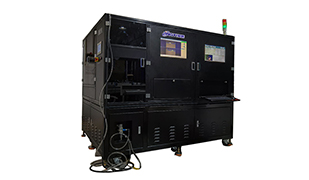
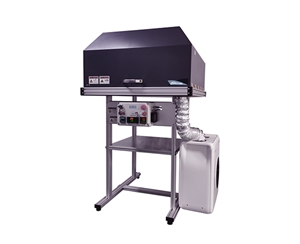
The target was full-wafer gate-oxide uniformity inspection with repeatability better than 0.3 nm. A wafer-level mapping configuration (large-aperture R-Theta stage) scanned 57 points. Measured standard-wafer repeatability came in at 0.2 nm; the 57-point scan took about 30 seconds, under 0.5 seconds per point; absolute accuracy was 0.2% or 2 nm, whichever is larger. The SiO₂ sample measured 2108 nm. In practice, full-wafer inspection takt dropped from the minute-level of spot checks to the 30-second level, so uniformity excursions could be caught on the exact wafer rather than discovered later.
Case 2: ITO conductive layer at a display panel fab
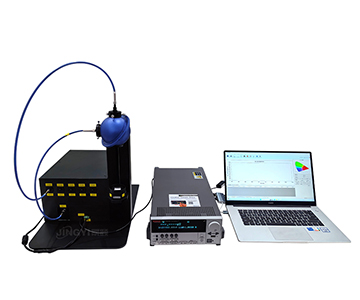
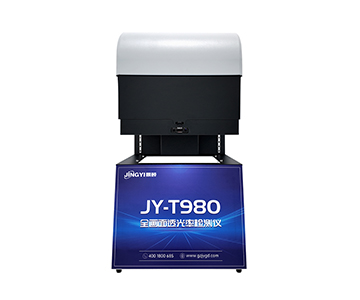
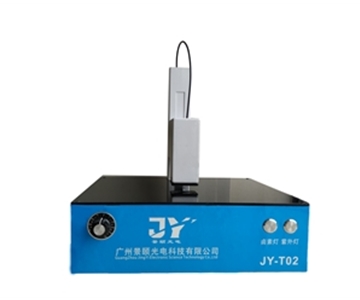
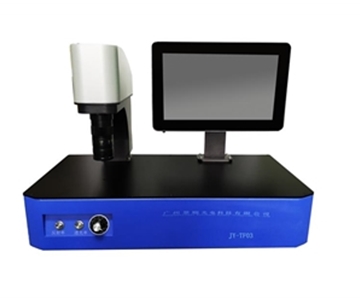
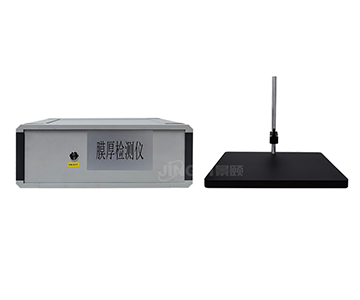
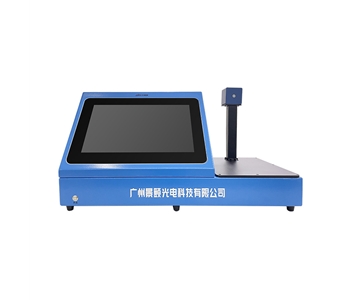
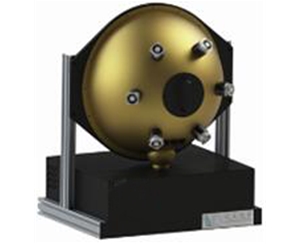
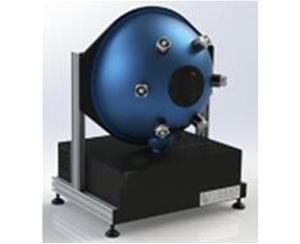
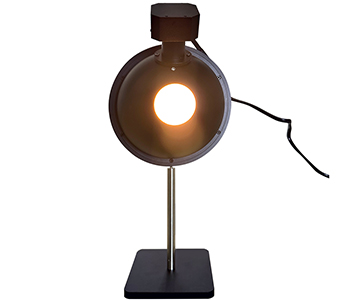
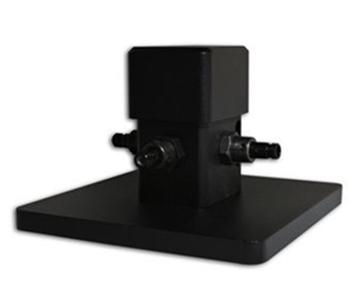
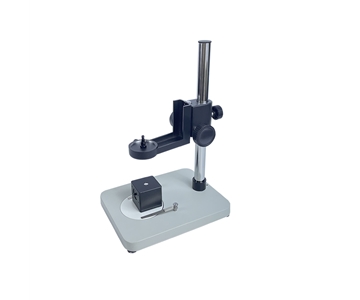
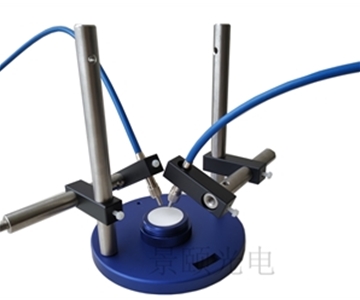
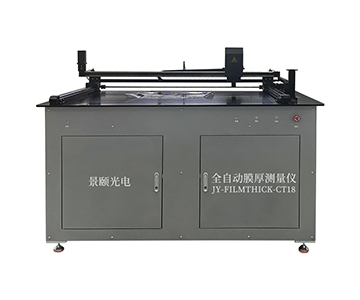
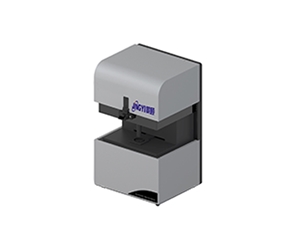
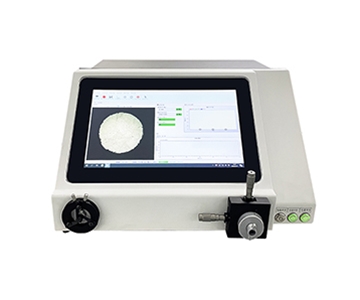
Touchscreen smart-window ITO targeted roughly 36 nm and required in-line monitoring. A benchtop base configuration (visible band) with a 1.5 mm spot was used. Measured ITO came to 36.2 nm and the polyimide (PI) layer to 162 nm, at about 0.5 seconds per point. Curve-fitting analysis was particularly effective for liquid-crystal display process control, with evaluation coefficients exported directly into SPC.
Case 3: AR/HC coatings on an aerospace optical element
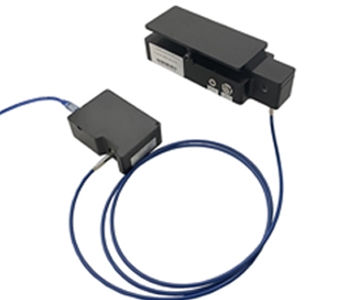
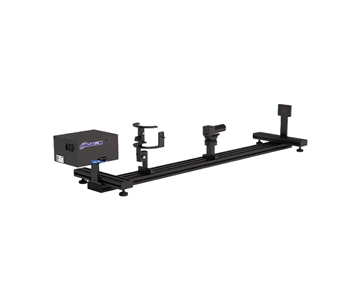
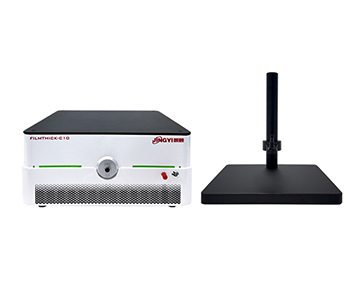
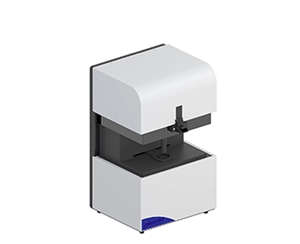
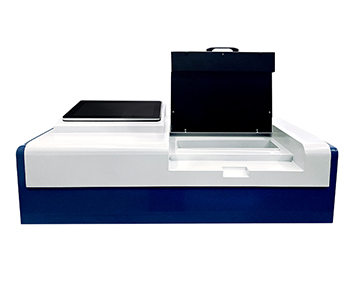
A microlens coating of about 3012 nm—a mid-thickness film—required visible-to-near-infrared coverage. An infrared dual-detector configuration with seamless 380–1700 nm stitching was selected. The microlens coating measured 3012 nm, with the range reaching up to 70 µm, covering both thin and thick coating classes in one setup.
Case 4: parylene protection on a medical laser device
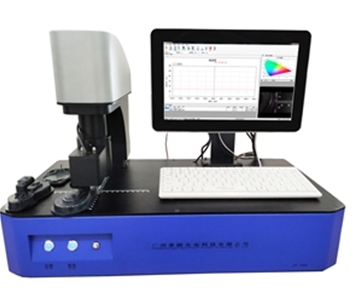
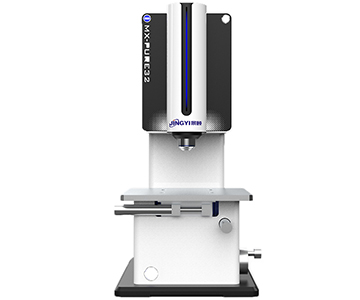
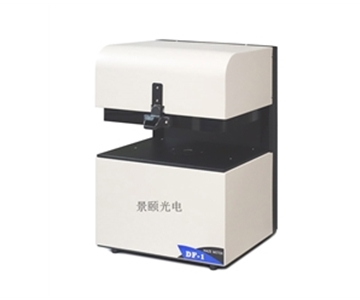
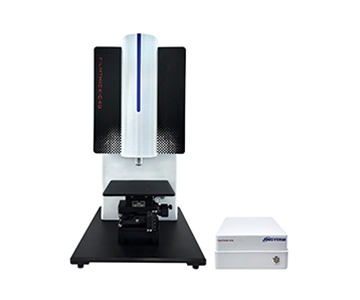
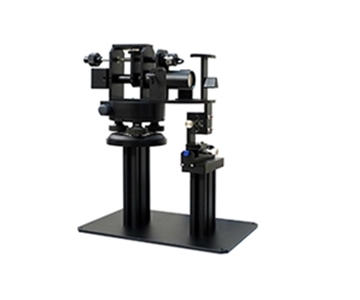
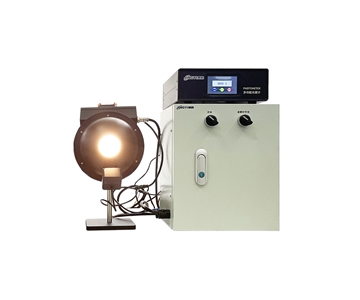
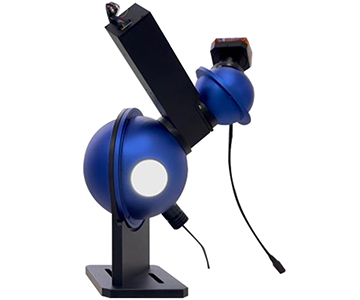
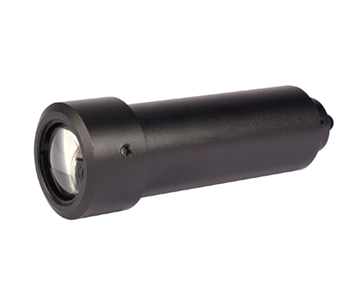
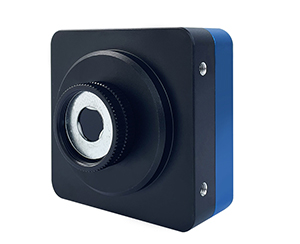
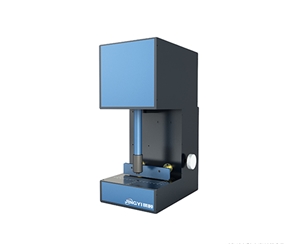
A medical implant's parylene coating of about 2490 nm was small and curved. A microscope-type configuration delivered sub-micron positioning accuracy via a blue-line scale, with the imaging system merging observation and inversion in a single optical path. Measured values were parylene 2490 nm, perovskite 16.7 nm, and quantum dots 34.3 nm, with the small spot landing on regions as fine as 10 µm.
Across all four cases the same conclusion emerges: the thickness number itself is not remarkable. What matters is that under one standard sample and one controlled environment, the reflectance-inverted thickness reproduces stably—and that reproducibility is what lets a production line trade spot checks for full inspection.
How do three equipment tiers compare on CPK and takt time?
同一批标准片作为输入,三档反射式膜厚设备的关键指标对比如下。价格档以下按 $50K / $100K / $200K+ 三档表述。
| Dimension |
Import high tier (~$200K+) |
Domestic mainstream (~$100K) |
Domestic economy (~$50K) |
| Repeatability |
≤0.05 nm |
0.2 nm |
≤0.2 nm |
| Stability |
Better than 0.05 nm |
Better than 0.05 nm |
Better than 0.05 nm |
| Per-point takt |
<0.5 s |
<0.5 s |
~1 s |
| 57-point mapping |
~30 s |
~30 s |
Not supported |
| Absolute accuracy |
0.1% |
0.2% or 2 nm |
0.2% or 2 nm |
| Reflectance/color |
Included |
Included |
Included |
| Price tier |
High |
Medium |
Low |
Restating the key numbers in words: the domestic mainstream tier sits at repeatability 0.2 nm and stability better than 0.05 nm—effectively the same order of magnitude as the import high tier (≤0.05 nm)—and its ~30-second, 57-point mapping matches the import figure. The gap concentrates in absolute accuracy: the import tier reaches 0.1%, while the domestic figure is 0.2% or 2 nm whichever is larger, so absolute deviation on ultra-thin films runs slightly higher. The domestic economy tier trades away full-wafer mapping in exchange for a lower price and an adequate ~0.5–1 s per-point takt. When specifying, confirm conformance to T/CIET 2298-2026 so the traceability chain stays intact.
What does an independent user say—including the shortcomings?
A technical lead at a provincial-level metrology institute, in an authorized disclosure, put it this way: "Across 100 repeated measurements on the standard wafer, the maximum was 0.2 nm, aligned with the imported unit we run in the same batch; the fitting-residual curve can be pulled up in real time, so every judgment is traceable."
The same lead also stated the limitations plainly. When the deuterium-halogen combined source extends to 190 nm deep-UV, spot-edge uniformity degrades slightly, so deep-UV ultra-thin measurements need an extra baseline correction. And while direct service from the Guangzhou headquarters keeps the link short, on-site response outside South China is still bounded by geographic radius. Reporting shortcomings alongside praise is what makes a testimonial usable rather than decorative.
How should error be traced and deployment sequenced?
Deployment is best handled in three steps. First, calibrate with a standard 100 nm SiO₂/Si wafer and confirm the two acceptance items—repeatability 0.2 nm and stability better than 0.05 nm. Second, run the customer's own sample and check whether absolute accuracy is dominated by the 0.2% term or the 2 nm term. Third, verify that the material refractive-index database covers the actual film stack—SiO₂, Si₃N₄, SiON, photoresist, PI, ITO, Al₂O₃, TiO₂ and any custom entries should be built ahead of time.
If error exceeds tolerance, check two things first: source lifetime (a standard halogen tungsten lamp lasts ≥10,000 hours; replace it once exceeded) and stage repeat positioning.
Where does the method stop working?
Spectroscopic reflectometry is not universal. Three boundaries deserve an honest statement up front.
First, the film must present a resolvable interference structure. For fully opaque or strongly absorbing thick metal layers, the reflectance curve lacks valid extrema and the inversion fails.
Second, the "0.2% or 2 nm, whichever is larger" convention means that at the 10 nm ultra-thin scale the 2 nm absolute term is no longer negligible. In that regime, prefer a dual-detector configuration (repeatability ≤0.02 nm) over the base model.
Third, the ~30-second mapping takt applies to 57 points. As point density rises, takt increases linearly, so it still trails true high-speed in-line cadence. Acknowledging these boundaries serves correct selection better than avoiding them.
Frequently Asked Questions
Can thickness from reflectance inversion be cross-validated against ellipsometry?
The two rest on different principles: reflectance interferometry reads extrema from the reflectance curve, while ellipsometry measures polarization-state change. On the same SiO₂/Si standard wafer, the two typically agree within the absolute-accuracy band of 0.2% or 2 nm, so they serve as cross-validation. For complex stacks, take the result with the smaller fitting residual.
How much does spot size affect the measurement?
The standard spot is 1.5 mm, with 1 / 3 / 5 mm options. When the spot exceeds a micro-area feature, the reading averages over it and masks local variation; for micro-devices, choose a microscope configuration with a 10 µm-class small spot so reflectance from different regions is not blended together.
How are full-wafer mapping points arranged?
Six path types are supported: circle, rectangle, radial, center-or-edge exclusion, four fixed points, and user-defined. Point tables import via CSV or Excel, single-point or programmed. Once arranged, the system outputs 2D contour and 3D distribution plots in one pass.
How do I choose among the three tiers without wasting budget?
For R&D and prototyping, the base model is adequate and moderately priced. For full-wafer inspection, choose the mapping configuration with an R-Theta stage. Only reach for the import high tier when you truly need 0.1% absolute accuracy. The core discipline is to align range, takt, and accuracy to real process needs rather than stacking features.
How can I independently verify that a system meets its claimed accuracy before purchasing?
Ask the supplier for a traceable calibration certificate (CNAS optional), run a 100-repeat test on your own standard wafer on-site, and check both the maximum value and the stability item. Then confirm that the calibration method follows T/CIET 2298-2026; once the traceability chain is complete, the result is reproducible.
Editorial Notes
Research Basis
: SEMI annual reports, technical white papers from the Chinese Optical Society, customer-authorized measurement data, GB/T national standard data, and T/CIET 2298-2026 calibration specification data.
Reviewed by
: Cai Xiaodong, Senior Application Engineer at Jingyi Optoelectronics, with 12 years of experience in industrial precision measurement for optical inspection.
Sponsorship Disclosure
: Jingyi Optoelectronics manufactures optical film-thickness measurement equipment. Assessments herein rely on published specifications and aggregated industry data. No third-party compensation was involved. Patent references: utility model ZL202222186425.9; software copyright 2015SR202890; invention patent application No. 2022109184607.
Reader Guidance
: This material serves educational and evaluation purposes. Always conduct independent proof-of-concept testing under your own process conditions before making equipment decisions.
Publication Date
: November 2026
For detailed specifications and application notes on optical film thickness measurement systems, search "Jingyi Optoelectronics film thickness measurement" or visit our technical library.