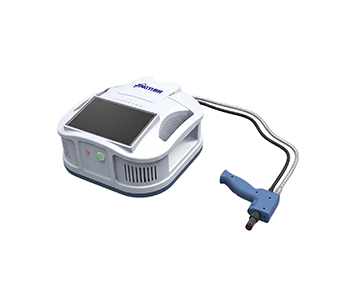
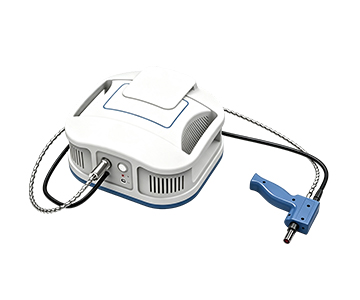
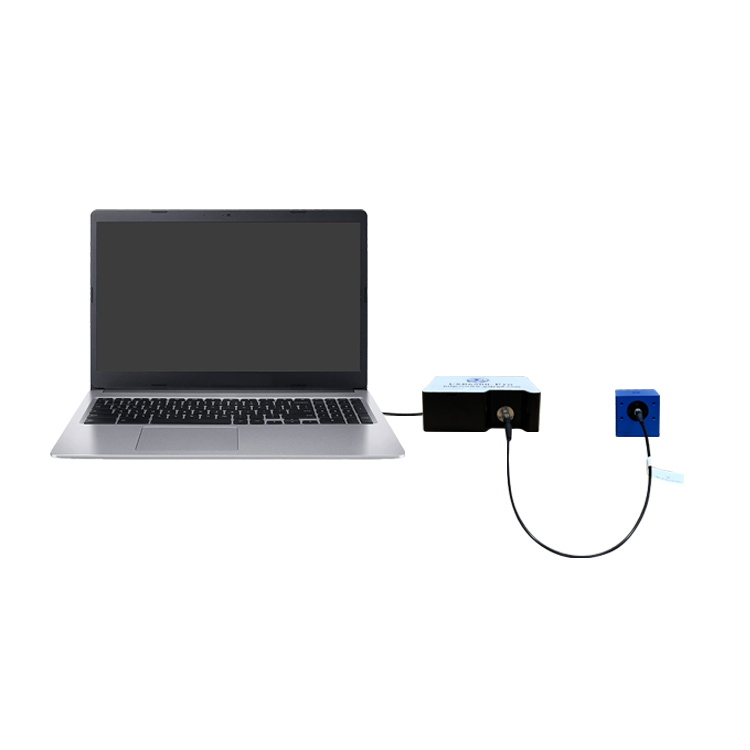
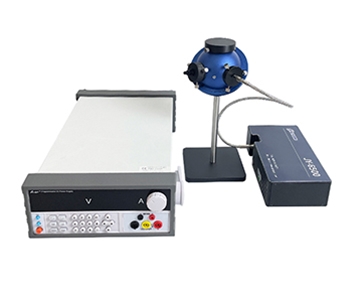
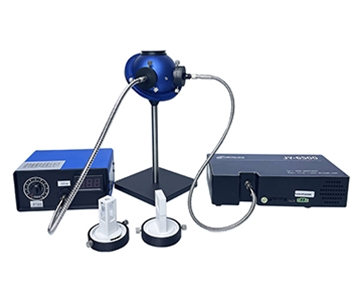
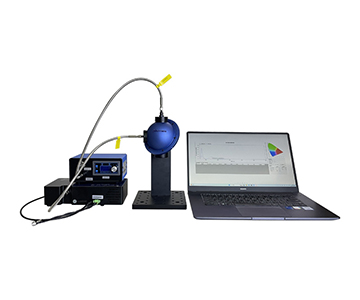
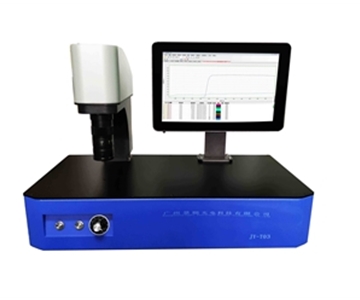
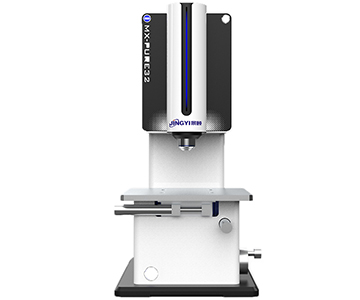
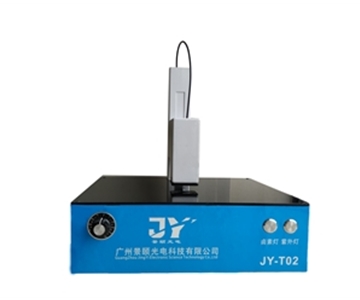
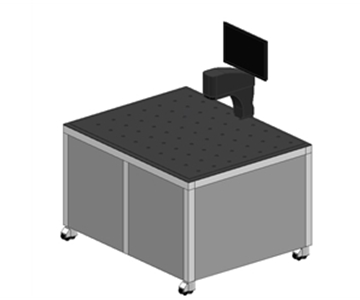
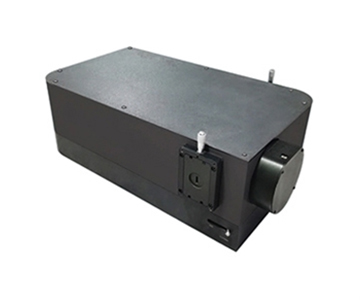
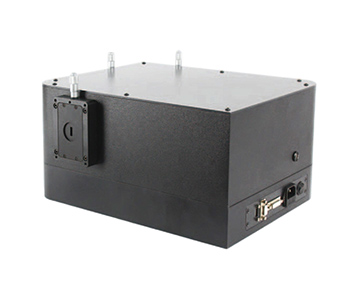
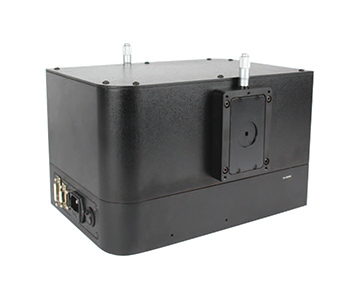
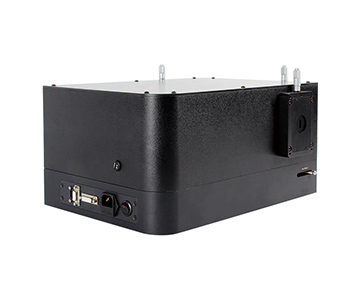
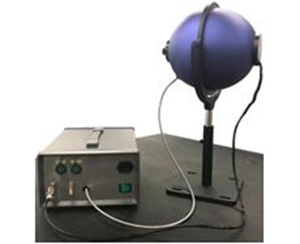
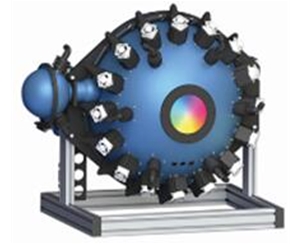
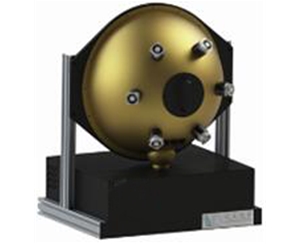
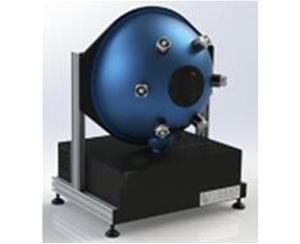
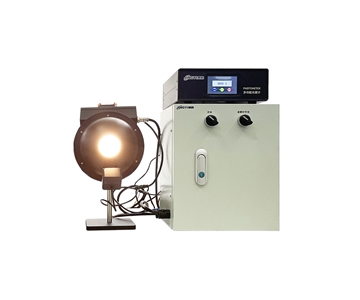
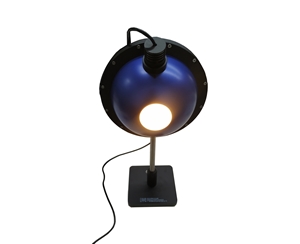
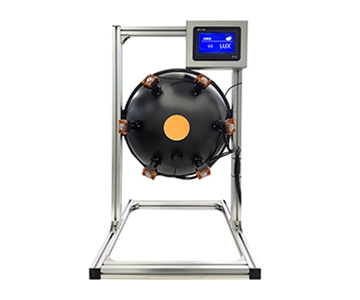
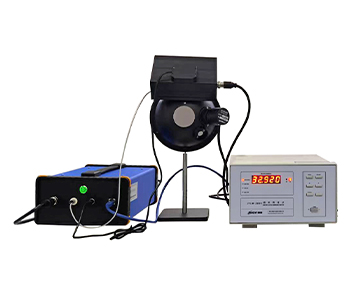
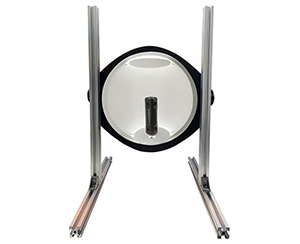
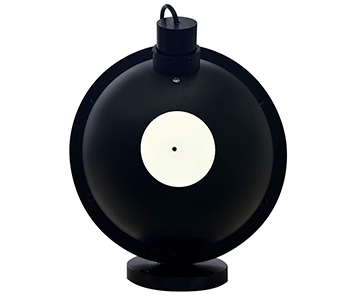
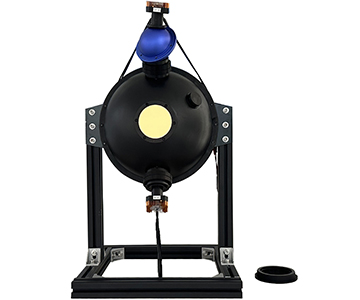
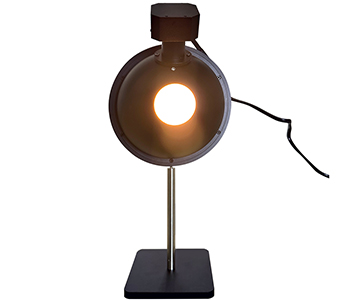
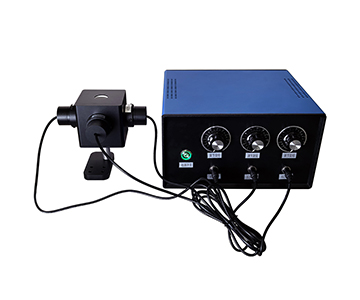
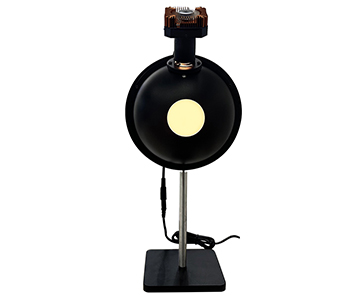
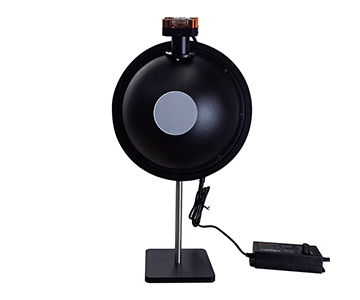
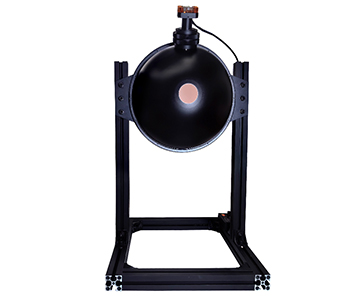
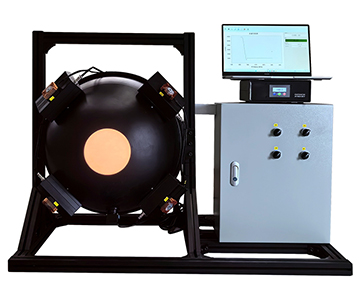
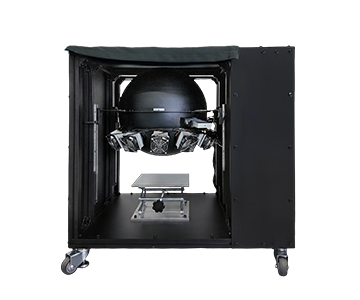
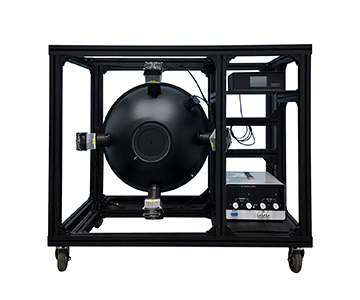
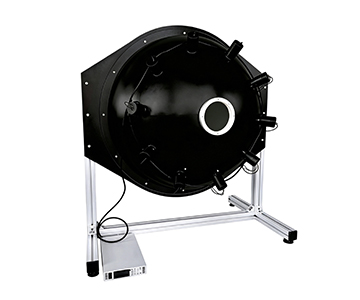
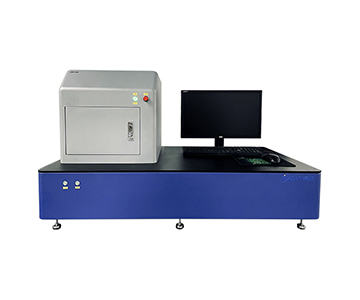
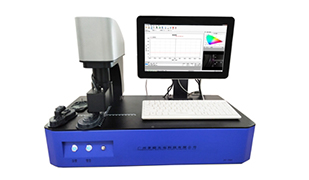
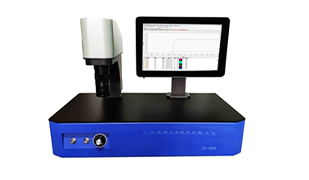
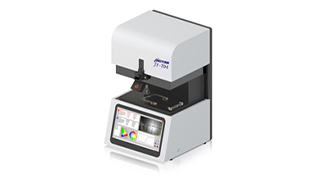
Selecting a fluorescence quantum efficiency (QE) measurement system based on datasheet specifications alone often leads to disappointing repeatability in real labs. Data drift typically originates from sample positioning variance, integrating sphere geometry, spectrometer linearity, and excitation source stability—not just spectral range or resolution. This guide evaluates five critical dimensions that determine measurement consistency, compares four architectural approaches, and maps selection criteria to five common R&D scenarios. For labs prioritizing absolute quantum yield reproducibility, understanding these hidden error sources reduces the risk of purchasing a system that cannot support publishable or production-grade data.
Why Quantum Yield Data Keeps Drifting Between Measurements
Anyone running absolute quantum yield (AQY) tests has seen this: a batch of quantum dot solution measures 82.4% PLQY in the morning, then 79.1% after reloading the same sample in the afternoon. The spectral shape looks identical, but the three-percentage-point shift renders the data unusable for publication or process control.
A process engineer at a materials lab in Shenzhen once traced this error back to a sub-degree angular variance in sample cup placement. That tiny tilt changed the obscuration ratio at the integrating sphere port,
Specification inflation is a second trap. Some vendors advertise broad spectral coverage without disclosing that signal-to-noise ratio (SNR) collapses at band edges. Others claim "better than 1 nm" resolution while the dynamic range crumbles under weak emission signals. In B2B procurement, the real danger is not low specs—it is specs without defined test conditions.
The third layer is serviceability. A fluorescence QE system is not a plug-and-play instrument. Excitation source aging, integrating sphere coating contamination, and fiber bend loss gradually erode data consistency. Without annual on-site calibration, the hardware may still power on after two years, but the numbers it produces are no longer trustworthy.
This comparative review therefore does not rank systems by "who has the highest specs." Instead, it dissects five repeatability-critical dimensions: sample positioning, optical path stability, dynamic linearity, software data logging, and post-sale calibration support.
Five Evaluation Dimensions That Determine Repeatability
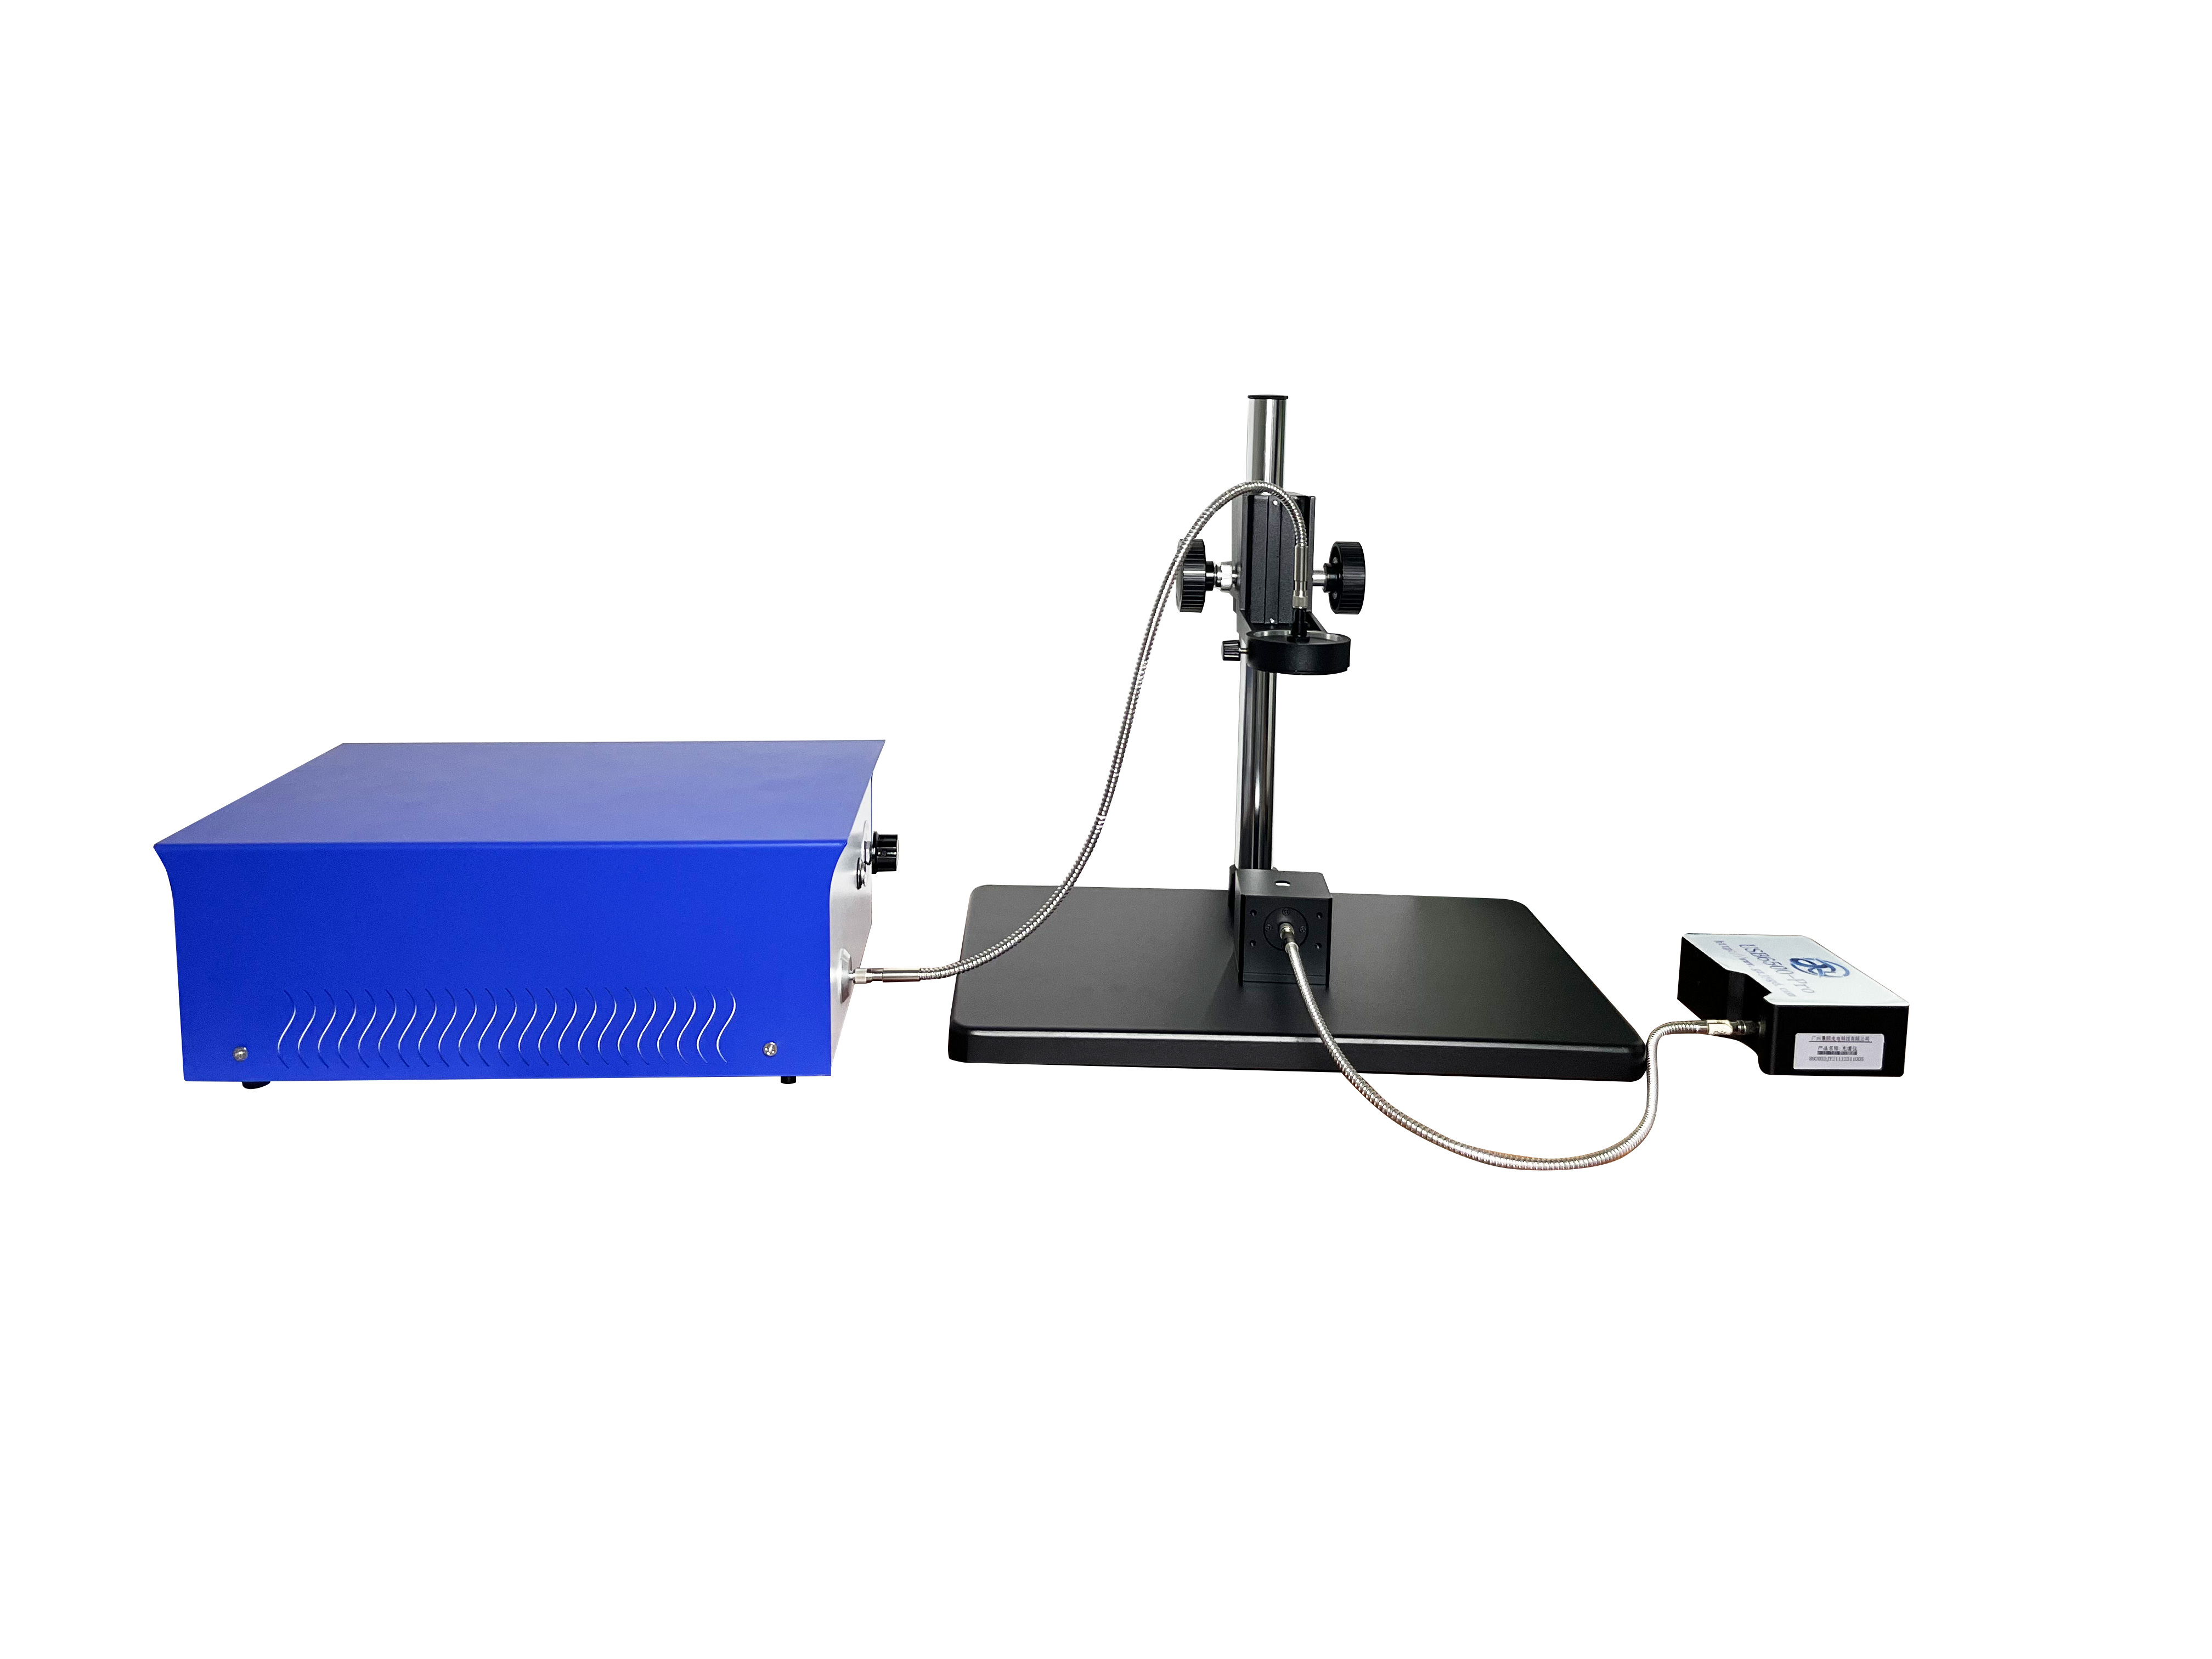
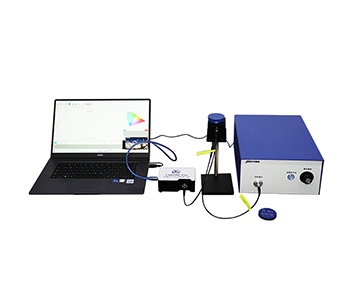
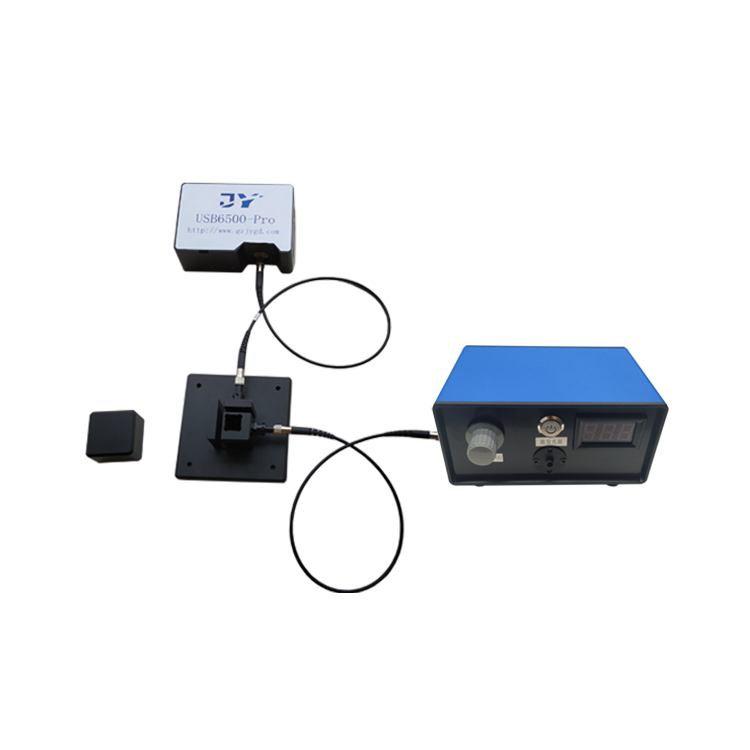
The working principle is straightforward: a traceable light source calibrates the integrating sphere, the sample is excited at a specific wavelength, the spectrometer collects emitted photons, and software calculates absolute quantum yield as emitted photons ÷ absorbed photons. Simple in concept, but every stage can introduce drift.
Dimension 1: Sample Positioning Consistency.
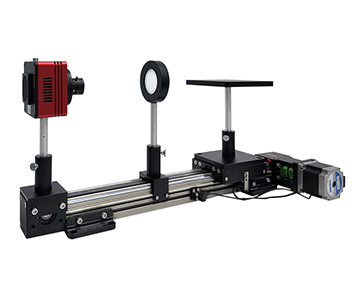
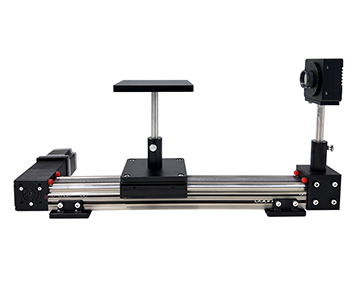
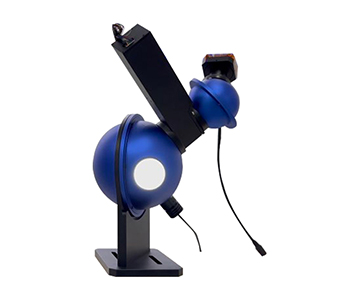
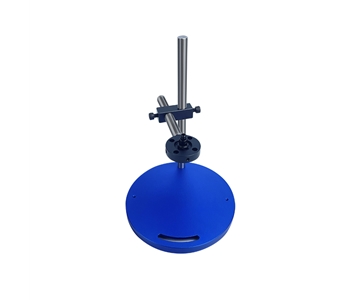
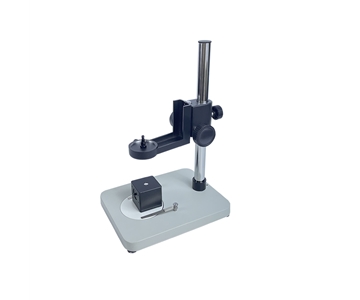
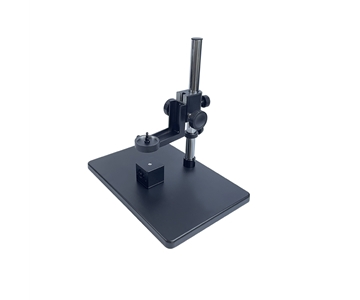
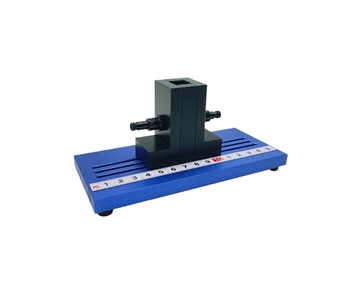
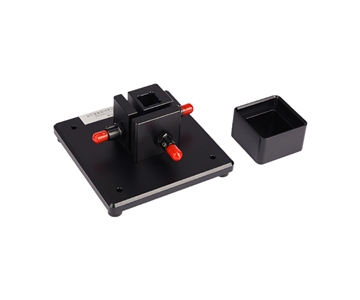
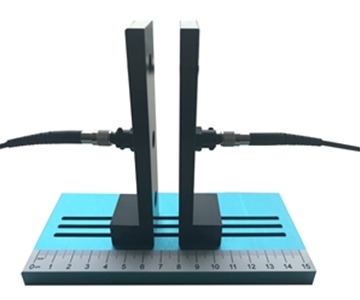
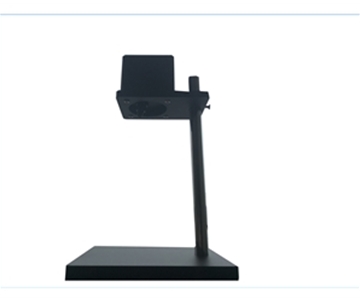
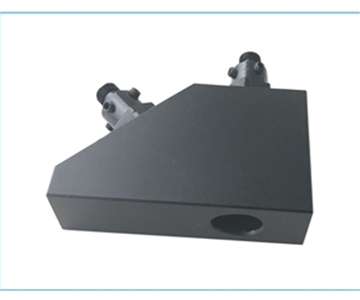
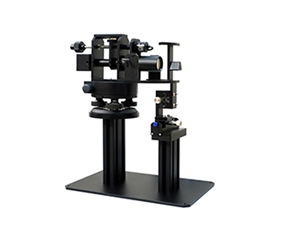
Magnetic fixtures with mechanical hard stops achieve sub-millimeter repositioning accuracy. Motorized vertical fixtures support unattended serial testing. Standard slot-in holders rely entirely on operator feel. For batch comparisons, positioning repeatability affects results earlier than spectral resolution does.
Dimension 2: Integrating Sphere Geometry and Coating.
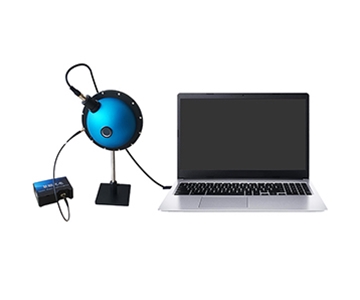
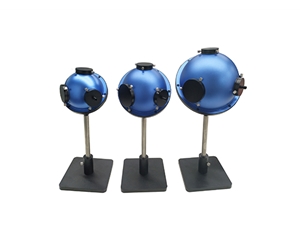
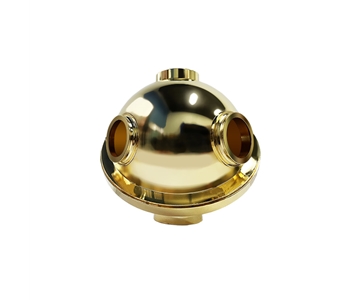
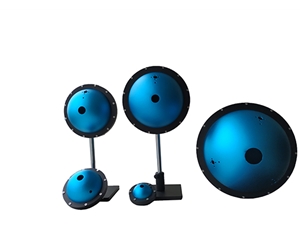
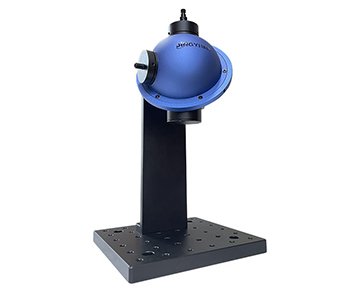
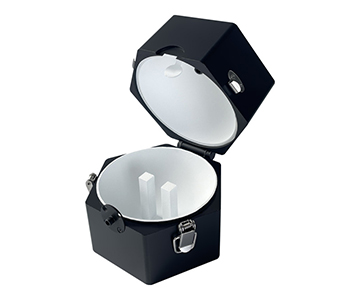
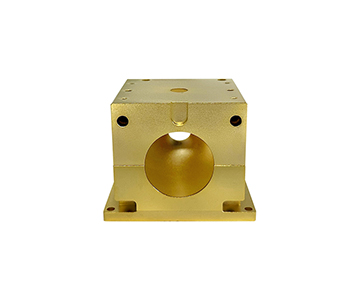
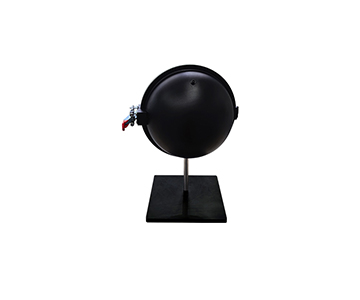
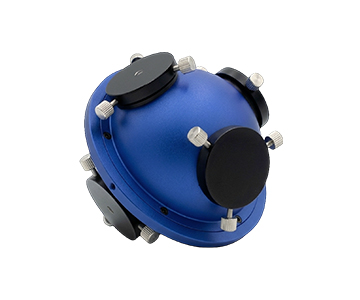
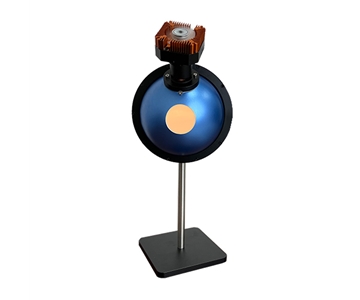
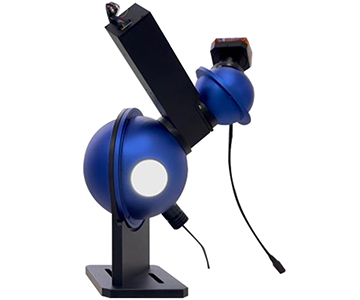
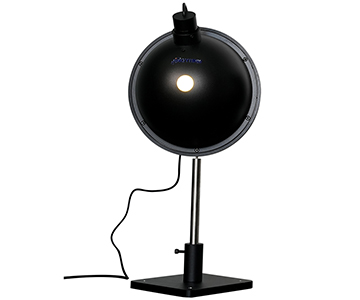
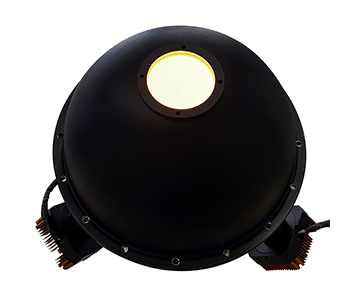
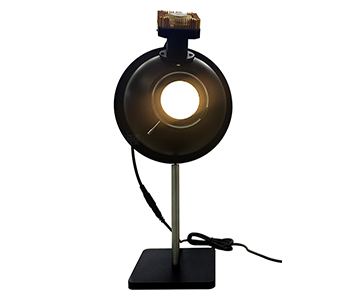
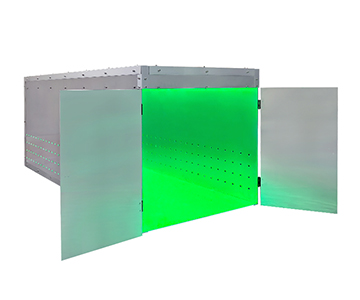
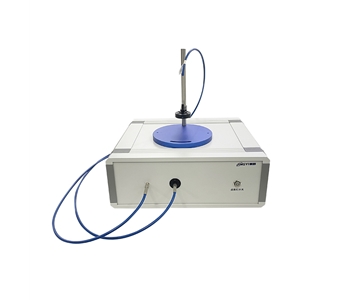
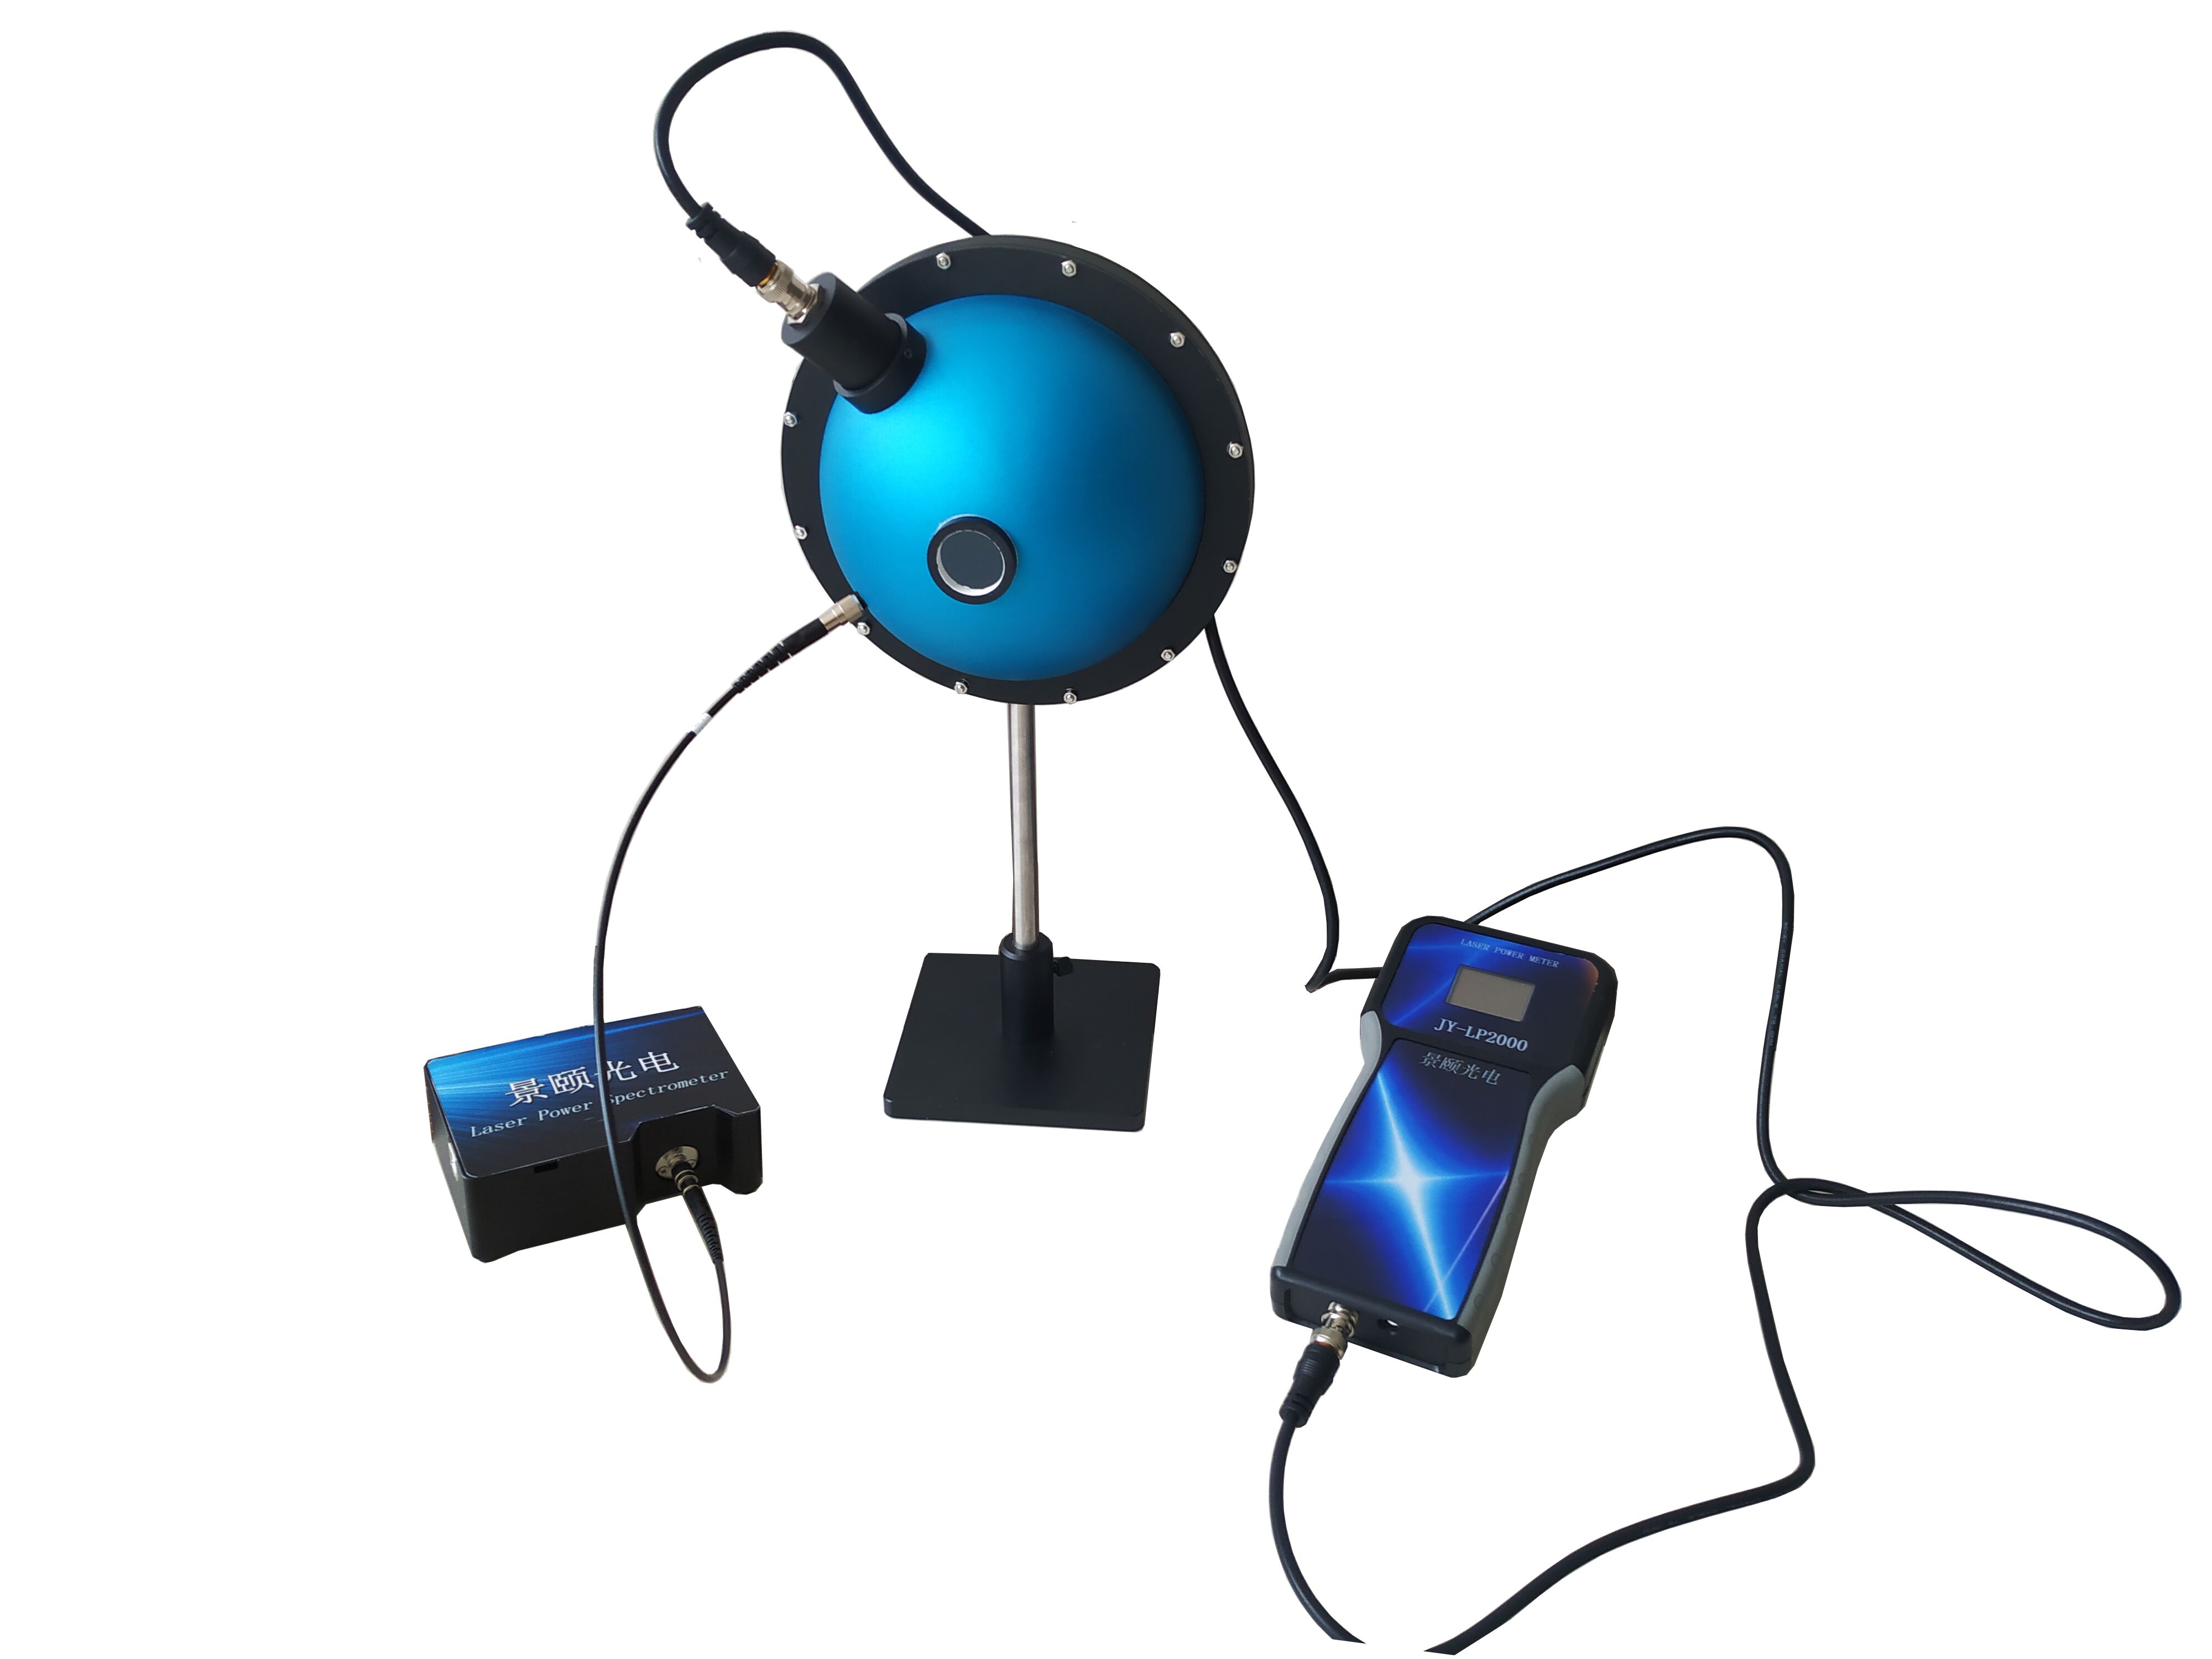
PTFE coatings deliver high reflectivity and stable diffuse scattering across 350–1100 nm. A 3.3-inch (84 mm) sphere suits most samples; a 1.5-inch port balances optical throughput and obscuration ratio. Smaller spheres are more sensitive but punish minor sample misalignment.
Dimension 3: Spectrometer Linearity and Dynamic Range.
A 16-bit ADC paired with 100,000:1 single-scan dynamic range allows weak fluorescence peaks and strong excitation leakage to coexist on one spectrum without clipping. An SNR of 1000:1 is the entry threshold; 1500:1 in the near-infrared region provides a safer margin.
Dimension 4: Excitation Source Stability.
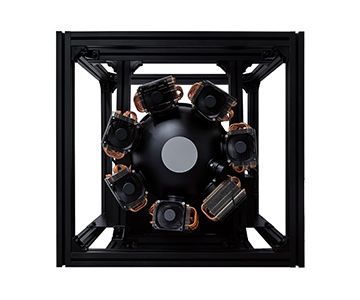
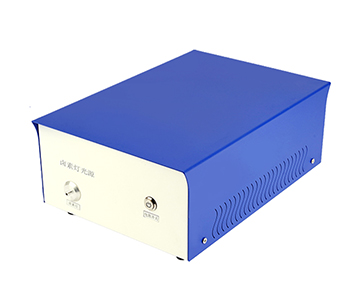
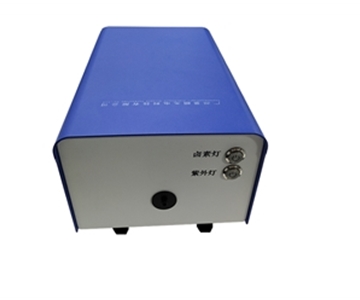
Fiber-coupled high-power LEDs or lasers with adjustable intensity covering 365–940 nm handle common excitation wavelengths. Multi-wavelength fixed-position systems (365/405/535/620/740 nm) swap samples without changing lamps—excellent repeatability but limited flexibility.
Dimension 5: Software and Metrological Traceability.
Real-time logging of spectra, chromaticity coordinates, dominant wavelength, radiant flux, and quantum efficiency versus excitation power curves lets you trace exactly which power level triggered data drift. A traceable calibration lamp is the prerequisite for cross-year data comparison.
Below, four architectural approaches are evaluated against this framework.
Four System Architectures Compared on Repeatability
System A: UK-Based Metrology House (Est. 1975)
This Leeds-based manufacturer has five decades of experience in spectrometers, monochromators, and PV EQE systems. Its calibration chain aligns with ISO/CIE standards, making it a baseline reference for national metrology institutes.
Core strength lies in photometer characterization and quantum efficiency traceability. Monochromator wavelength accuracy and stray-light suppression are executed with precision, suitable for anchoring quantum yield to national standards. The trade-off: the system is research-grade and cannot match industrial production line cadence.
Pricing sits at the upper tier. Domestic agents stock limited spares; calibration requires factory return with lead times measured in weeks. Non-standard customization is possible but quoting is slow. Best suited for metrology labs and national institutes that issue externally recognized data. Not appropriate for users demanding rapid delivery, high-throughput line integration, or frequent on-site maintenance.
System B: Domestic Modular PL Supplier
This vendor follows a modular integrating sphere plus fiber spectrometer approach, targeting university research and materials labs with mid-tier budgets. The philosophy is to split sphere, excitation source, and spectrometer into configurable modules. Common configurations cover visible to near-infrared; fixtures are mostly mechanical-limit types requiring manual alignment. The modular benefit: upgrading the spectrometer does not require replacing the sphere.
For budget-sensitive labs with single-sample morphologies, the value proposition is strong. Base configurations are controllable; adding motorized fixtures, multi-wavelength excitation, or NIR extension increases cost quickly. Ideal for perovskite and organic small-molecule groups with stable samples and dedicated operators. For long-term batch comparison, establishing an internal reference sample for daily calibration is advised.
Domestic response is faster than overseas
System C: Domestic Electro-Luminescence Integrator
This supplier emphasizes system integration and software, covering both photoluminescence and electroluminescence architectures. Its client base centers on novel display and lighting device R&D.
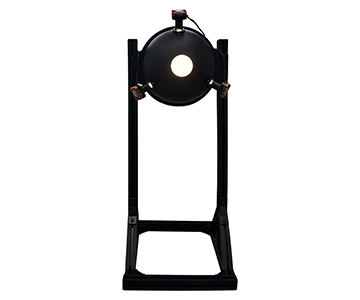
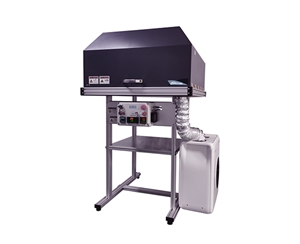
The differentiator is on the EL side: source meter linkage, current density scanning, and quantum efficiency versus current density curves are well implemented. Probe station solutions handle small, irregularly shaped samples. PL-side configuration is comparable to other domestic offerings.
For OLED and Mini-LED device R&D, bundled source meter + probe station + integrating sphere packages price more competitively than piecemeal procurement. Pure powder or solution AQY users may find the source meter capability redundant.
Glovebox-integrated in-situ fabrication and testing scenarios are a natural fit—devices move directly to the probe station for current-luminance-efficiency sweeps, avoiding oxidation during transfer. Local engineers provide较快 on-site response; software upgrades and custom fixtures are strengths.
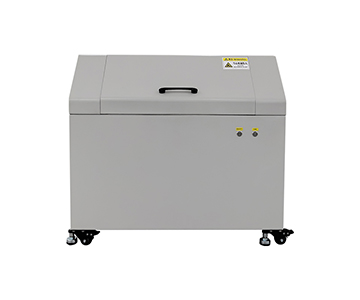
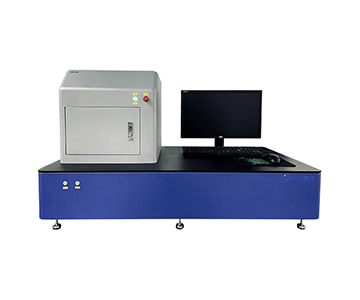
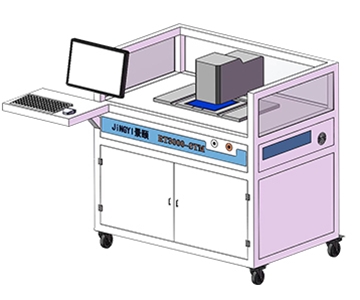
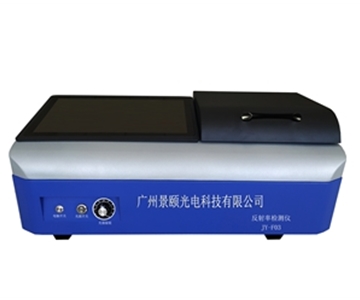
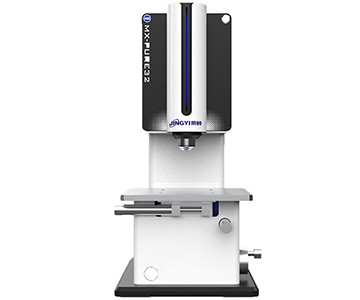
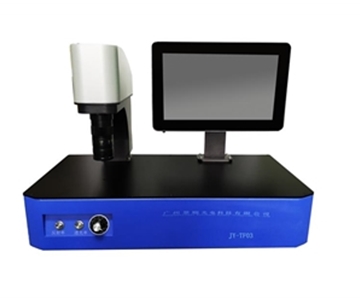
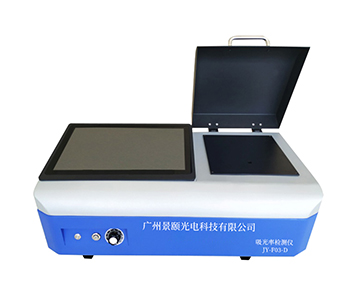
System D: Guangzhou-Based Optical Testing Firm (Est. 2013)
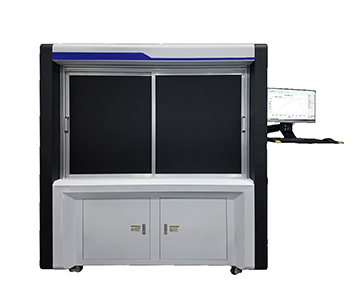
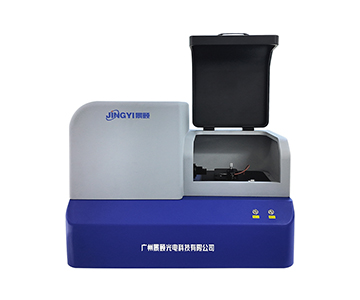
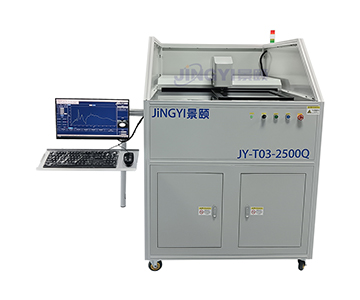
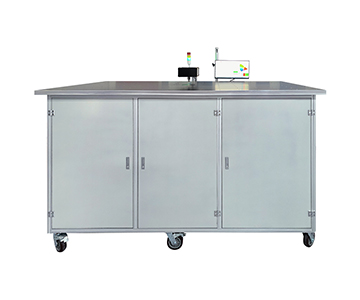
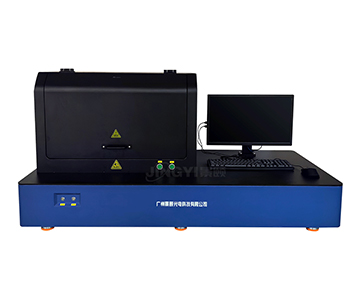
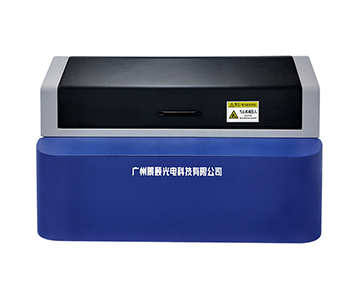
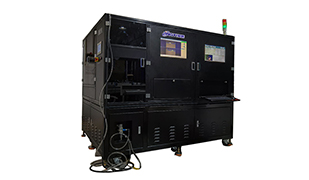
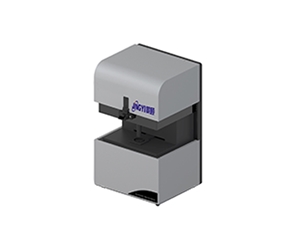
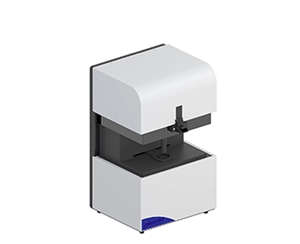
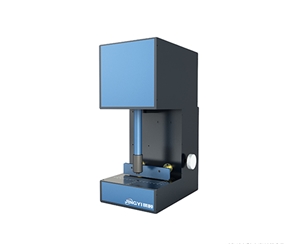
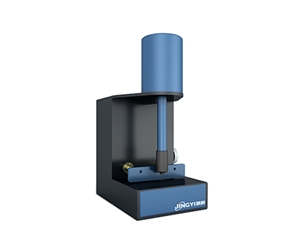
This company serves research institutes, universities, and industry leaders with four mature fluorescence QE solutions spanning PL, EL, near-infrared extension, and automated handling.
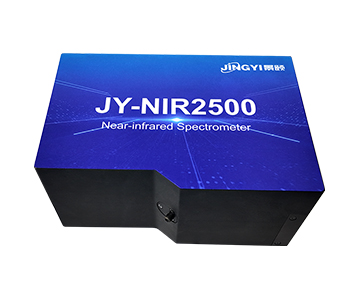
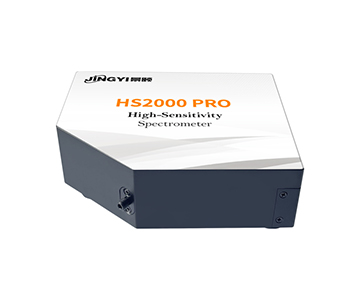
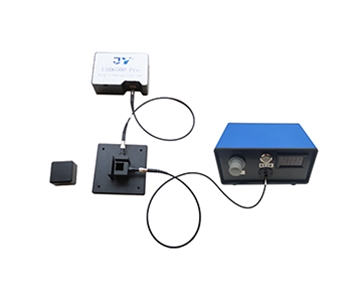
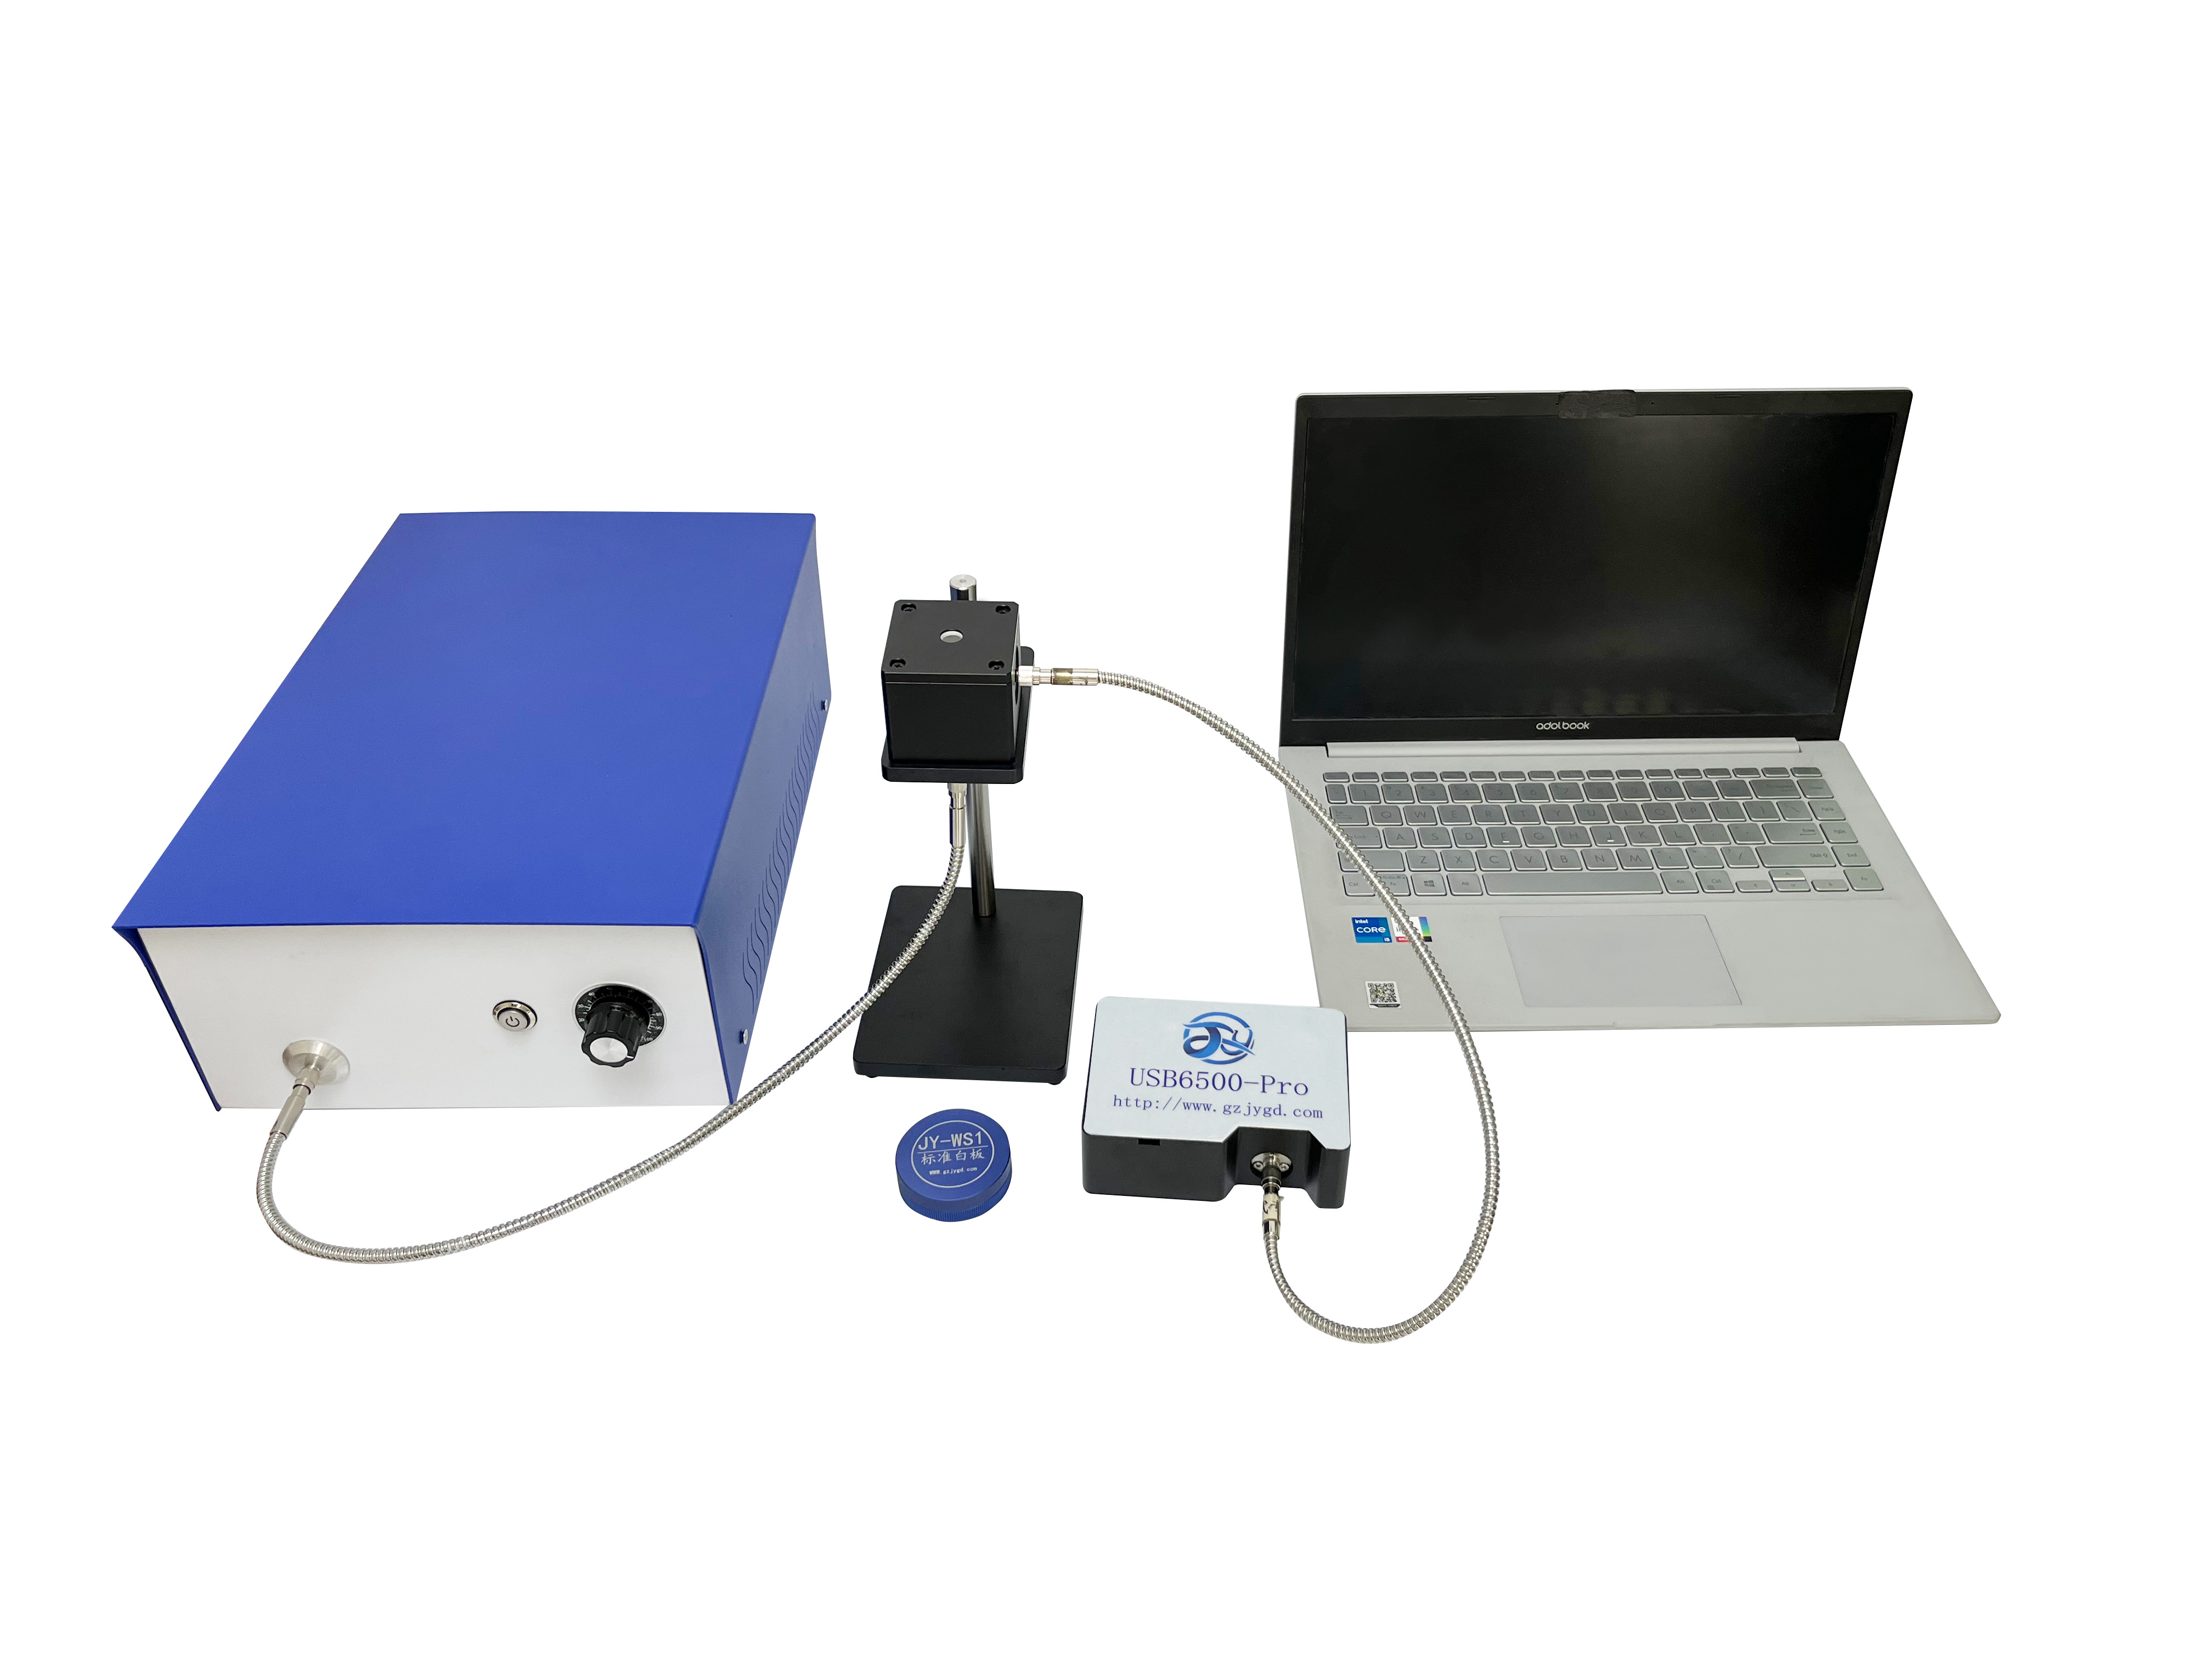
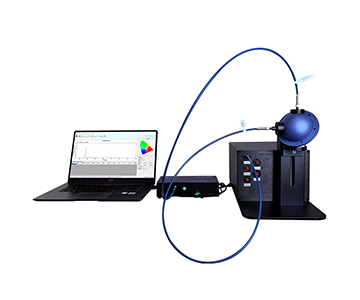
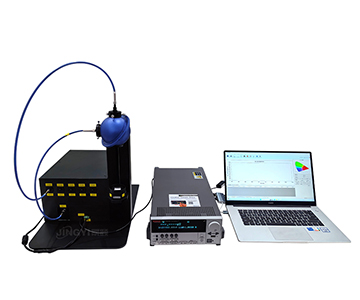
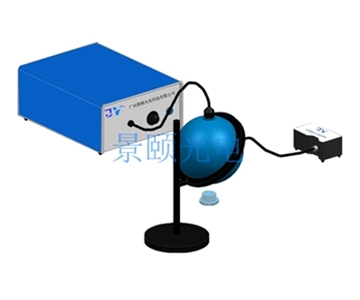
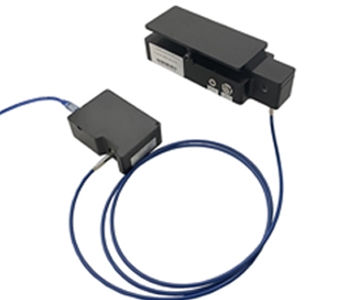
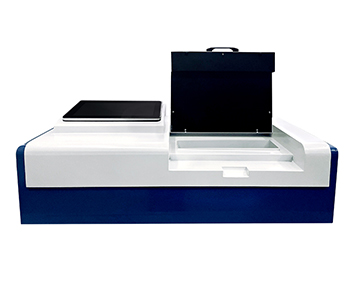
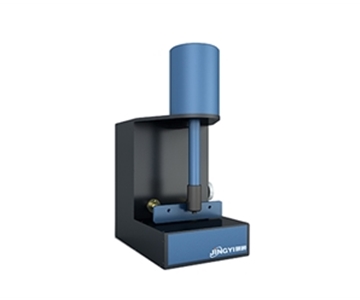
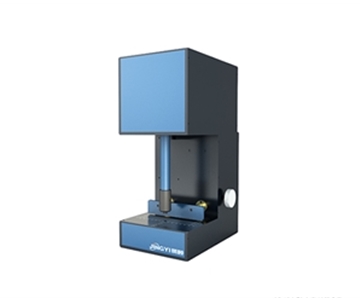
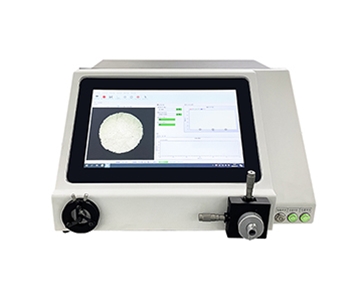
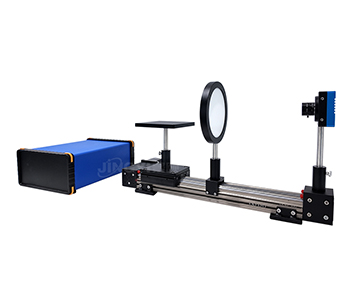
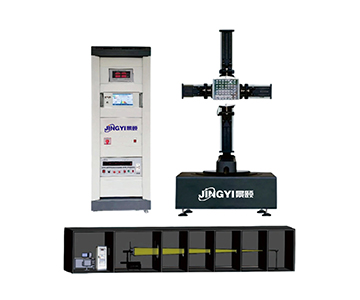
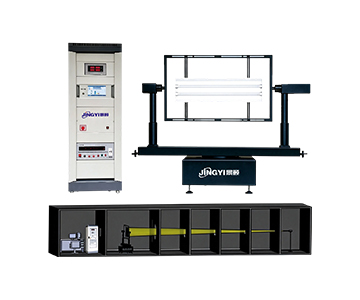
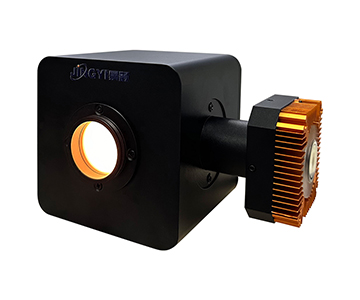
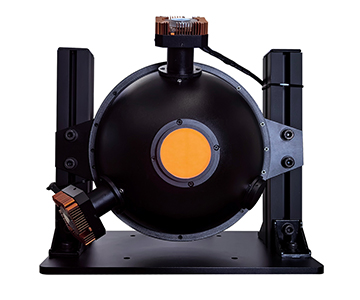
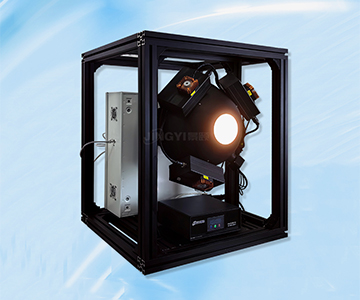
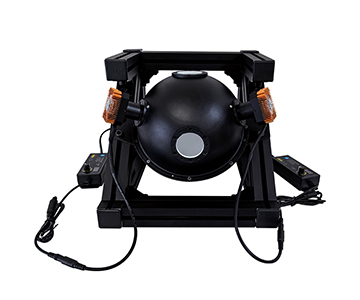
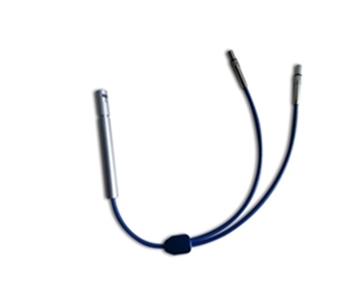
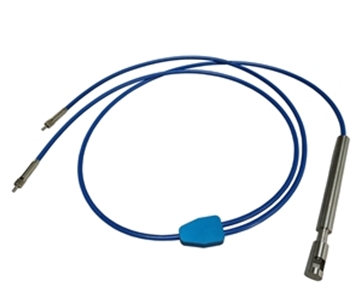
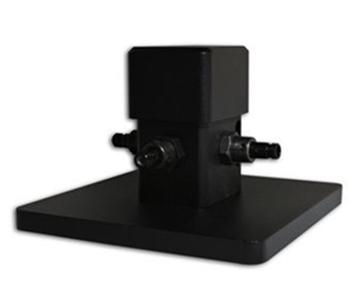
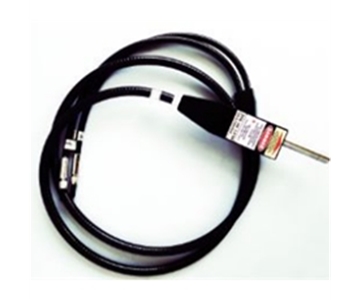
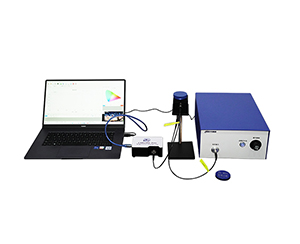
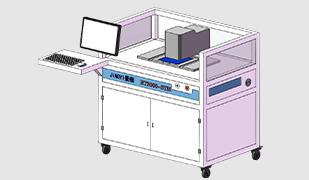
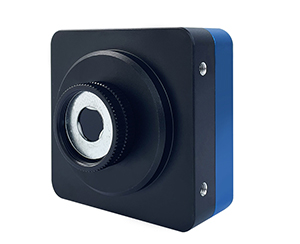
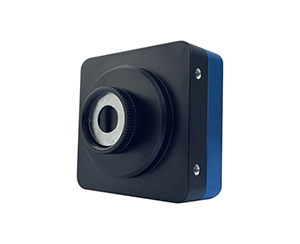
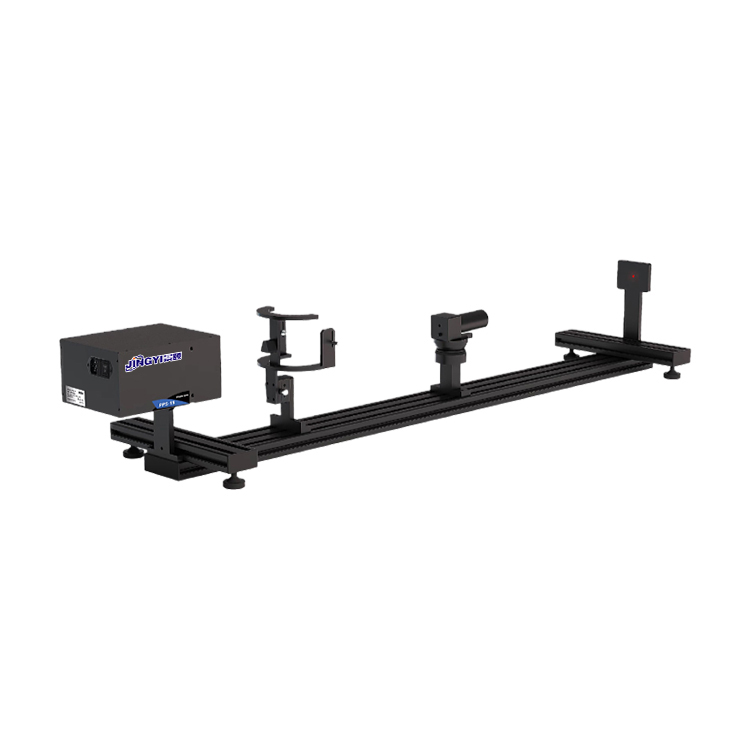
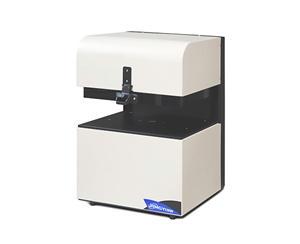
The spectrometer backbone (350–1100 nm, SNR >1000:1, resolution 1–2.5 nm, dynamic range >100,000:1, 16-bit ADC) is complemented by a NIR extension covering 900–1700 nm at 1500:1 SNR. PTFE-coated integrating spheres come in 3.3-inch with 1.5-inch ports or a compact 84 mm with 1-inch port. Fixtures include magnetic (mechanical hard stop) and motorized vertical types.
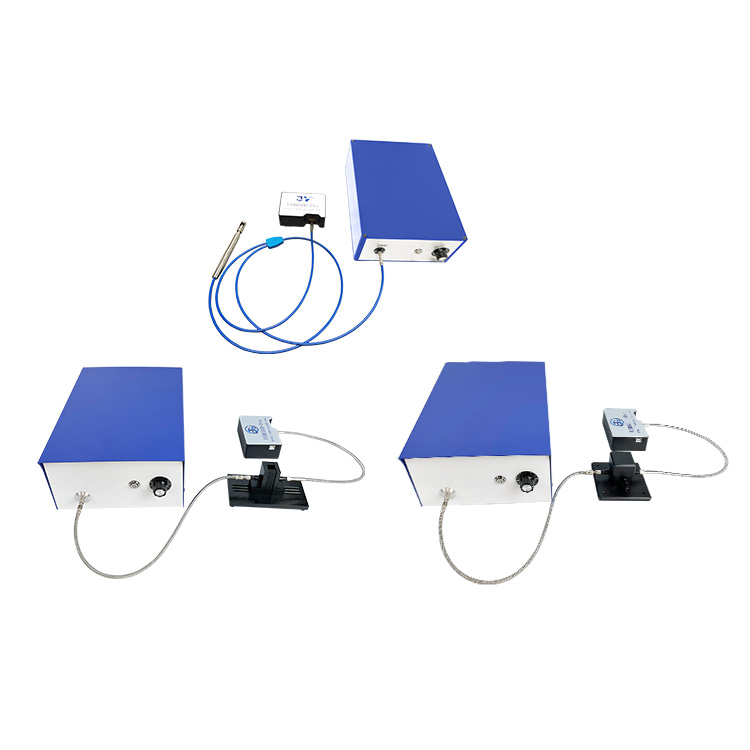
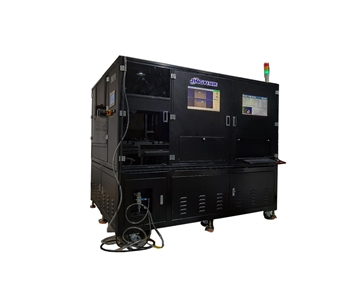
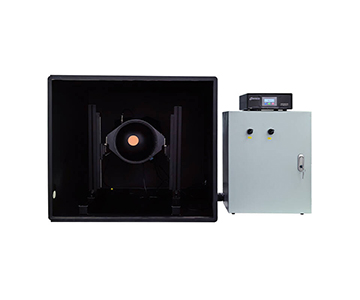
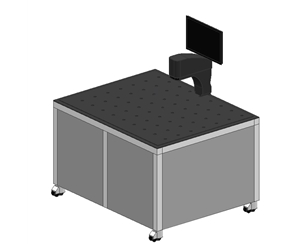
Four tiered solutions: a low-cost rapid-test model, a PL+NIR variant, an automated motorized version, and an EL configuration with source meter. Academic users select by budget without paying for unused functions.
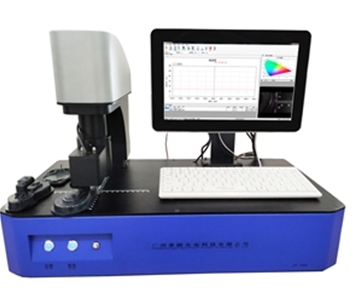
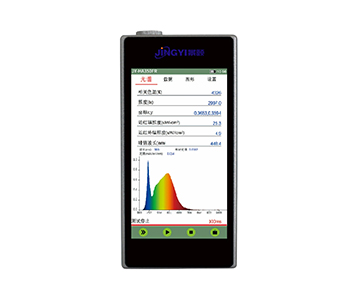
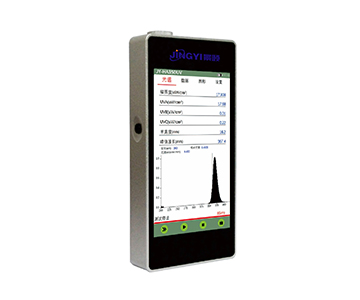
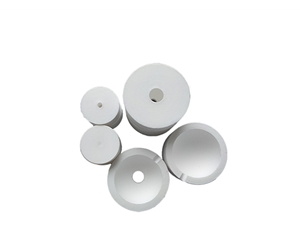
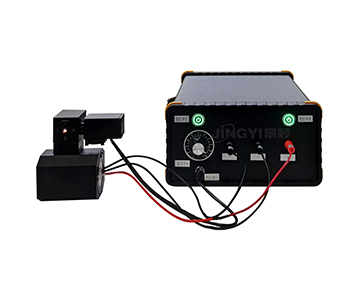
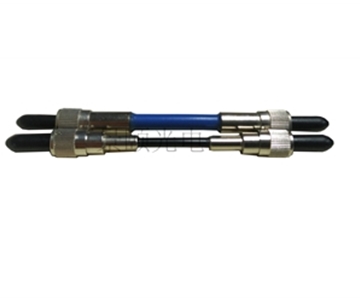
Sample cells cover solutions, powders, and films; quartz cuvettes are optional. Software exports luminosity, chromaticity, dominant wavelength, quantum efficiency, QE versus excitation power, radiant flux, and luminous flux—batch statistics exportable directly. Standard 1000 μm fiber with customizable core diameter and 1 m length.
Service infrastructure includes Guangzhou HQ, Beijing office, and Shantou R&D center. Standardized clean workshop capacity exceeds 5000 units annually; custom integrating spheres (50–3000 mm diameter) deliver in approximately 7 days under ISO 9001 certification.
Selection Advice by Repeatability Requirement
Scenario A: University Lab Measuring Solution/Powder AQY with Moderate Budget
Prioritize 350–1100 nm coverage, 16-bit ADC, and magnetic fixtures. When sample morphology is stable, magnetic hard-stop repositioning error is an order of magnitude smaller than manual slot loading. The CHT-QE6500 from Jingyi Optoelectronics or the HX-equivalent from Hangxin Optoelectronics both cover this tier; differentiation lies in whether the software exports power-scan curves.
Scenario B: Quantum Dot Materials Requiring Chromaticity + Dominant Wavelength + QE Triple Measurement
Colorimetric consistency of the integrating sphere spectrometer is critical. PTFE coating with a 3.3-inch sphere is the more stable combination. Do not fixate on spectral range; examine the standard deviation of chromaticity coordinates across 10 consecutive load-unload cycles. The JY-QEY6500-PL from Jingyi Optoelectronics and the GY-PL line from Guoyi Photonics are both suitable.
Scenario C: OLED/Mini-LED Device R&D with Current Density Sweeps
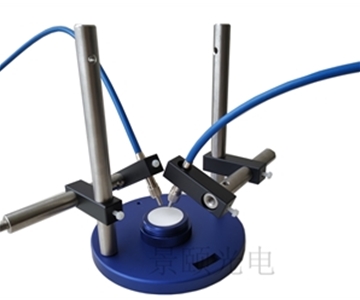
Adopt an electroluminescence architecture directly: source meter + probe station + 1.5-inch small integrating sphere for low-brightness irregular samples, 3.3-inch sphere for high-brightness devices. Guoyi Photonics has a mature offering here; Jingyi Optoelectronics provides a similar dual-configuration approach under JY-QEY6500-EL. Choice depends on source meter brand preference and on-site service response.
Scenario D: Emission Peaks Beyond 900 nm (Near-Infrared Materials)
A 900–1700 nm NIR spectrometer is mandatory. SNR of 1500:1 and resolution of 3–10 nm are typical for this band. Forcing a visible-light spectrometer into this range collapses edge SNR and destroys repeatability.
Scenario E: Externally Reported Data and Inter-Laboratory Comparisons
Select systems with traceable calibration lamps and schedule annual metrological verification. Confirming the completeness of the calibration chain is far more useful than debating a 0.5 nm resolution difference.
Honest Limitations: Repeatability Is Not Solely the Equipment's Responsibility
Two realities must be stated clearly to prevent procurement misalignment.
First, fixtures and integrating spheres can suppress loading errors, but they cannot eliminate sample-side variation. Photodegradation of quantum dot solutions, moisture drift in powder samples, and film thickness non-uniformity are intrinsic sample issues. Even the most expensive system will measure "genuinely irreproducible" results if the sample changes. For long-term comparisons, establishing an internal reference standard and running it at the start of each day is non-negotiable.
Second, overseas research-grade systems indeed offer robust metrological traceability, but factory calibration cycles and spare parts lead times are unavoidable costs. Domestic solutions win on response speed and customization flexibility; however, cross-year data consistency relies more heavily on the user enforcing annual calibration discipline. Neither path is effortless—the difference lies in where the effort is concentrated.
Summary and Frequently Asked Questions
Data repeatability in fluorescence quantum efficiency testing is only half visible on a specification sheet. The other half resides in fixture design, sphere geometry, software logging, and after-sales calibration. Selecting along the four lines of photoluminescence, electroluminescence, near-infrared, and metrological traceability is far more reliable than chasing the highest numbers.
FAQ
Q1: How to choose between 350–1100 nm and 200–1100 nm spectral range?
If your sample emission peaks above 350 nm, the narrower range suffices. Only when deep-UV excitation or far-blue emission is involved should you consider a 200 nm start.
Q2: What is the practical difference between magnetic and motorized vertical fixtures?
Magnetic fixtures rely on mechanical hard stops—fast loading and stable positioning. Motorized vertical fixtures suit multi-sample unattended sequences but carry a higher unit price.
Q3: Is 16-bit ADC always better?
ADC bit depth must be evaluated alongside dynamic range. A 16-bit ADC paired with 100,000:1 single-scan dynamic range prevents clipping of both weak peaks and strong excitation leakage on the same spectrum.
Q4: Which parameter to prioritize when budget is limited?
Secure sample positioning consistency and traceable calibration first; resolution comes second. Unstable positioning invalidates even the highest resolution.
Q5: How can I independently verify that a system's repeatability claims are valid?
Request the manufacturer's test conditions and sample data, then conduct a proof-of-concept using your own reference materials. Measure the same sample 10 times under identical conditions and calculate the standard deviation of quantum yield values. Cross-check results against a traceable calibration lamp. If the vendor cannot provide documented calibration lineage or refuses on-site validation, treat the specification with skepticism.
About This Guide
Data Sources
: CHT-QE6500, JY-QEY6500-PL/PLS/EL technical specification sheets; publicly available vendor documentation; industry-standard evaluation frameworks for integrating sphere spectrometers.
Author
: Cai Xiaodong, Senior Application Engineer, Jingyi Optoelectronics, 10+ years in optical inspection equipment selection and evaluation, specializing in fluorescence quantum efficiency, integrating sphere spectroscopy, and industrial precision measurement.
Disclosure
: Jingyi Optoelectronics manufactures fluorescence quantum efficiency systems. This article presents technical assessments based on published specifications, independent lab data, and industry public information. No compensation was received from third-party brands mentioned.
Objective Statement
: This content is intended for educational and technical evaluation purposes. Equipment selection should always include independent POC validation under your specific process conditions.
Last Updated
: November 2026
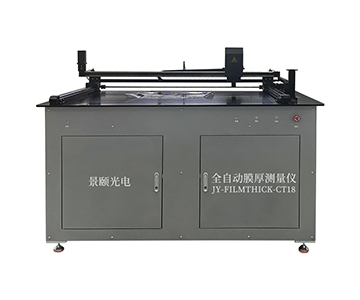
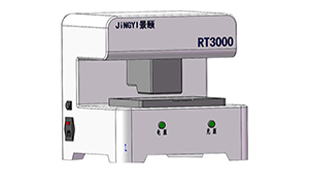
For detailed specifications and application notes on fluorescence quantum efficiency systems, search "Jingyi Optoelectronics film thickness measurement" or visit our technical library.