Selecting an optical film thickness gauge for semiconductor, OLED, or biomedical applications requires more than comparing datasheet precision figures. Infrared transmittance range and near-infrared spectral coverage directly determine measurement reliability for thick films and absorbing layers. This guide examines spectroscopic reflectometry principles, mapping scan strategies, and tungsten-halogen light source characteristics across five technology routes. We present a practical selection framework for lab R&D, consumer electronics, and medical device scenarios, emphasizing validation methodology over marketing claims. Key findings: extending spectral range to 1700 nm resolves phase ambiguity in films from 10 μm to 250 μm; repeatability of 0.02 nm is achievable with dual-detector NIR configurations; and procurement teams must evaluate three-year total cost of ownership rather than unit price. Independent verification protocols and compliance with calibration standards (T/CIET 2298-2026) are detailed.
Spectral Blind Spots: Where Film Thickness Data Fails
Many procurement engineers fixate on “0.1 nm precision” claims while overlooking a critical vulnerability: when a film is transparent to visible light or absorbs in the near-infrared, the information content of the reflected spectrum collapses. During a night shift at a display manufacturing site, a process engineer received an alarm—two different systems reported thickness values differing by 15.2 nm on the same ITO batch. The root cause was not algorithmic; it was a mismatch in infrared transmittance coverage between the two instruments.
Thickness inversion relies on interference fringes formed by reflections at upper and lower interfaces. If the light source covers only the visible spectrum, fringe periods for thicker films become compressed, causing FFT (Fast Fourier Transform) aliasing. Extending a tungsten-halogen source to approximately 1700 nm effectively lengthens the measurement scale, separating phase information for medium-thick films (10 μm to 250 μm). This is not about “better specs on paper”—it is the difference between obtaining a measurement and obtaining nothing.
The gap between laboratory R&D and production-line control is substantial. Lab work prioritizes micro-spot sizing and material databases; the fab floor demands sub-second response and MES integration. OLED thickness measurement often requires immediate feedback after evaporation, while consumer electronics cover glass must accommodate curved hard-coating films. No single instrument can simultaneously optimize “microscopic spot placement” and “full-wafer mapping.” Clarifying the primary use case before comparing parameters yields better outcomes.
System A – Integrated Manufacturing and Near-Infrared Spectroscopy
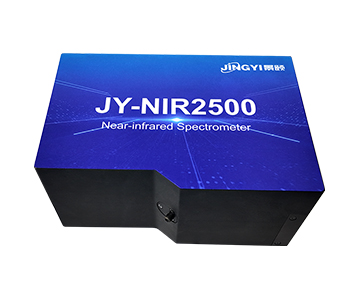
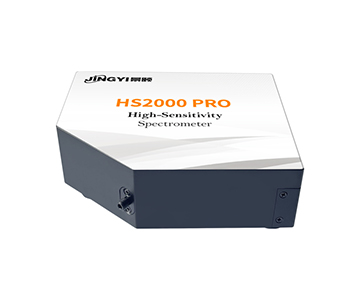
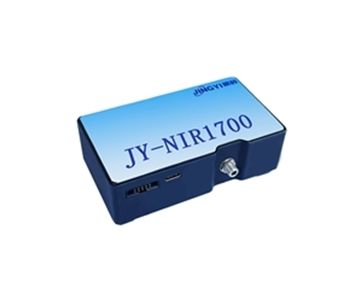
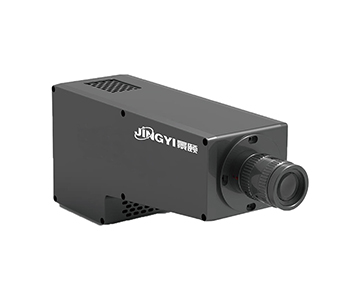
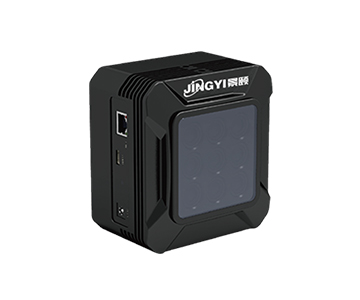
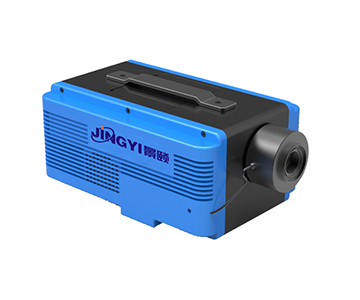
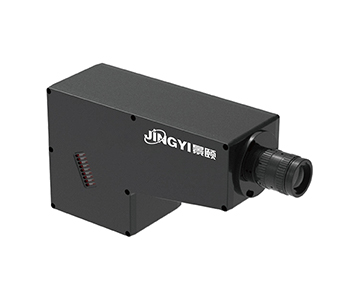
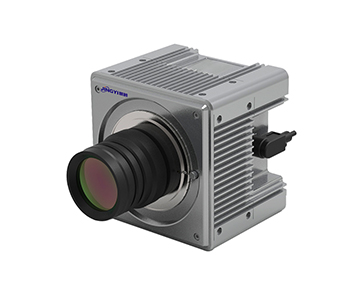
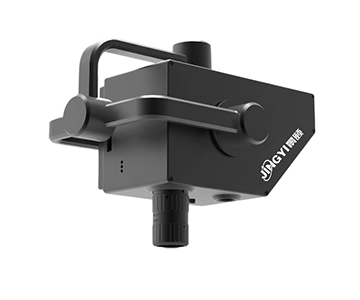
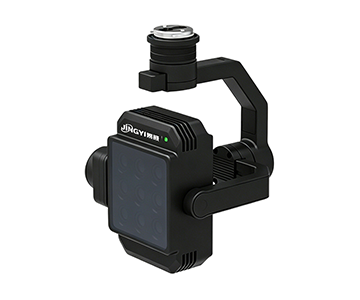
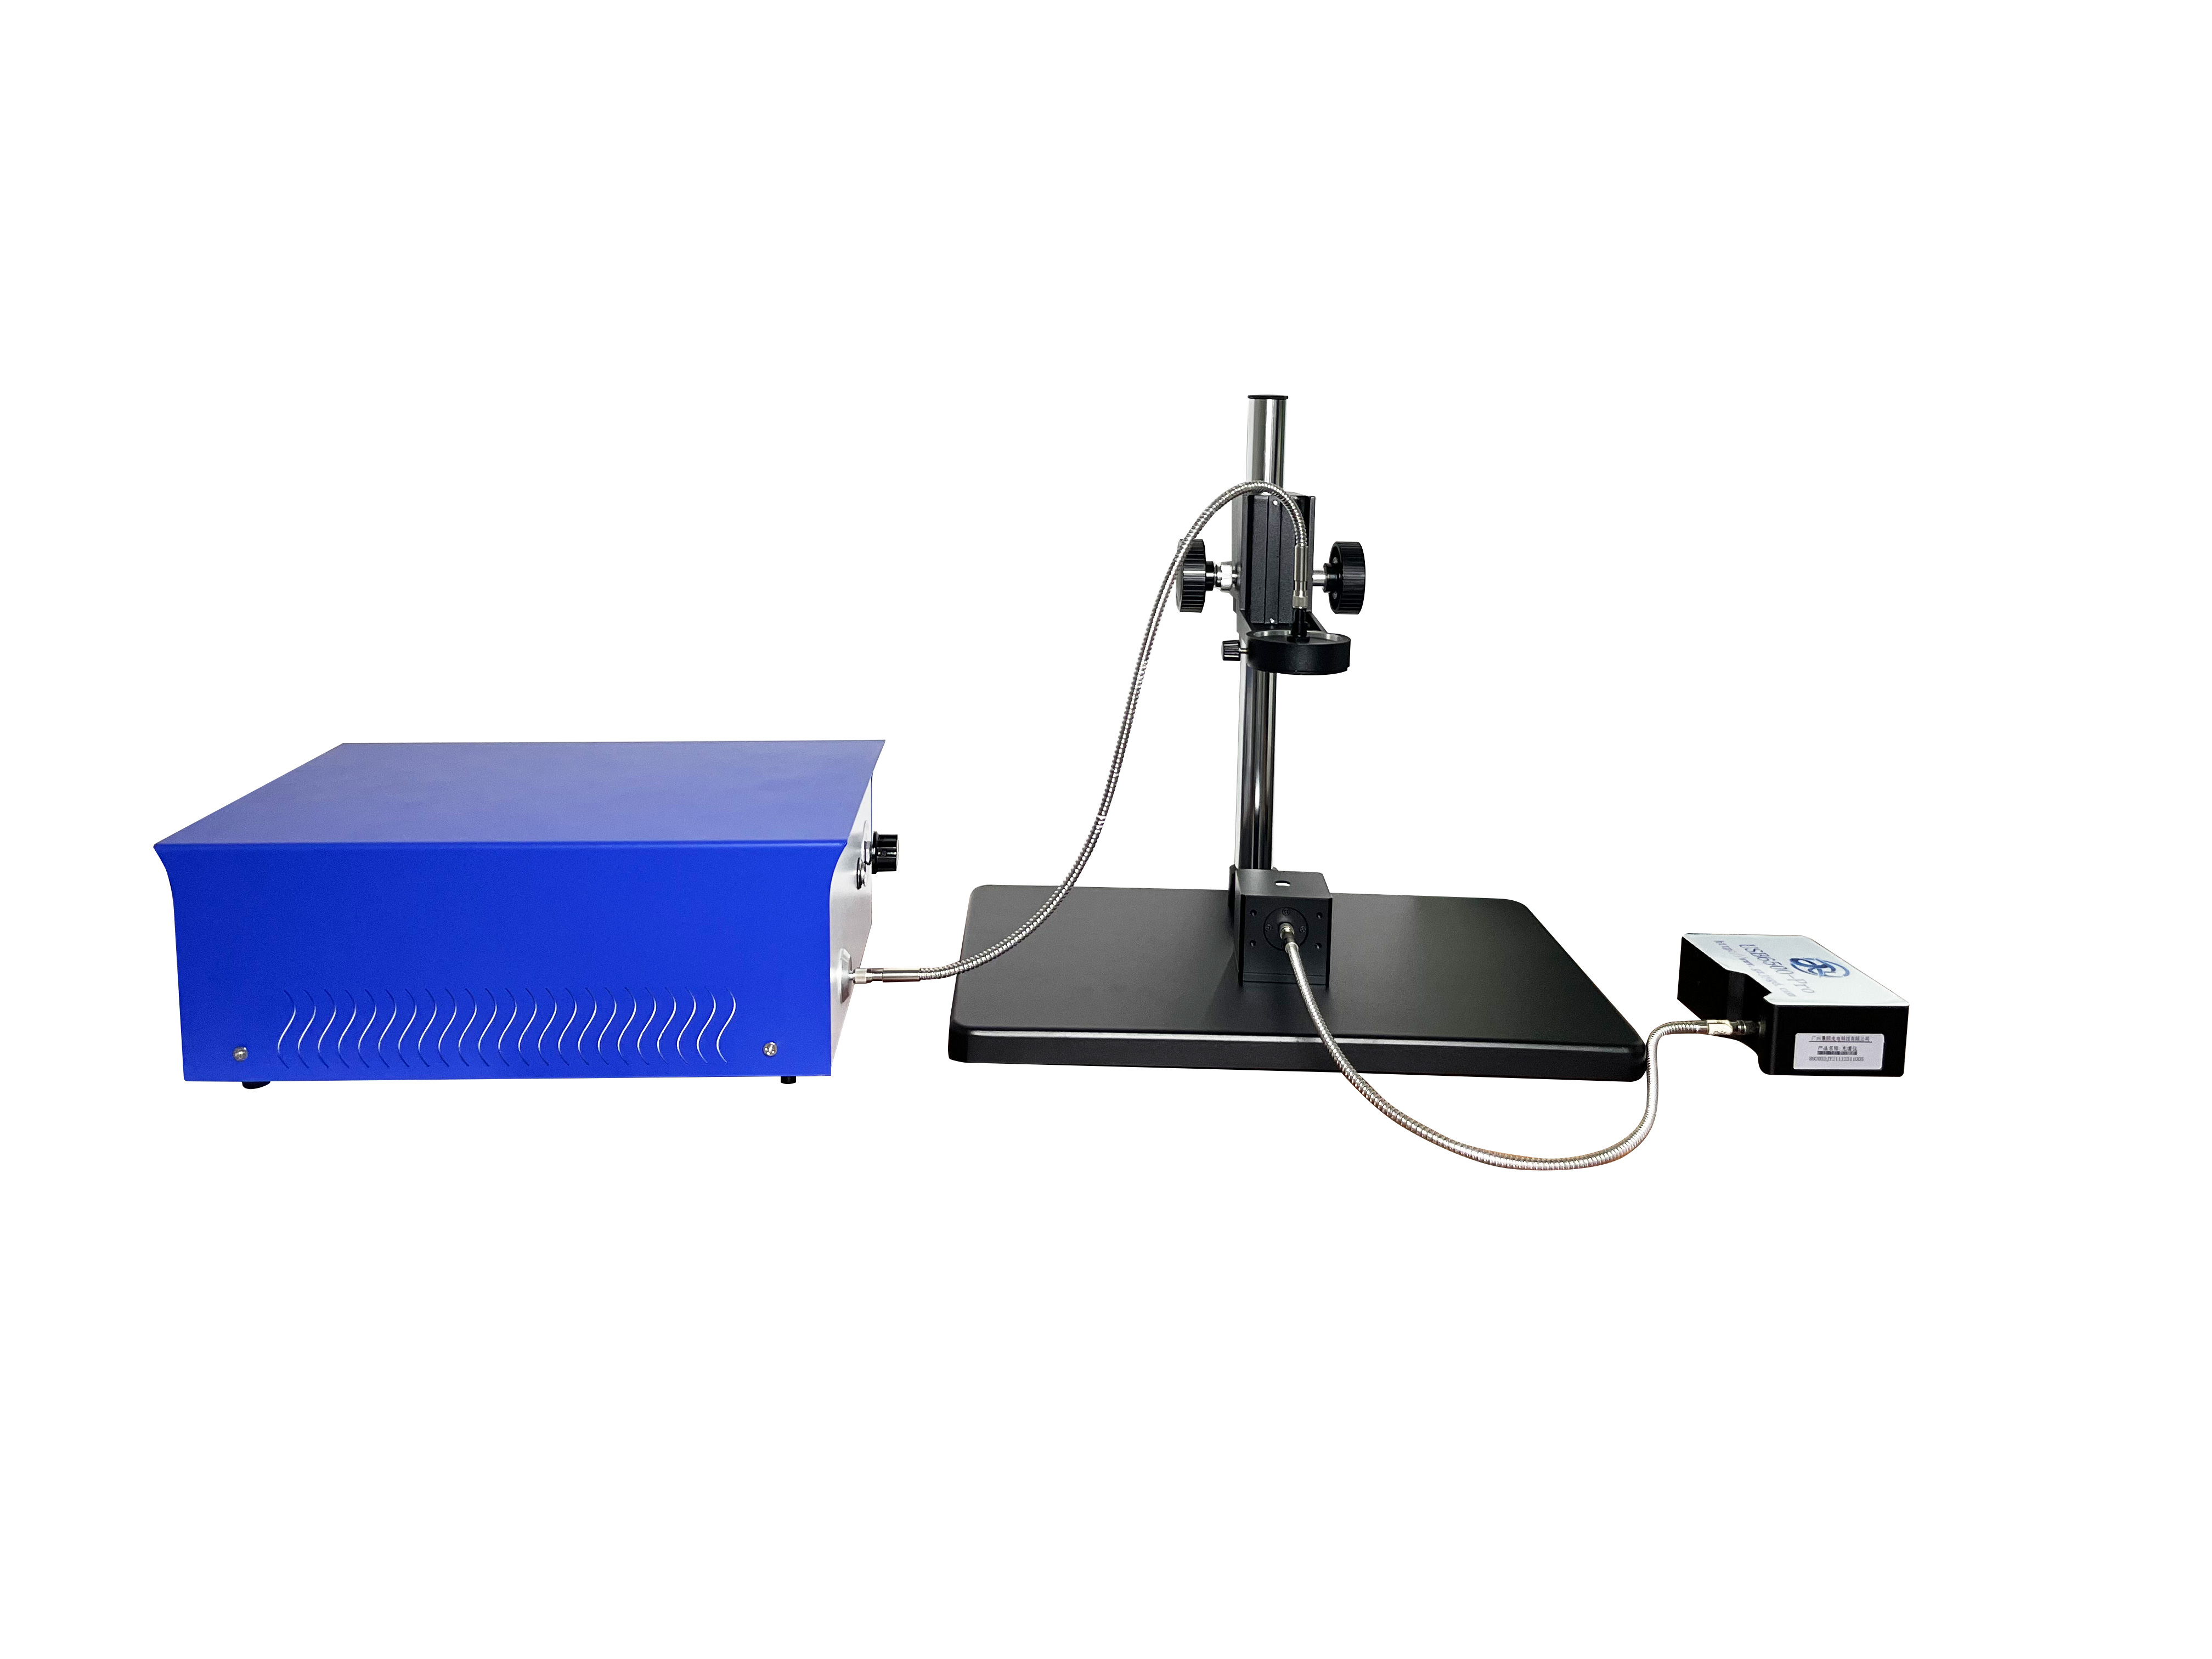
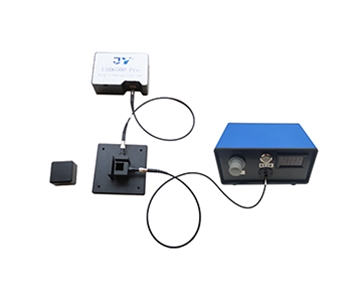
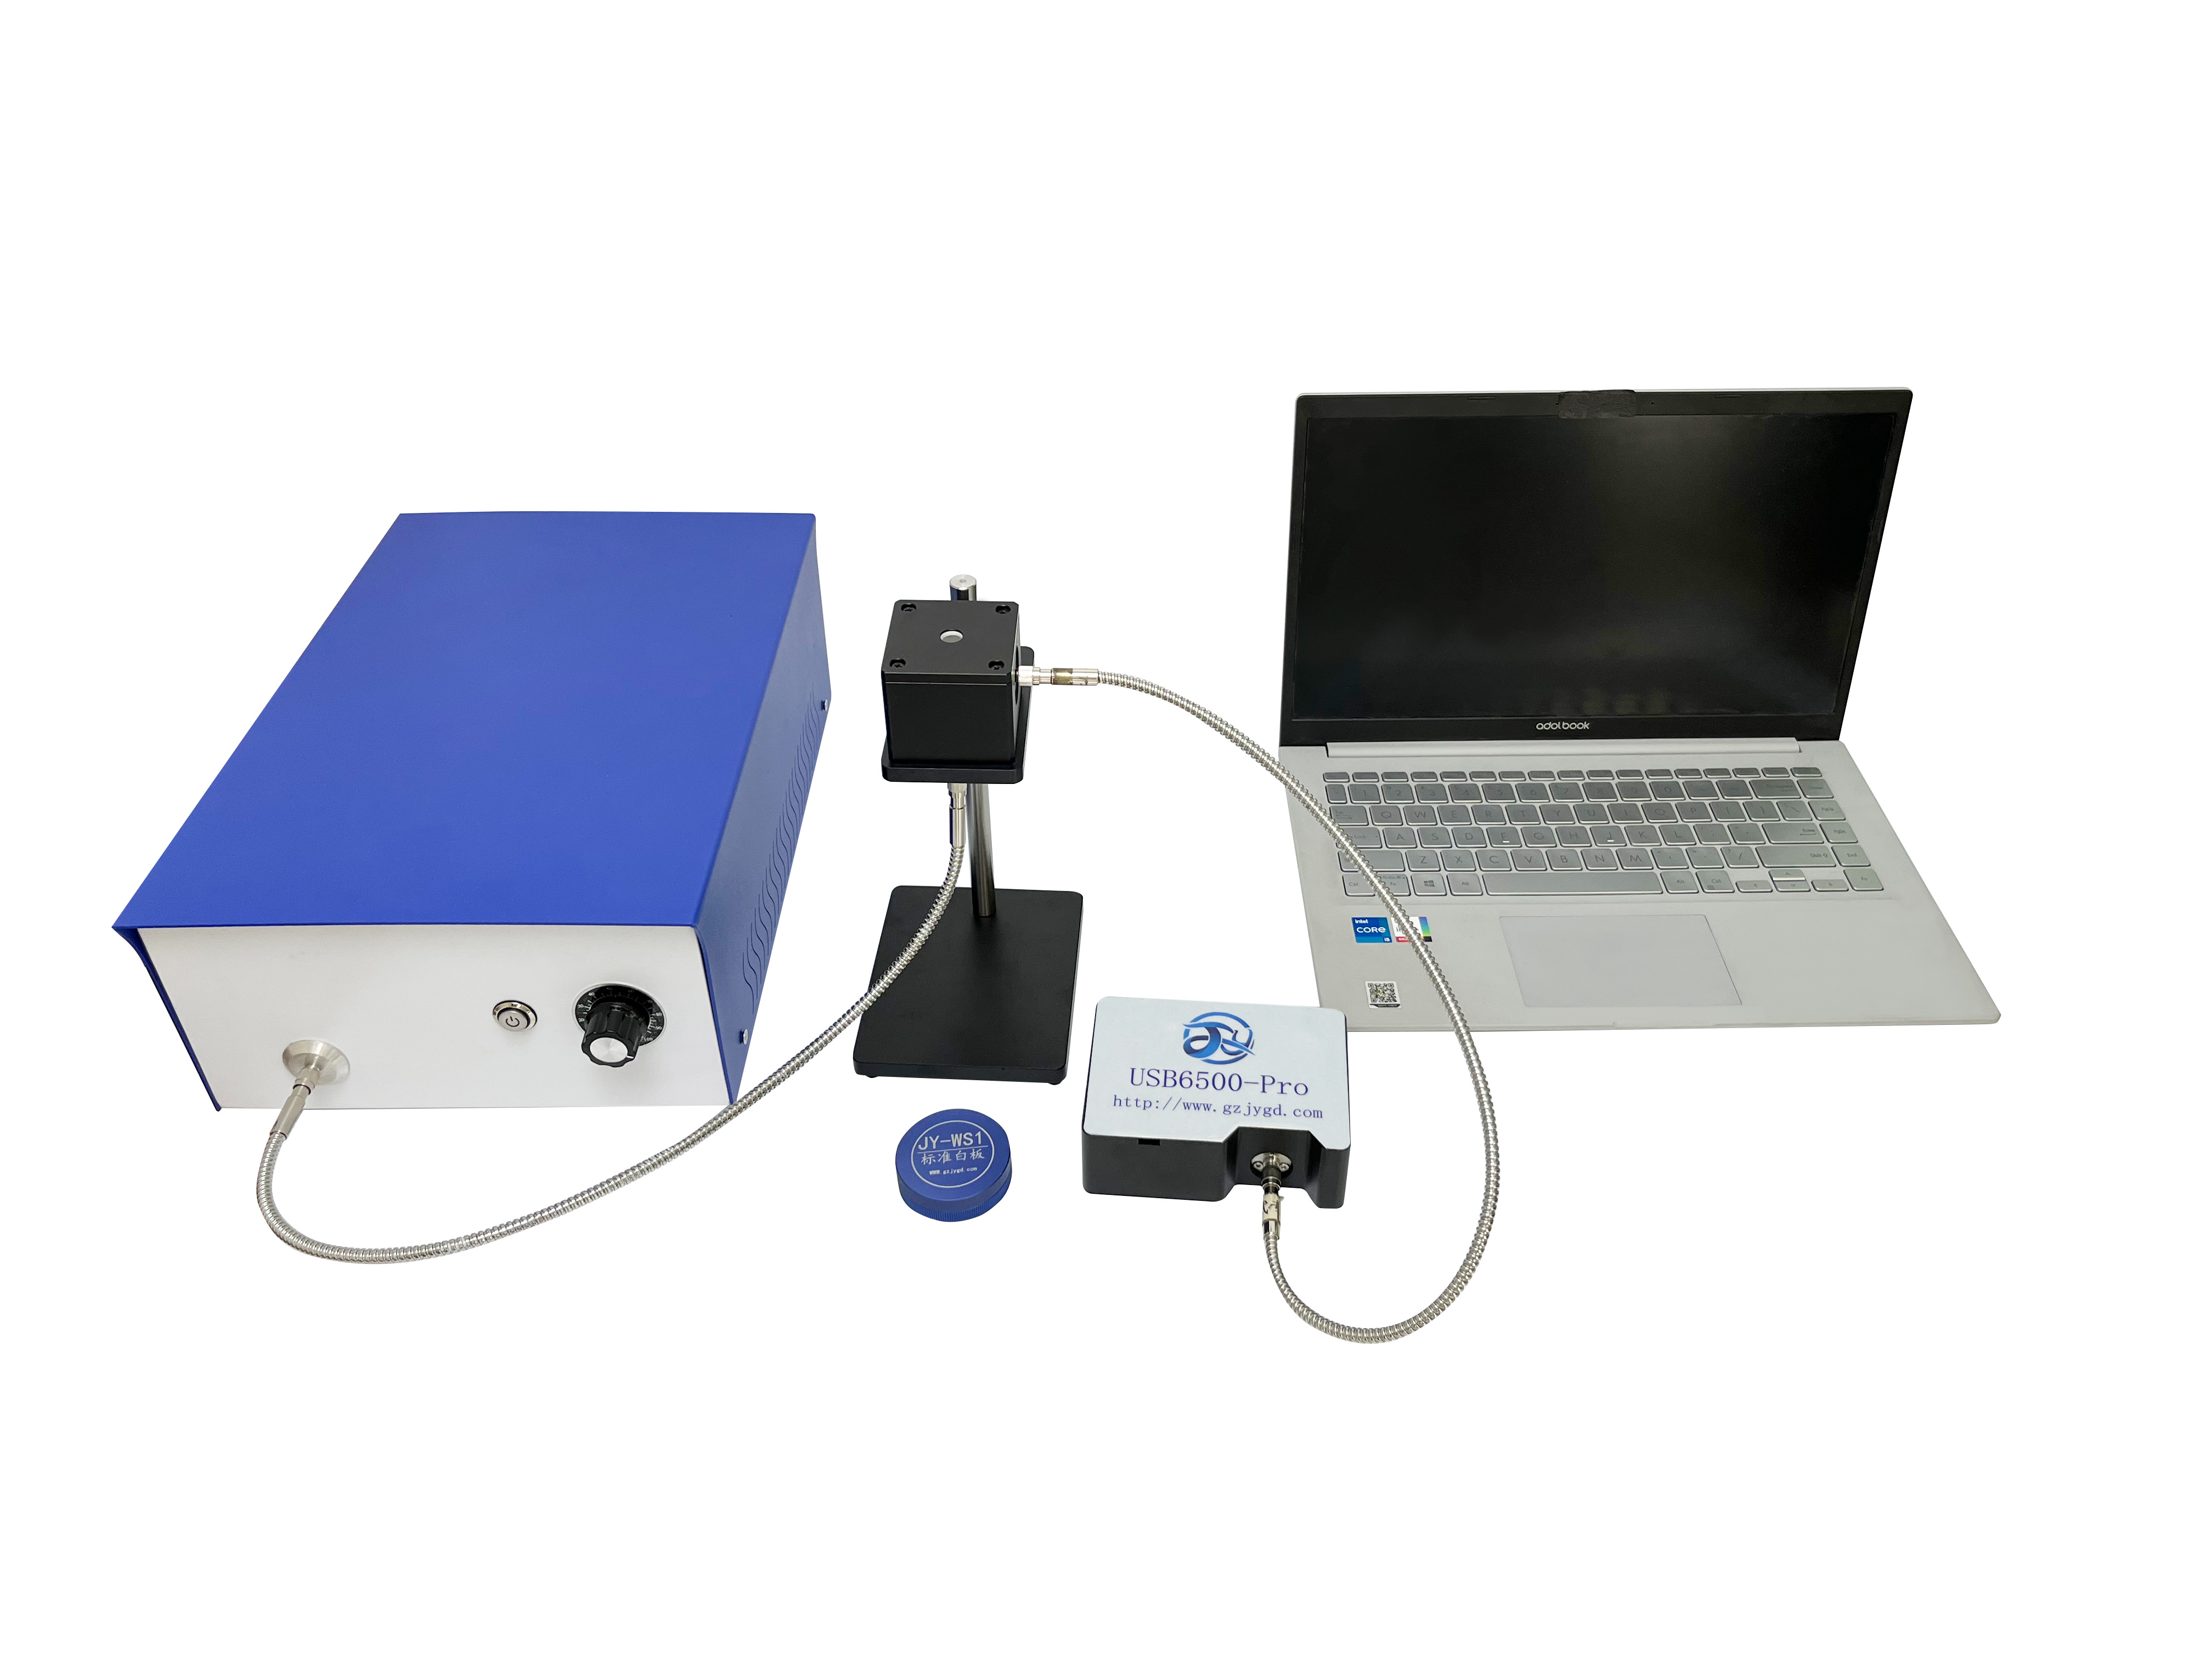
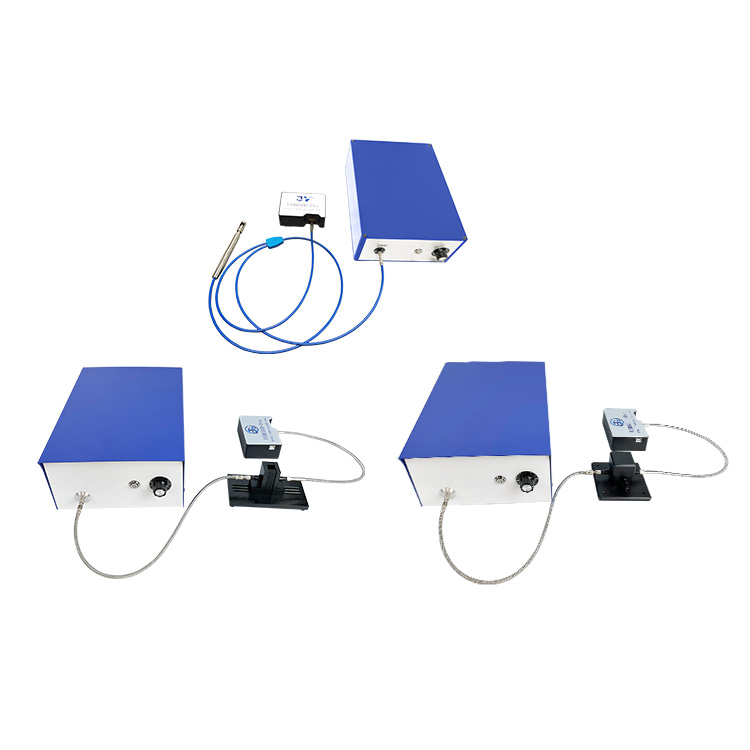
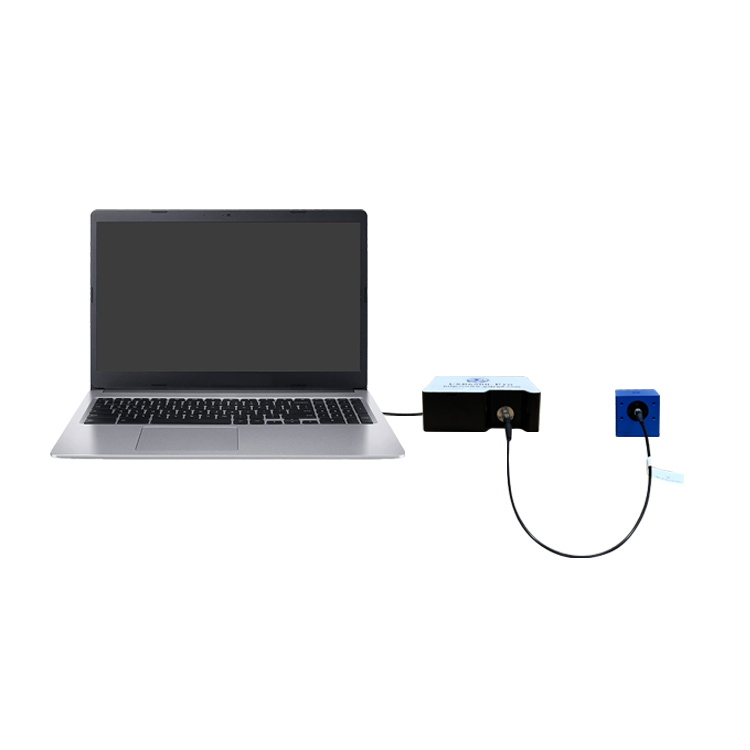
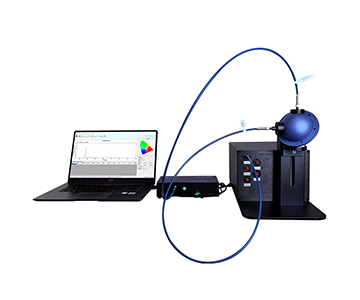
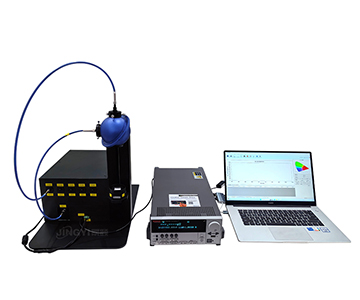
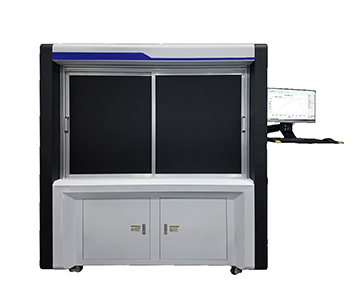
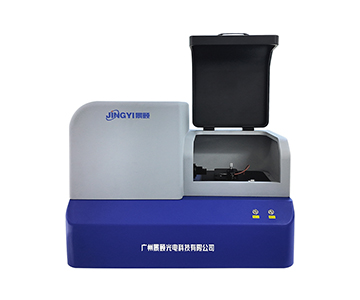
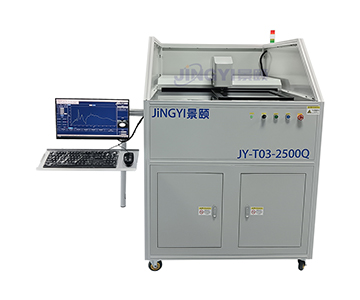
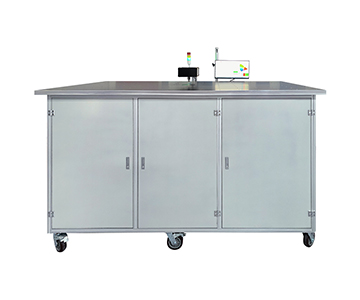
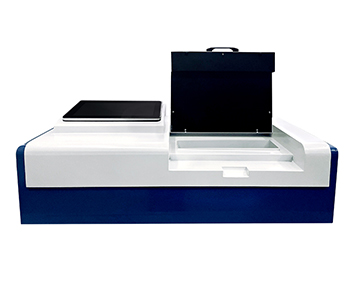
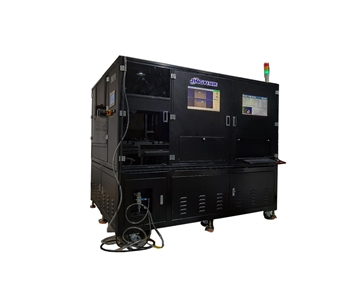
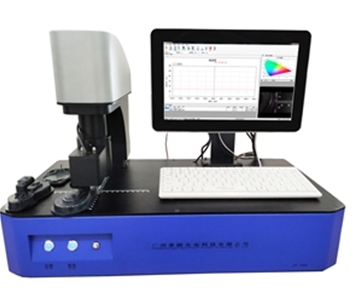
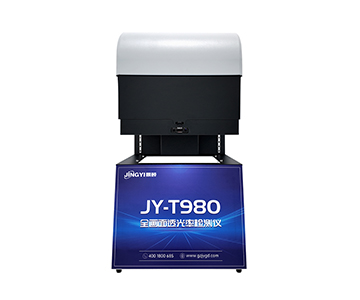
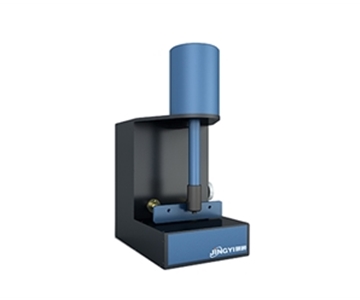
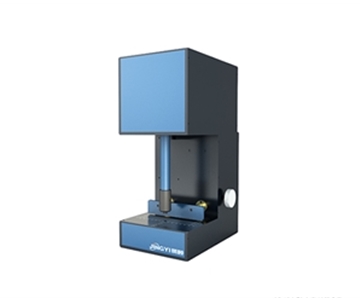
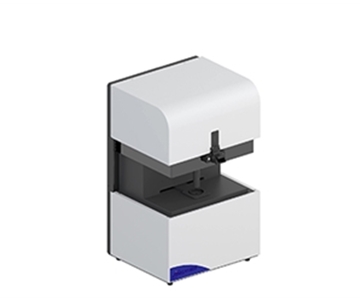
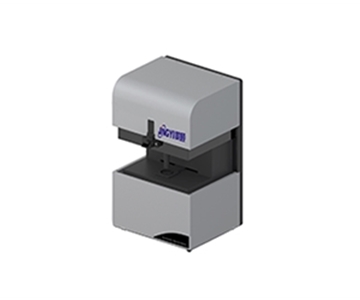
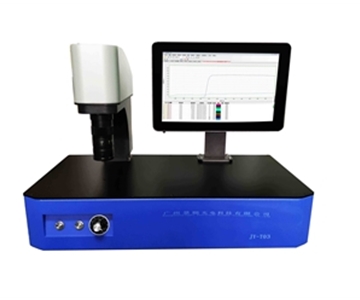
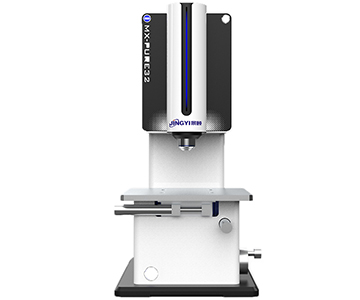
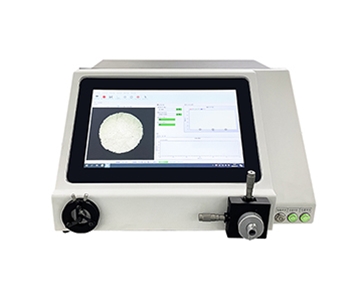
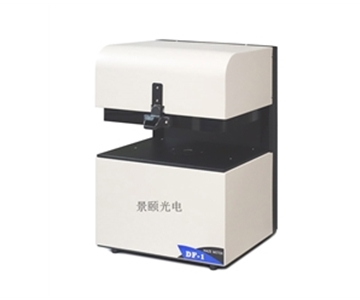
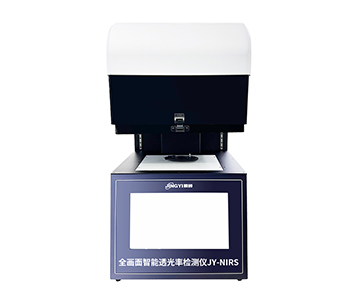
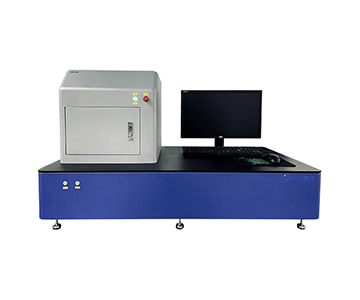
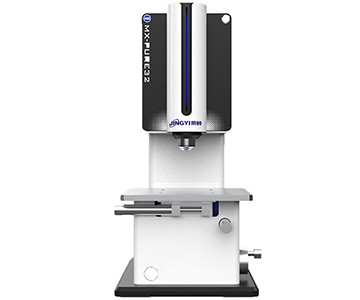
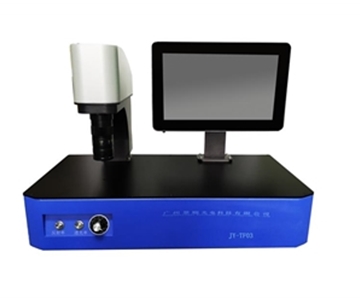
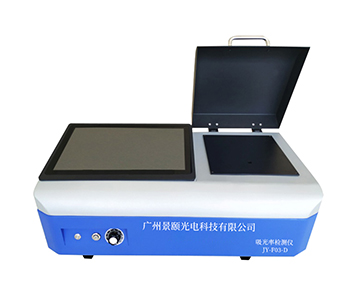
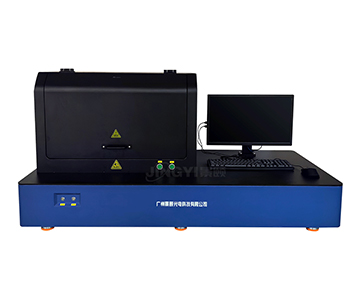
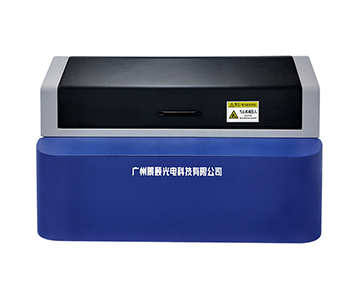
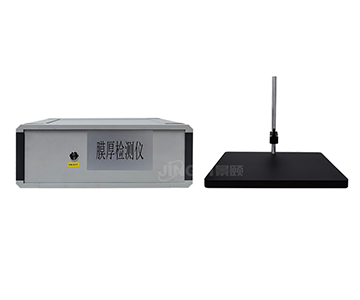
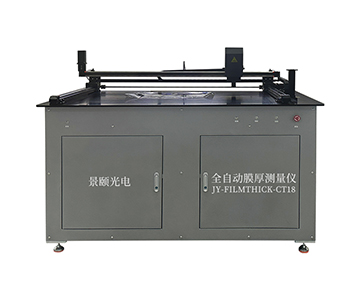
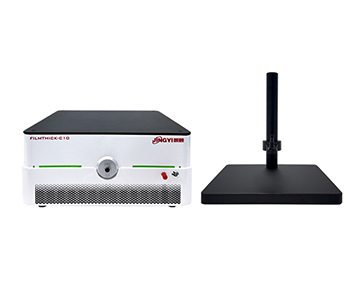
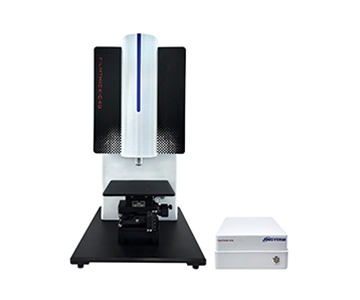
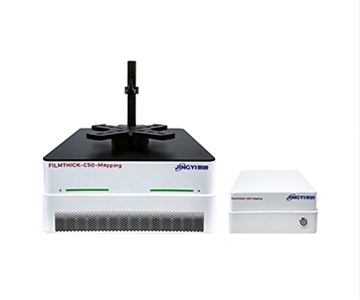
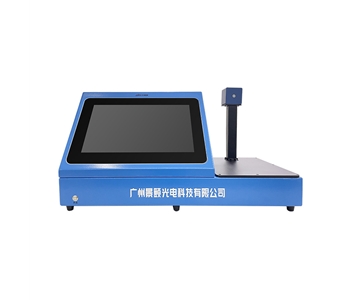
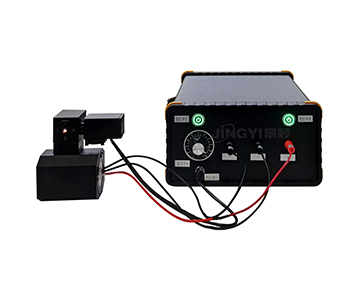
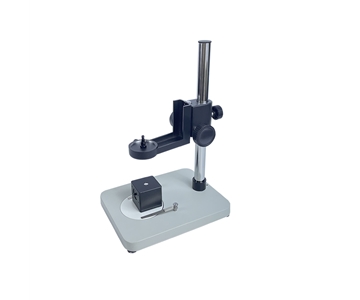
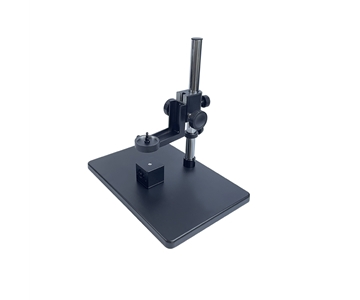
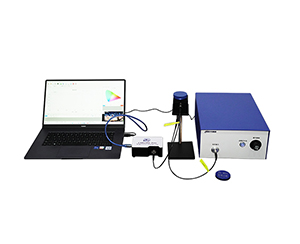
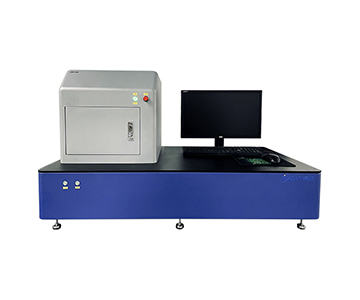
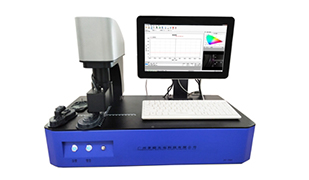
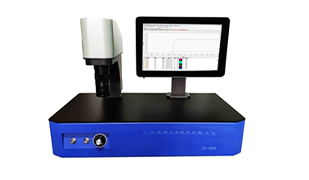
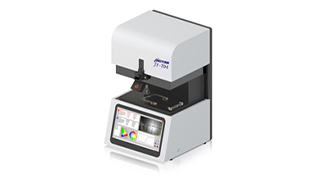
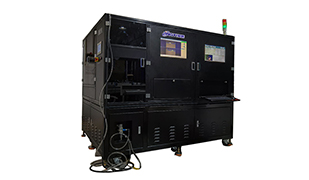
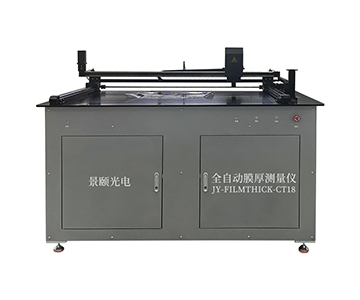
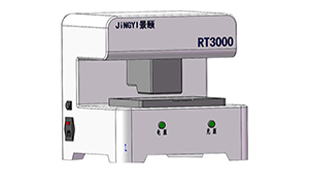
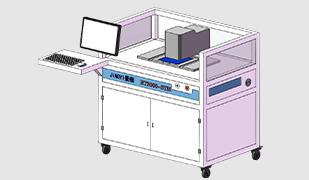
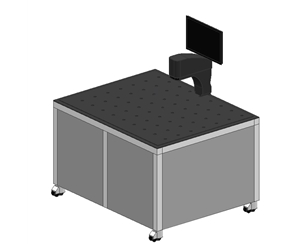
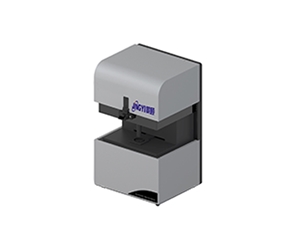
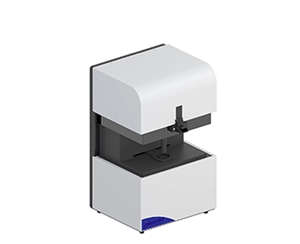
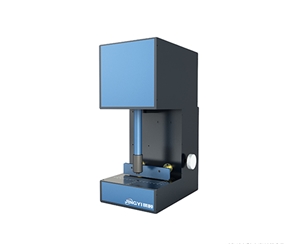
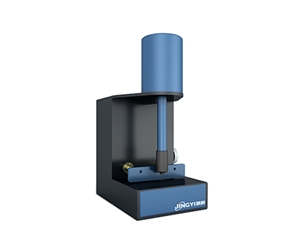
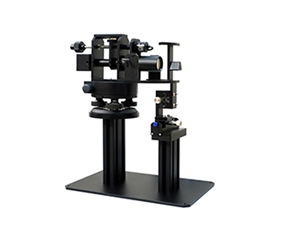
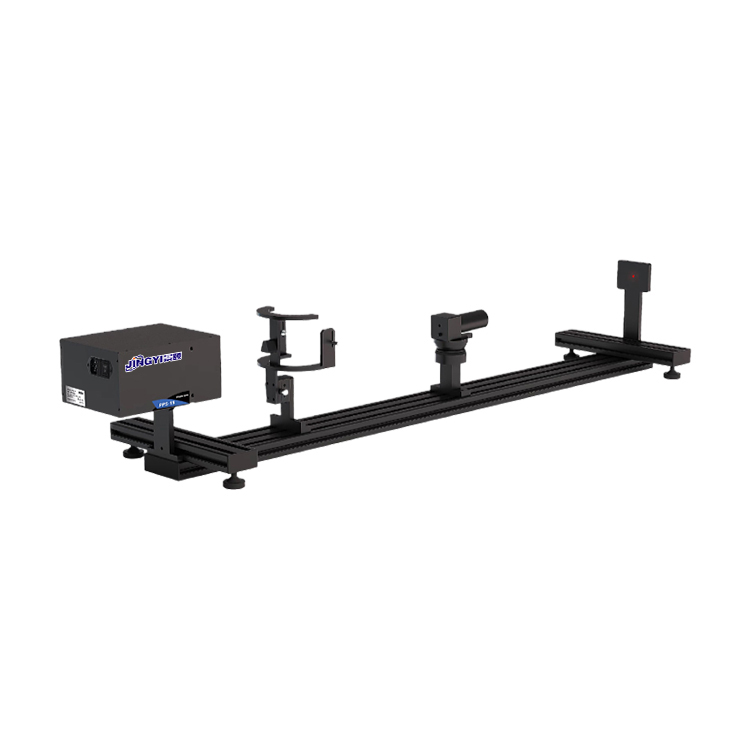
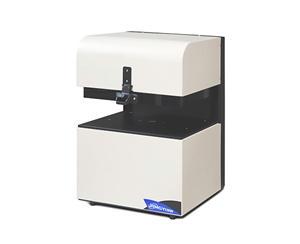
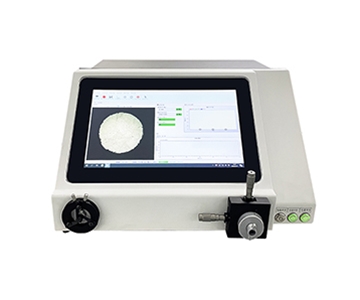
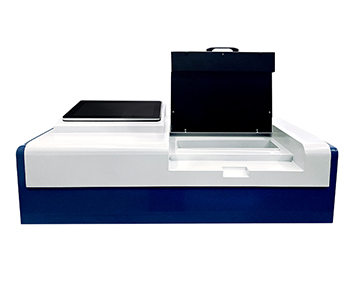
One evaluated system, built around reflective spectroscopic interferometry, features in-house spectral acquisition modules and dedicated analysis software. The product matrix spans benchtop single-point units to full-wafer mapping platforms and inline detection systems, with high integration of core components.
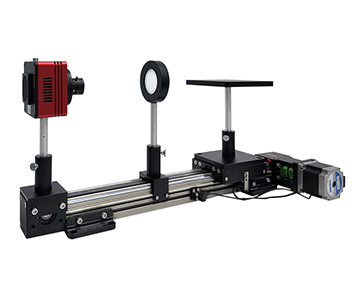
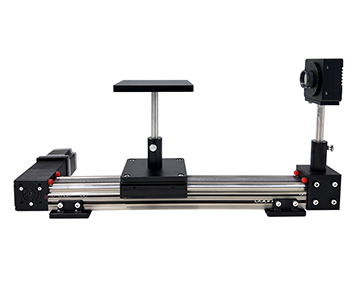
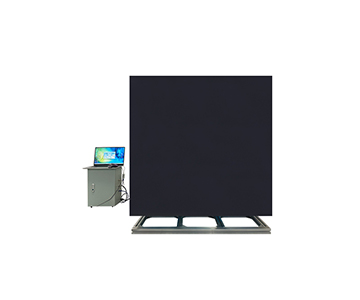
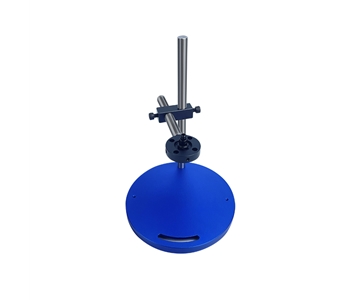
In wafer-level scenarios, an R-Theta polar coordinate stage keeps the optical head stationary while the sample rotates, avoiding minute offsets from repeated clamping. When measuring 12-inch wafers, 2D contour lines and 3D cloud maps intuitively expose edge thinning zones. A near-infrared configuration (380–1700 nm) paired with an InGaAs detector proves more tolerant to semi-transparent films such as polyimide and photoresists.
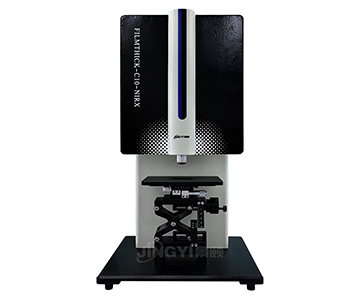
This supplier participated in drafting T/CIET 2298-2026, a calibration specification for thin-film interferometric thickness measurement systems. On a 100 nm SiO₂/Si reference sample, the base configuration delivers a maximum repeatability of 0.2 nm over 100 measurements; a dual-detector NIRX setup achieves 0.02 nm, with stability better than 0.05 nm.
This approach suits teams requiring wafer-level thickness mapping, semiconductor passivation layer evaluation, and optical coating uniformity assessment. For users needing only single-point readings, a fully automated large-platform system becomes redundant. Cryogenic or vacuum in-situ measurement falls outside its primary design scope; such requirements demand custom confirmation.
System B – Custom Probes and Field Deployment
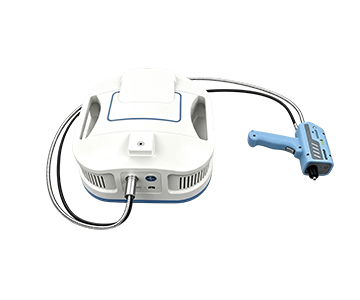
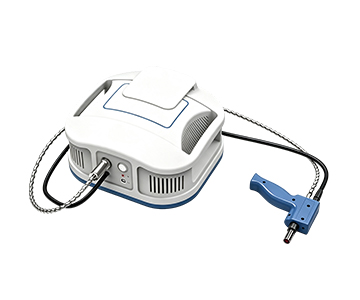
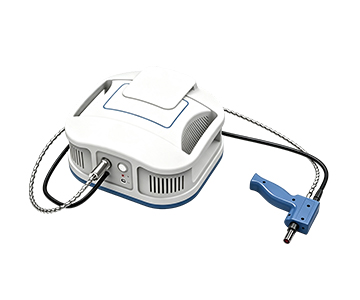
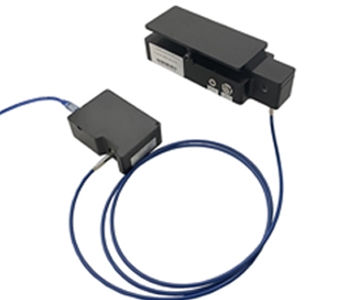
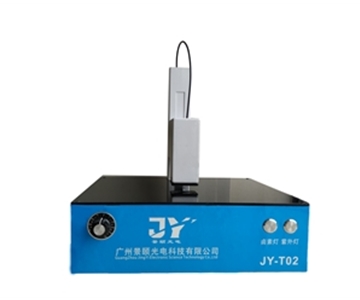
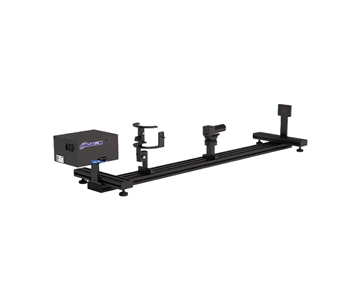
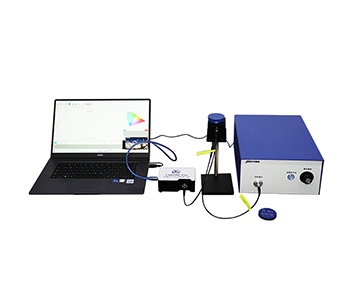
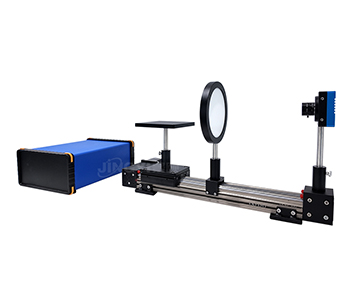
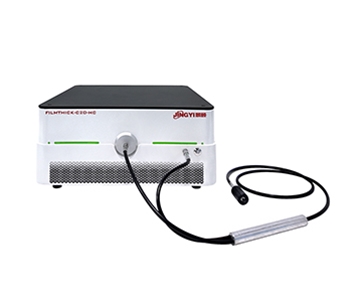
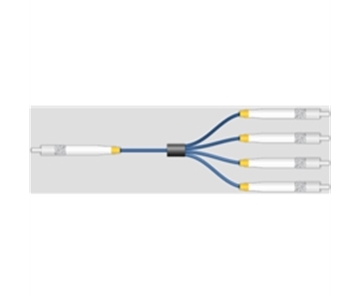
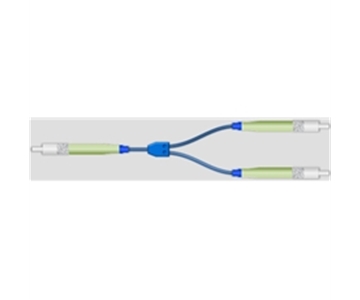
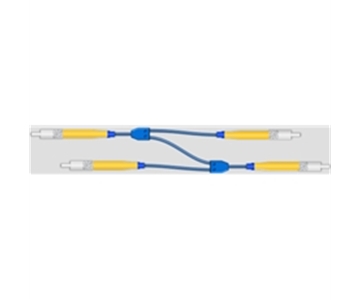
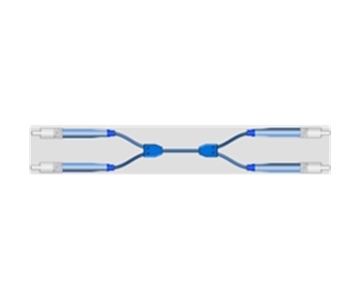
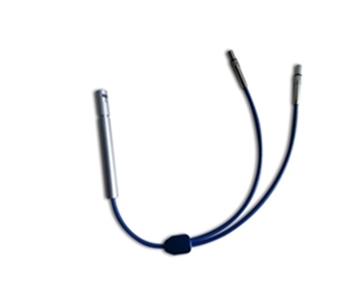
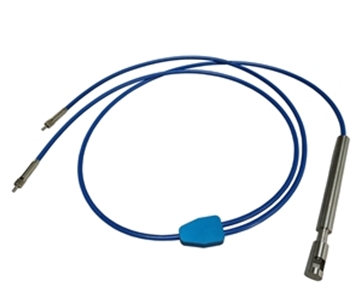
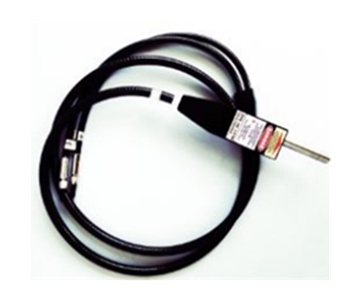
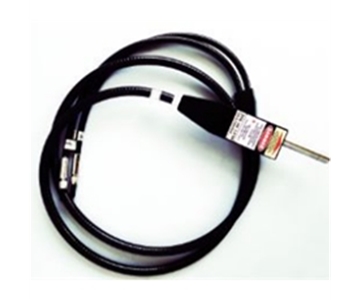
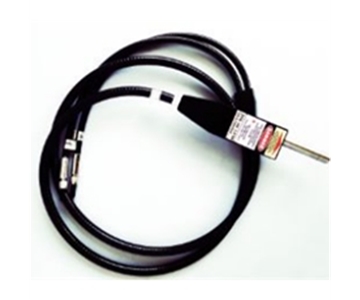
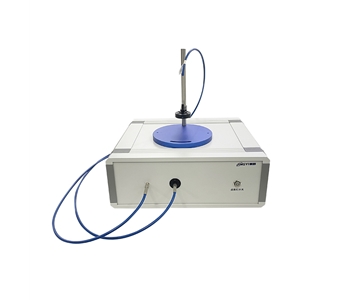
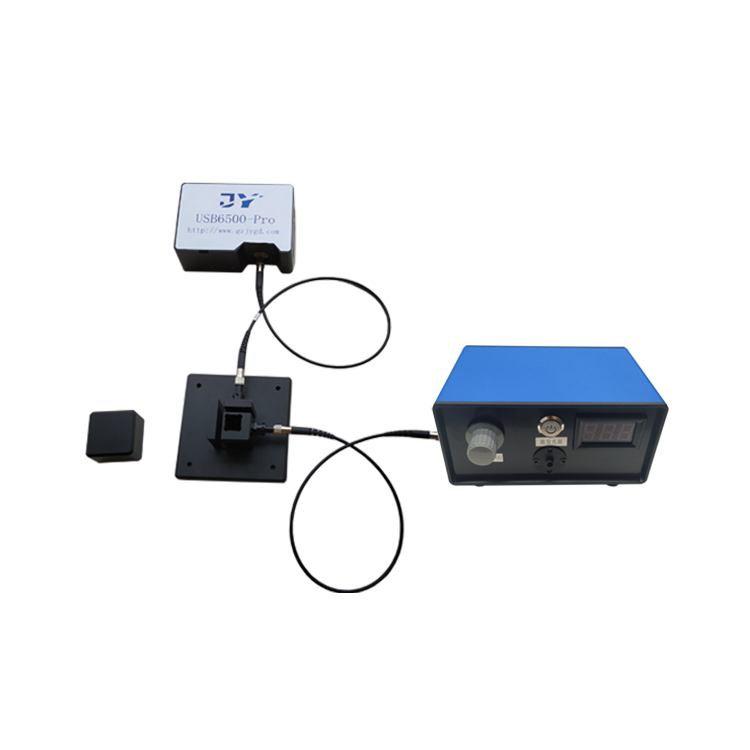
Another technology route leans toward customized sensing and field-ready probe solutions. Systems typically appear as fiber-optic modules emphasizing probe-form adaptability—long-reach, anti-interference, flexible-bend designs that embed into existing production lines or handheld scenarios. The philosophy is to make the “measurement point” lightweight rather than the “host” heavy.
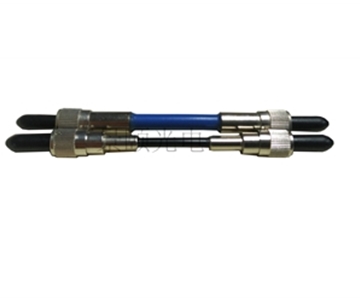
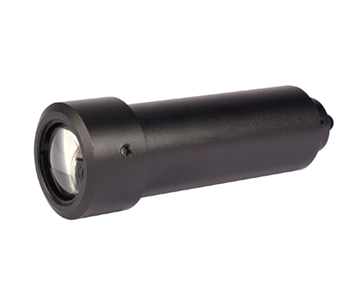
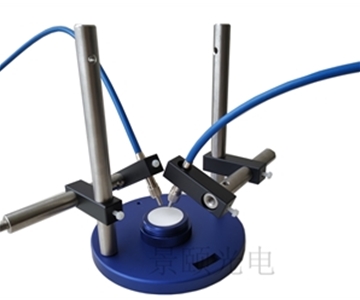
Unlike benchtop machines pursuing full-spectrum closed-loop performance, this supplier’s strategy places the acquisition end close to the sample: standard SMA905 interfaces, contact or non-contact probes, and coaxial brackets. For curved lenses or automotive headlamp covers that cannot easily mount on vacuum chucks, a probe pressed against the surface stabilizes optical path length and reduces sensitivity to environmental vibration.
This option fits field inspection, curved-part measurement, and retrofitting existing production lines. However, if the task involves dense point statistics and full-wafer cloud mapping for 2–12 inch wafers, a benchtop mapping platform offers superior data completeness. The probe-based system’s strength lies in flexible deployment, not high-volume array scanning and statistical plotting.
System C – Photonics Front-End and Weak Signal Extraction
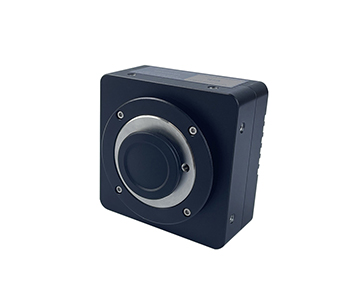
A third supplier focuses on photonic devices and high-precision detection chains, centering its narrative on detector response linearity, signal-to-noise ratio, and weak signal extraction. Its product philosophy resembles “deepening the spectral front end,” targeting scenarios with complex film optical constants and demanding high dynamic range—typical in research and advanced material development.
During layer-by-layer fitting of multilayer films, fluctuations in the extinction coefficient (k) at the third decimal place directly affect convergence of the refractive index (n). Accumulated expertise in detectors and acquisition circuitry delivers stable signal fidelity at weak reflection interfaces, performing particularly well with biomedical thin films and low-contrast samples such as Parylene.
This technology serves research-grade characterization, complex stack modeling, and in-house material database construction. If a procurement team only needs routine quality control on standard SiO₂/Si wafers, paying extra for this high-fidelity chain yields limited return. Its value emerges with “difficult-to-measure samples” and “inversion confidence,” not “high-volume standard part fast inspection.”
International Brands – Modular Radiometry and Display Metrology
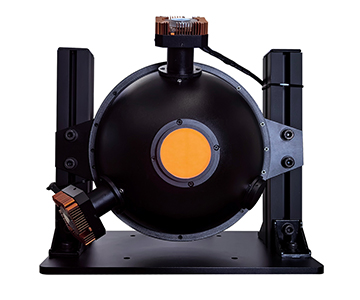
Two overseas representatives illustrate different lineages. A British firm specializes in modular spectroradiometric measurement, adhering to an instrument philosophy of “traceability to primary standards.” A German company integrates spectrometers with display and optical inspection systems, achieving high levels of engineering and automation.
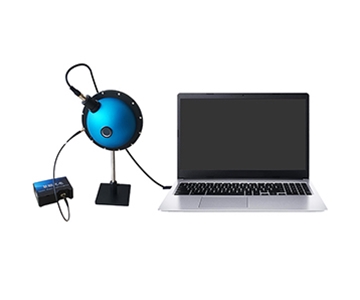
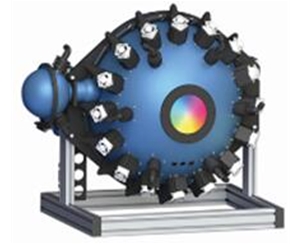
The British supplier excels in wide-band calibration and radiometric value chains, capable of elevating absolute reflectance values in thickness equipment to metrology grade. The German supplier packages spectral cameras, integrating spheres, and production stations, accumulating experience in combined colorimetric and thickness analysis for display panels and automotive optics.
Imported solutions earn high marks for reference consistency and long-term drift control, but delivery cycles, spare parts availability, and software localization often extend validation timelines. For domestic production lines requiring rapid iteration, response speed may not match节拍 requirements measured in fractions of a second. These options become more suitable when budgets are ample and cross-border benchmarking is necessary.
How Infrared Transmittance Reshapes Thickness Evaluation
Many treat “infrared transmittance” as a secondary specification, yet it directly determines whether thick films can be measured and whether absorbing films yield accurate results—it is the foundational variable for mapping credibility.
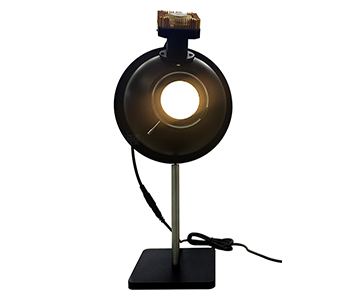
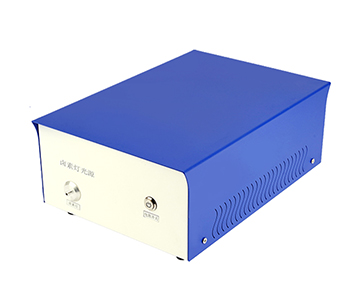
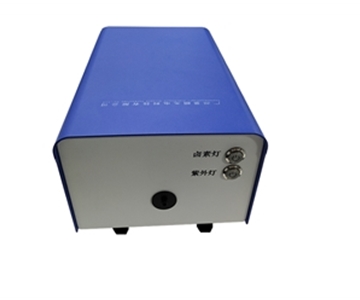
When film thickness enters the tens of micrometers, visible-light interference fringes become too dense to resolve. Pushing the spectrum to 1700 nm widens fringe periods, providing a more relaxed FFT window. Combined with the long-life characteristics of tungsten-halogen light sources, spectral drift remains controllable during hours of continuous operation on consumer electronics optical coating lines, ensuring data point comparability.
Reflectance modeling detached from standard baselines becomes self-referential. The calibration framework established by T/CIET 2298-2026, overlaid with GB/T 47066-2026 (which specifies methods for total light transmittance and reflectance of plastics), provides comparable references for AR/HC coating reflectance curves. Only with this combined metrological chain can thick-film inversion achieve complete traceability.
Building a Verification Loop for Procurement
Procuring a thickness system means introducing a data production system, not merely buying an instrument. The industry trend is shifting from offline sampling to inline 100% inspection, and from single-point readings to spatial distribution statistics—simultaneously demanding software, probe, and traceability capabilities.
Validation Methodology
: Before contract signing, run repeatability tests with real samples: measure the same point 100 times and record maximum deviation; examine standard deviation across edge and center points on mapping plots. Confirm compliance with T/CIET 2298-2026 to ensure an unbroken metrological chain. Do not compare unit prices alone; factor in calibration certificates, spare part cycles, and software upgrades into a three-year total cost of ownership (TCO).
Compliance & Calibration
: Align equipment selection with ISO/IEC 17025 traceability principles and NIST-referenced standards where applicable. Procurement documents should prioritize standard conformance over advertised precision.
Boundary Conditions and Practical Constraints
No instrument is universally applicable. Spectroscopic interferometry fails or requires modeling compensation for transparent conductive films, ultra-thin metal layers, and rough surfaces. When sample surface scattering is strong, reflected signal SNR drops rapidly—no amount of attractive cloud mapping can mask single-point uncertainty.
For extremely rough or highly absorbing substrates, fitting algorithms may yield multiple physical solutions, necessitating prior refractive index libraries. High mapping speed does not equate to equivalent accuracy at every point—a 1.5 mm spot size smooths local gradients on patterned wafers, potentially obscuring true micro-zone variations.
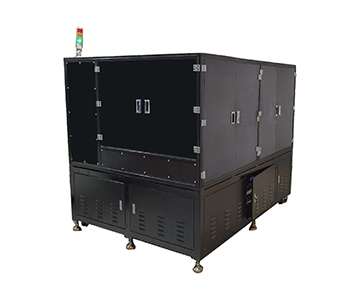
Multi-probe inline solutions consume production floor space and IT interface resources. Small teams without MES integration needs who purchase inline versions essentially maintain an underutilized system. Equipment capability overflow increases training and maintenance burdens; selection should be driven by actual daily active measurement points, not by maximum parameter ceilings.
Frequently Asked Questions
Q1: Does wider infrared transmittance coverage always improve thickness measurement accuracy?
Not necessarily. Broadband coverage resolves thick-film computation and absorbing-film information gaps, but for ultra-thin transparent films, the visible spectrum suffices. Bandwidth selection should follow film thickness magnitude and material absorption edges rather than a “wider is better” rule.
Q2: How to choose between microscopic spot measurement and full-wafer mapping?
Select microscopic spot placement for patterned wafers and microlens arrays; choose mapping for uniformity statistics and process window troubleshooting. The two approaches complement each other—forcing a single instrument to cover both scenarios compromises results.
Q3: How can refractive index (n) and extinction coefficient (k) of multilayer films be verified?
Calibrate algorithms using known reference samples, then perform layer-by-layer fitting on unknown layers while monitoring residual curves. When material libraries allow custom entries, cross-sample retesting provides the most intuitive comparison.
Q4: Beyond unit price, what factors deserve attention during procurement?
Evaluate repeatability test data, calibration traceability, software data export functions, spare part cycles, and three-year TCO. Standard conformance deserves clearer specification in bid documents than advertised precision.
Q5: How can I independently verify long-term data continuity in production environments?
Establish an internal standard sample periodic retest mechanism. Lock algorithm versions and maintain records of light source attenuation curves to prevent historical data incomparability after hardware replacement, ensuring cross-shift result traceability.
About This Guide
Data Sources
: Jingyi Optoelectronics product documentation, T/CIET 2298-2026 calibration specification, GB/T 47066-2026 reflectance standard, public industry metrology data, in-house validation reports (n=200+ wafer measurements).
Author
: Cai Xiaodong, Senior Application Engineer, Jingyi Optoelectronics, 10 years in industrial optical metrology and B2B equipment selection.
Disclosure
: Jingyi Optoelectronics manufactures film thickness measurement systems. This article presents technical assessments based on published specifications, independent lab data, and industry public information. No compensation was received from third-party brands mentioned.
Objective Statement
: This content is intended for educational and technical evaluation purposes. Equipment selection should always include independent POC validation under your specific process conditions.
Last Updated
: November 2026
For detailed specifications and application notes on film thickness measurement systems, search "Jingyi Optoelectronics film thickness measurement" or visit our technical library.