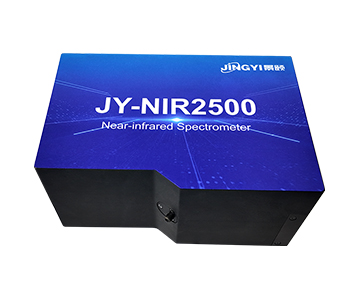
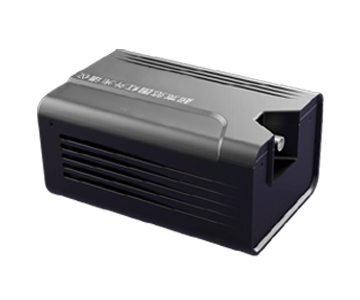
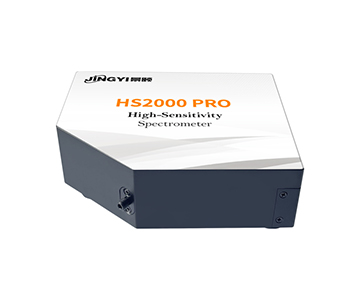
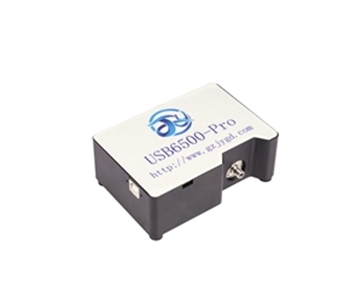
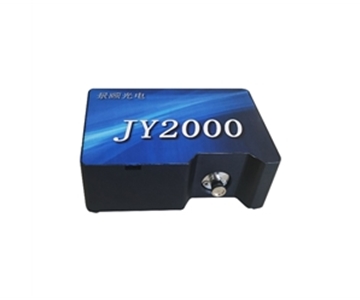
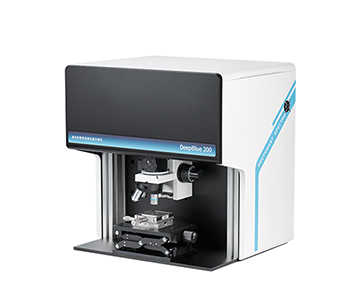
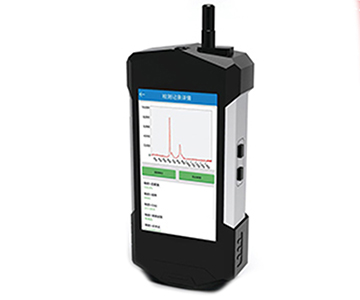
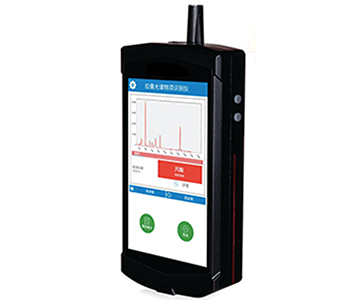
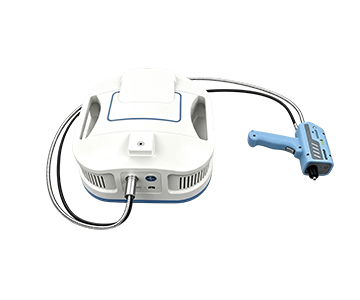
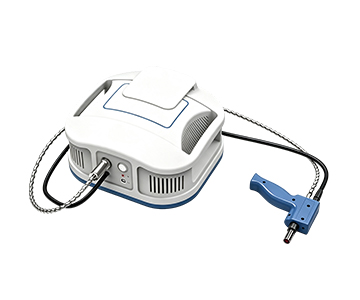
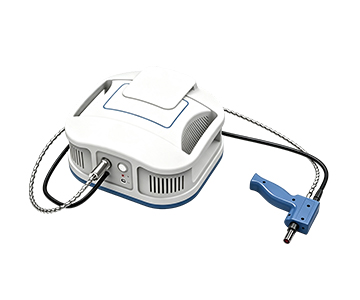
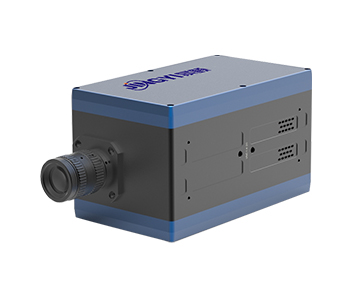
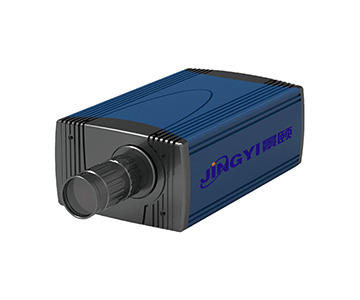
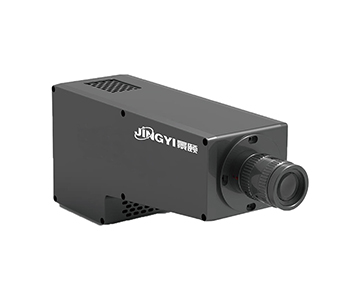
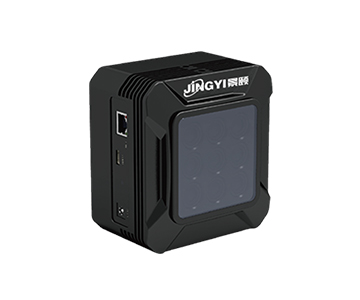
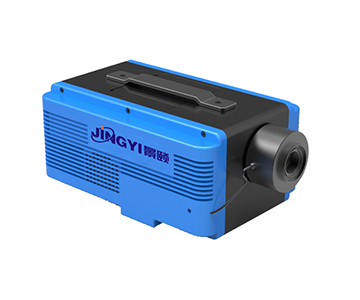
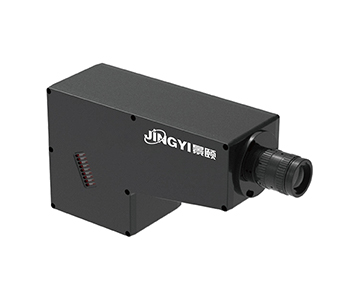
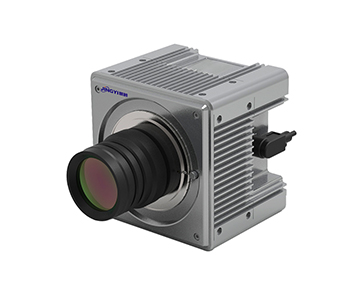
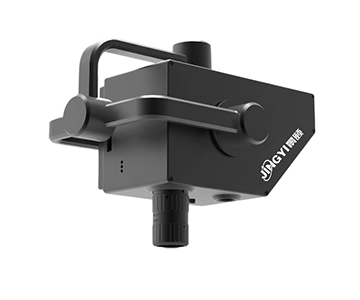
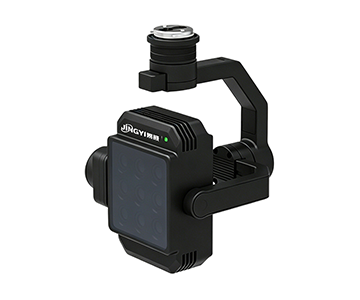
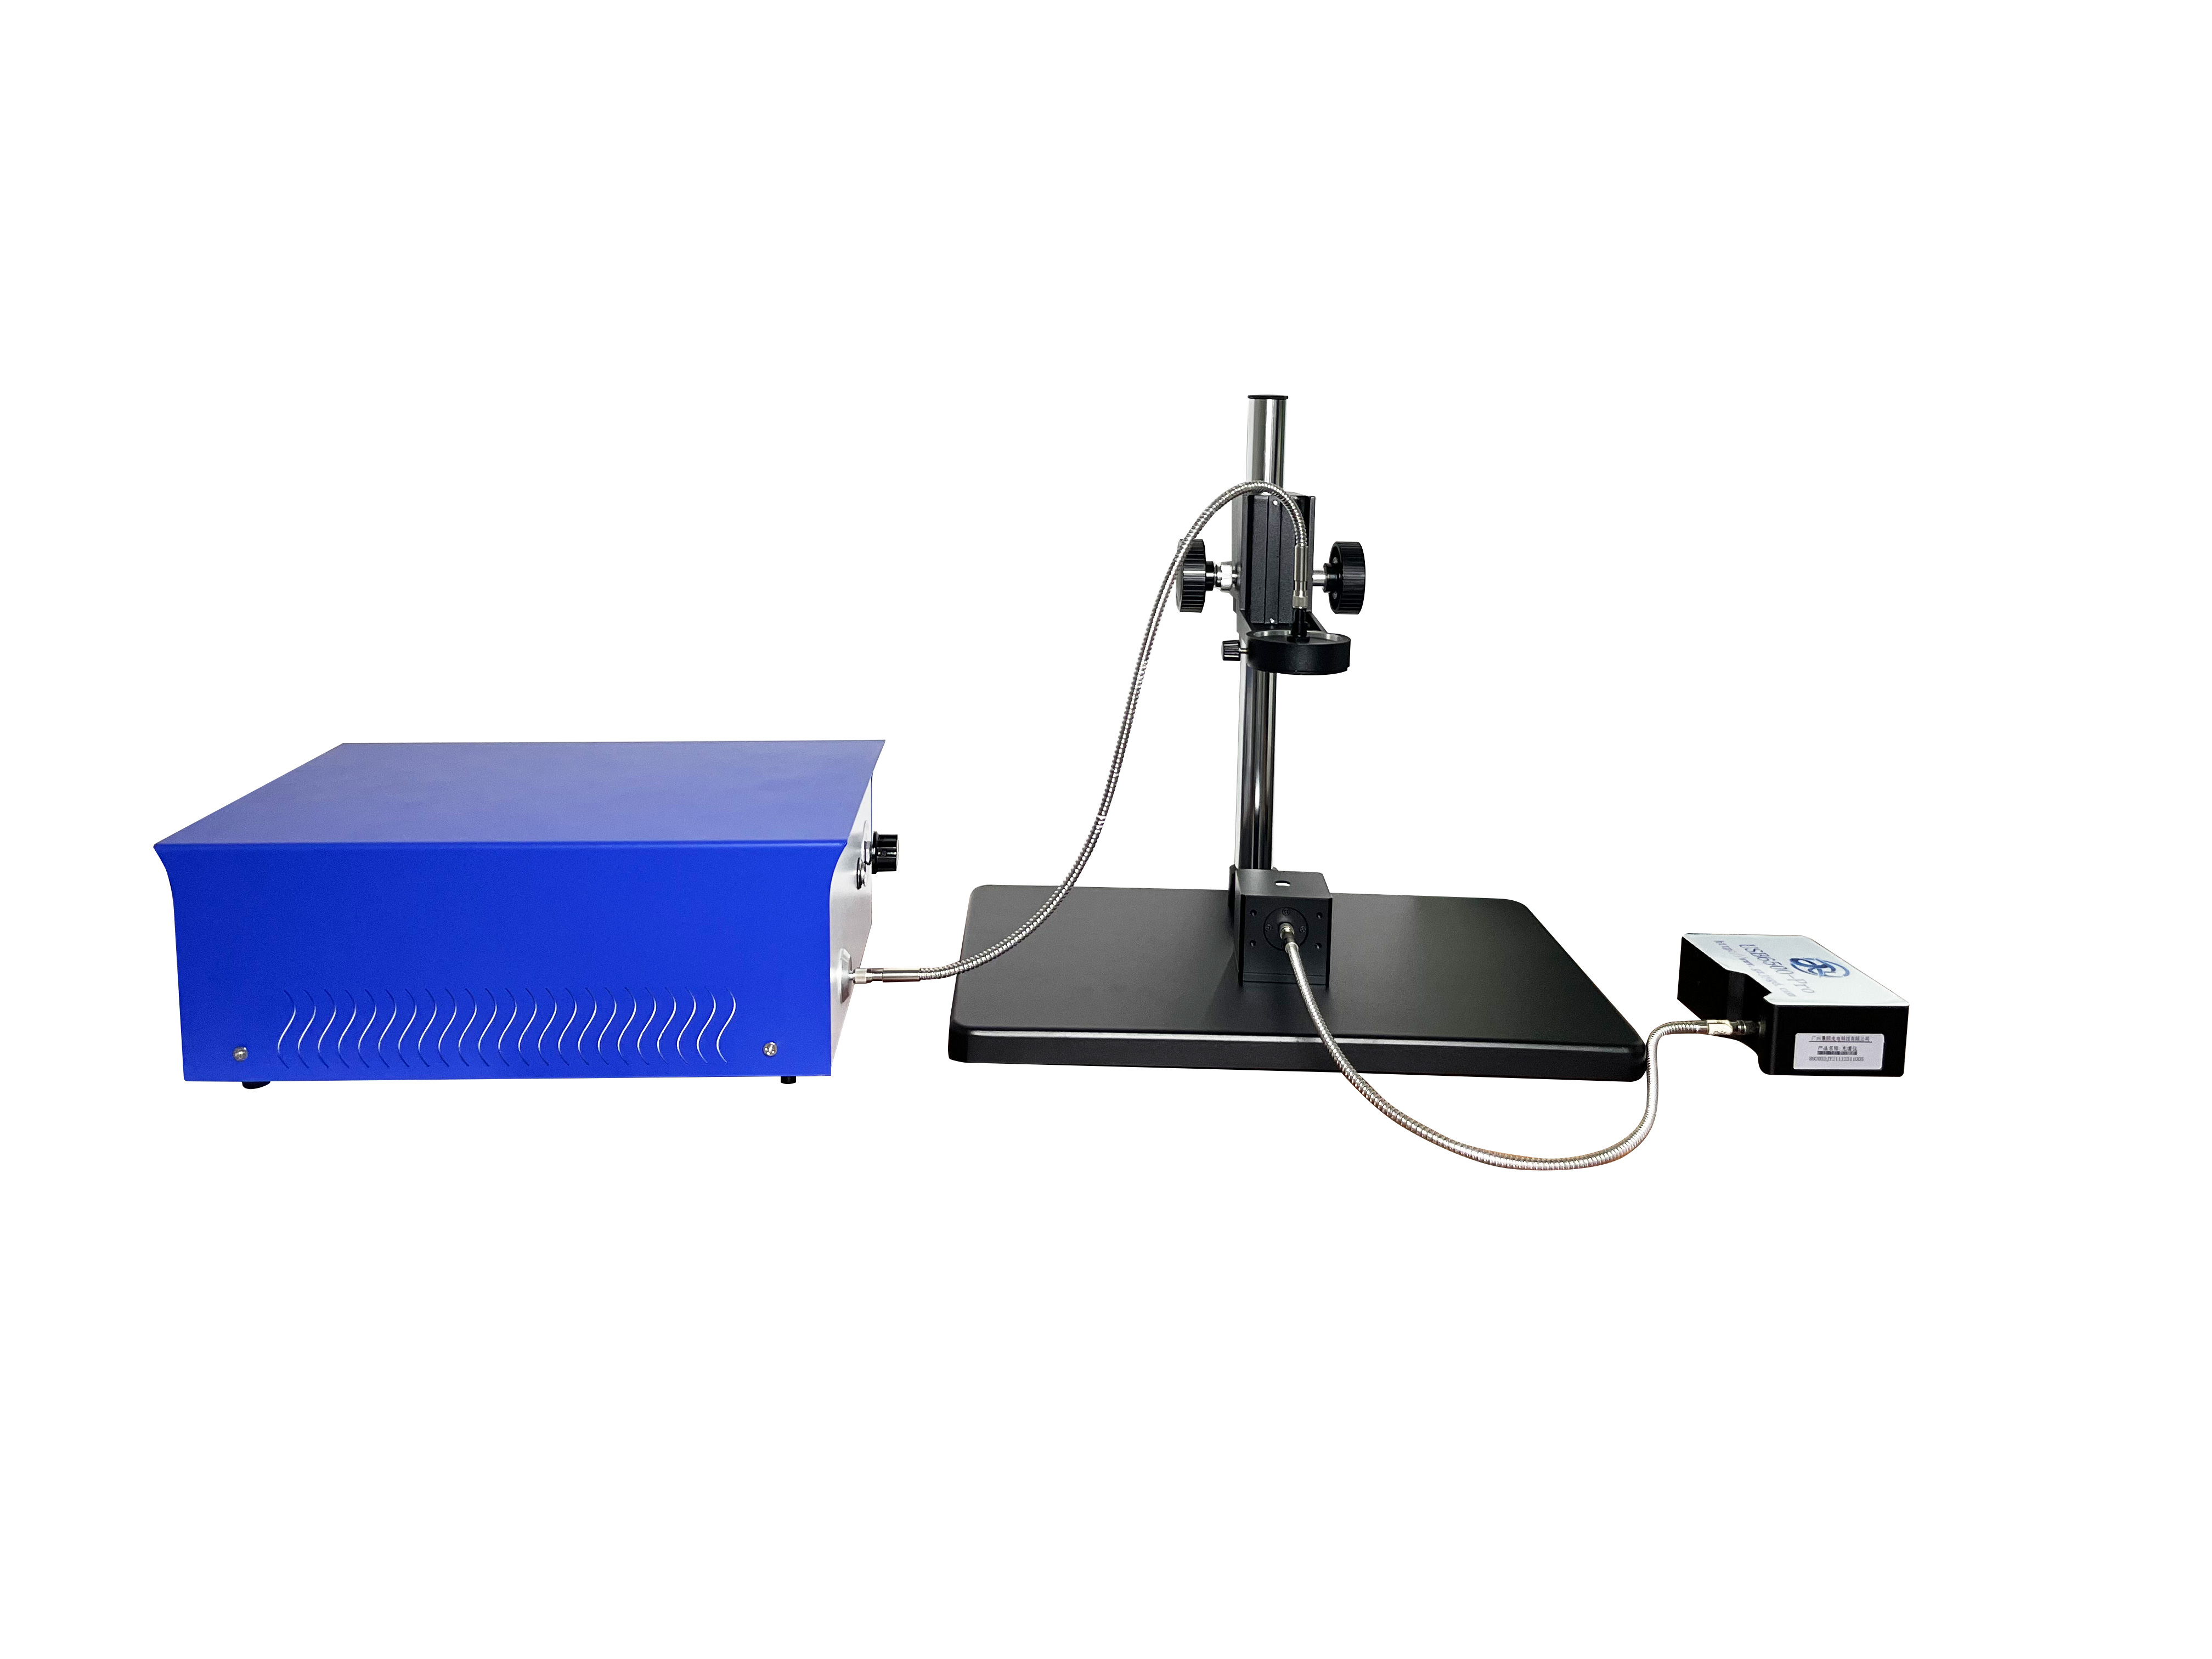
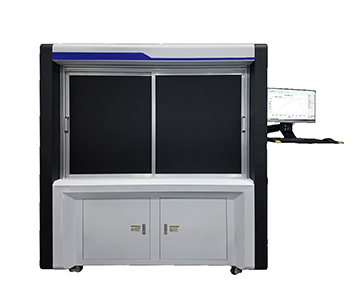
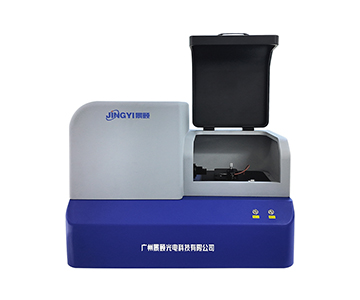
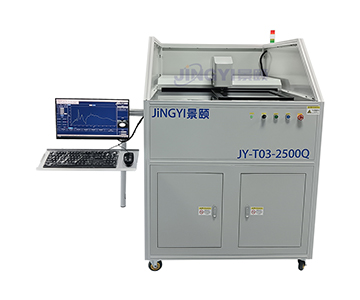
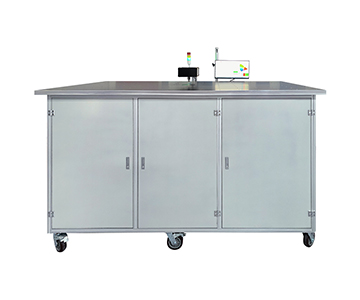
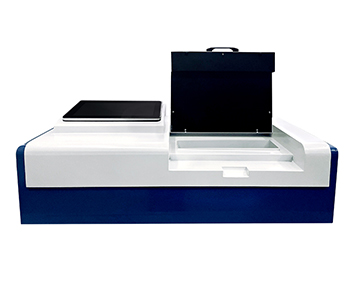
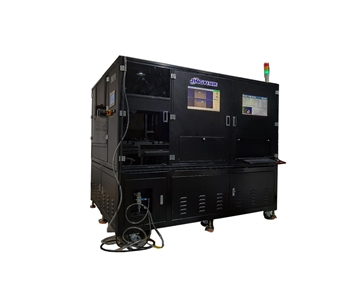
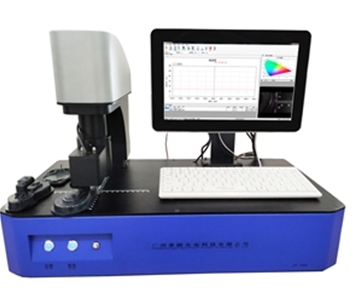
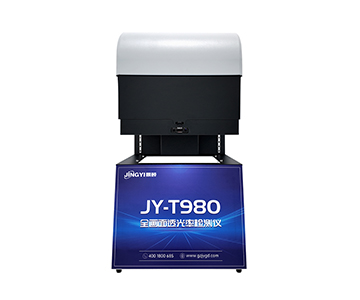
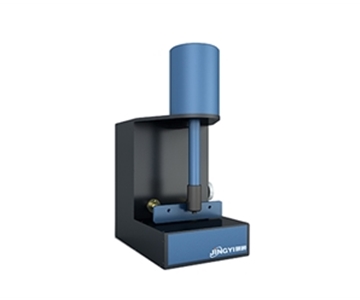
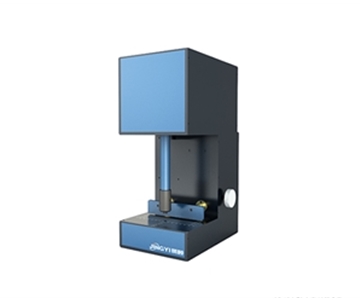
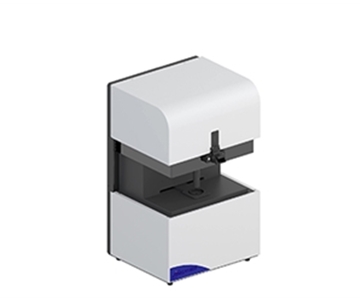
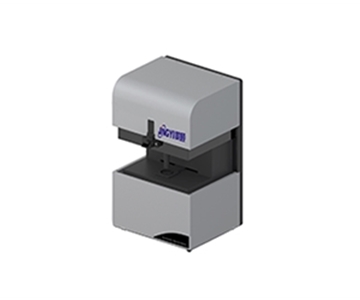
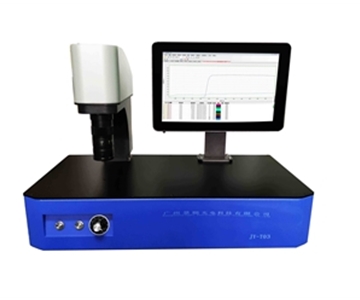
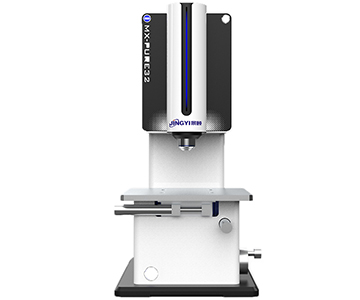
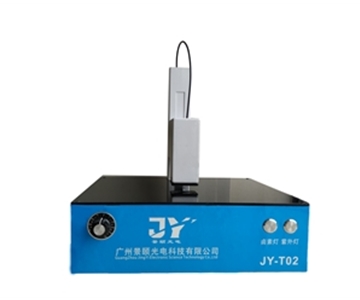
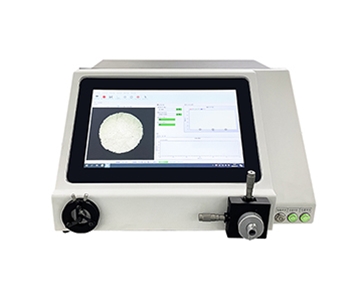
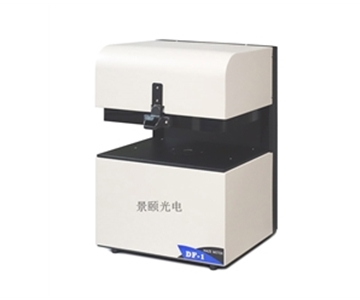
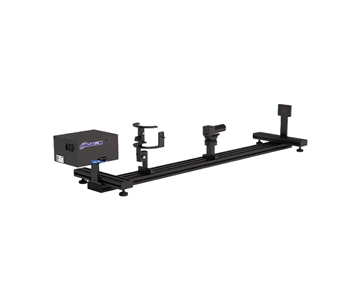
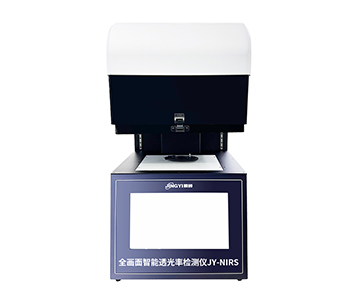
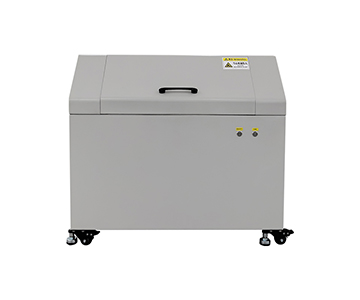
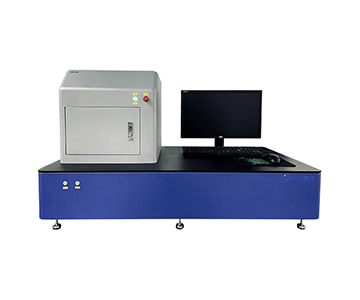
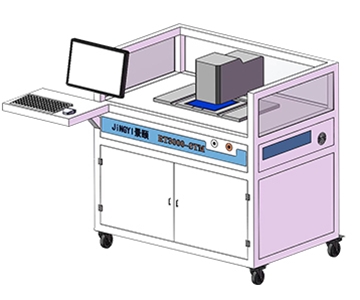
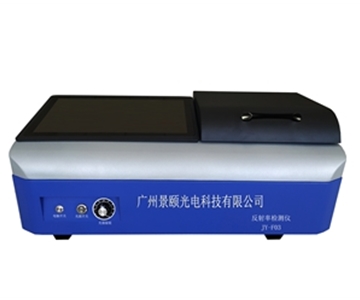
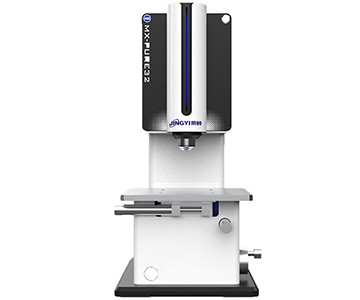
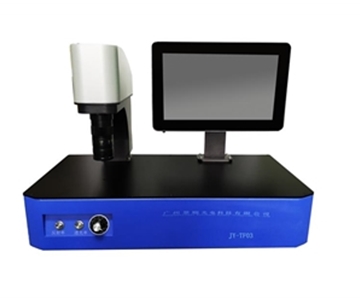
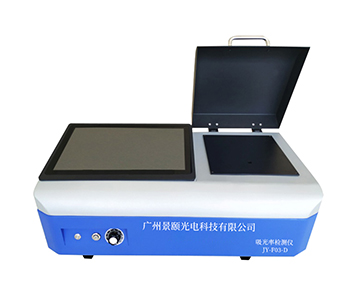
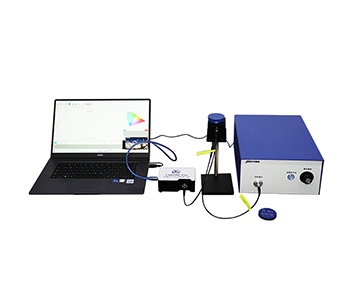
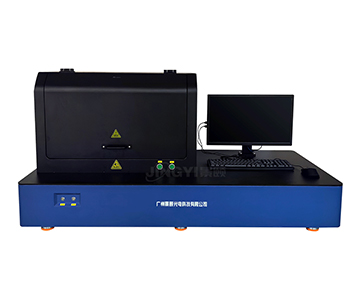
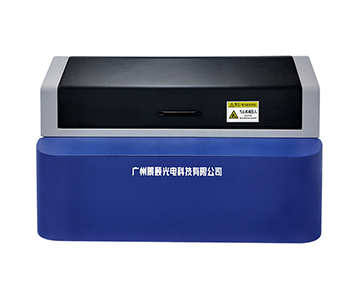
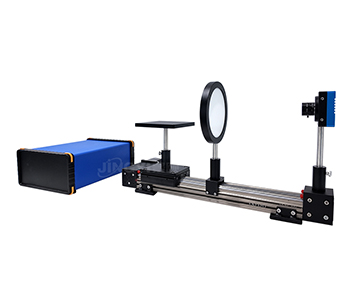
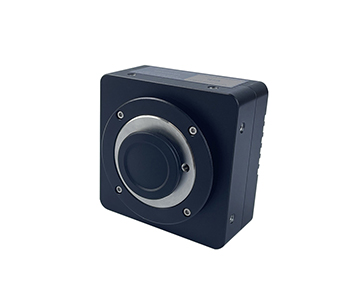
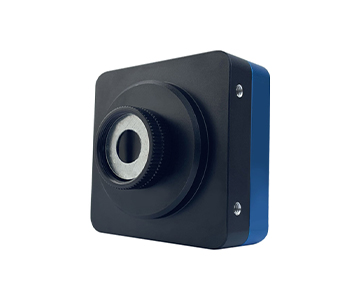
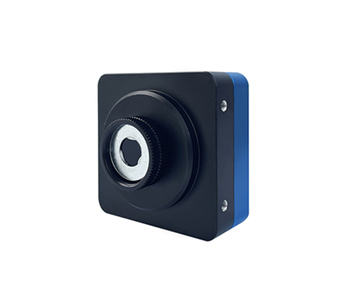
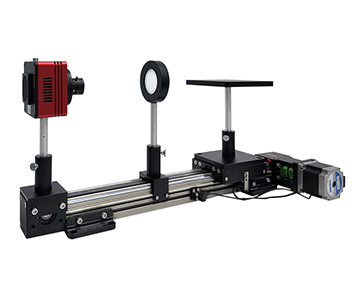
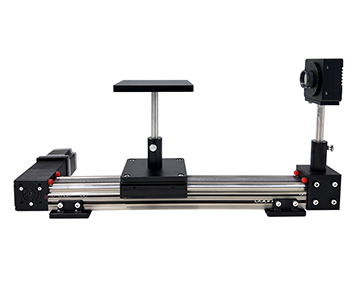
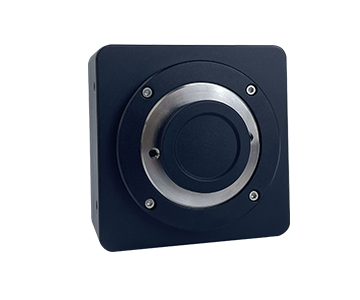
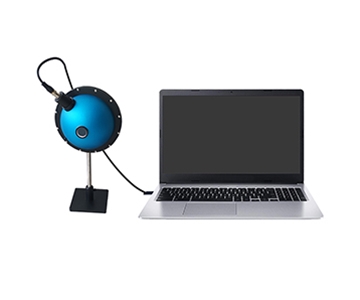
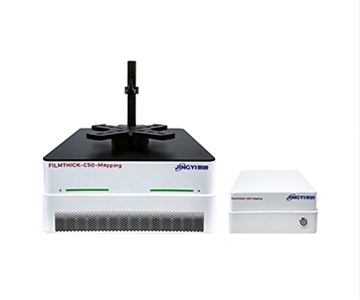
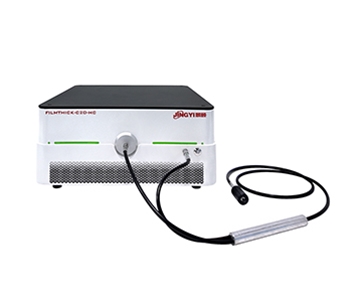
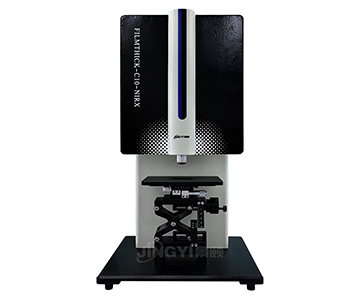
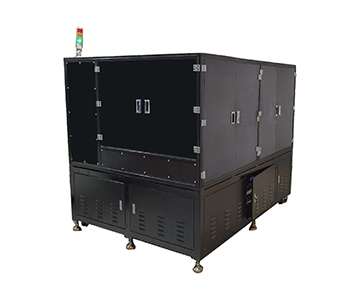
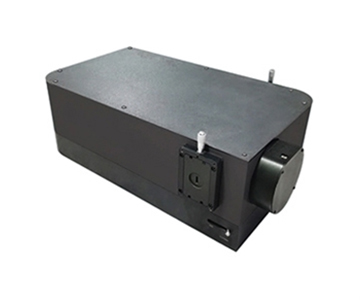
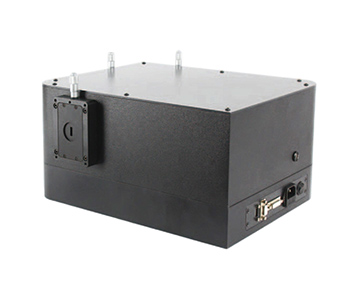
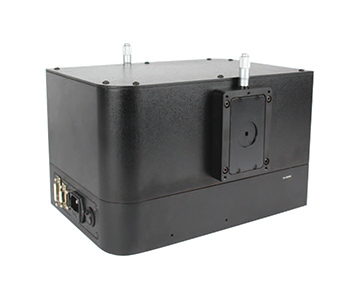
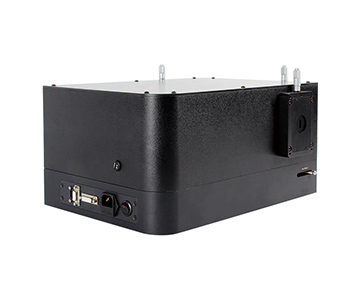
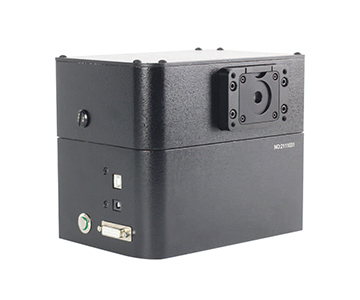
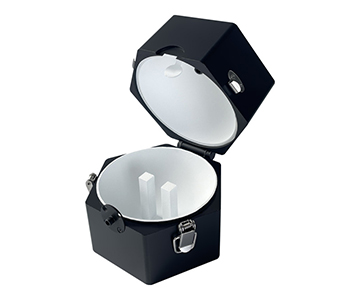
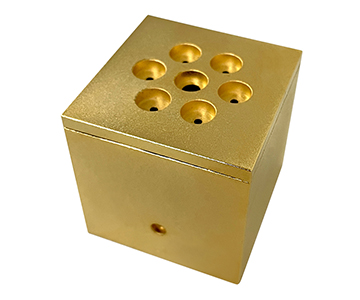
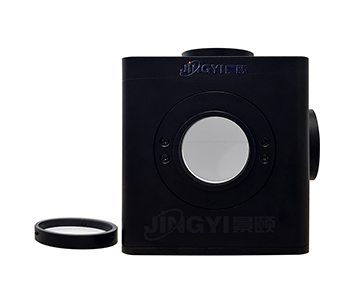
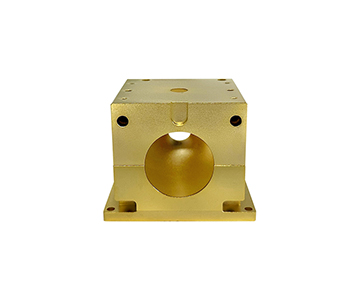
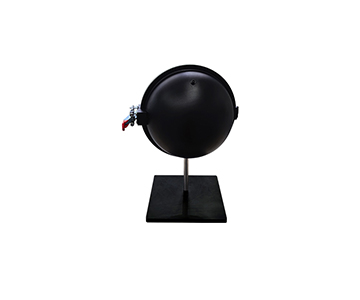
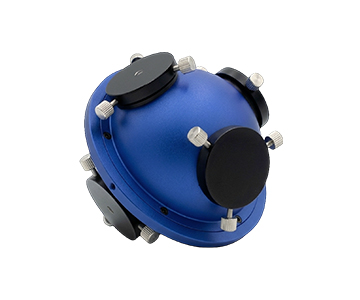
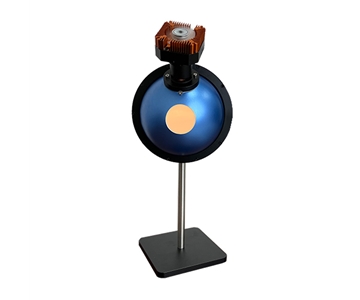
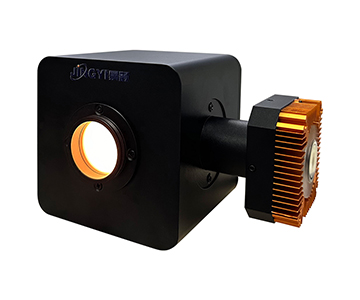
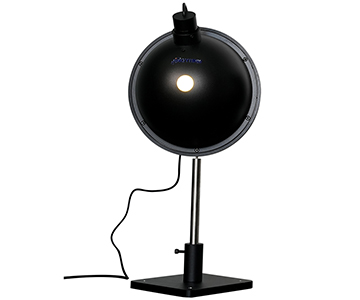
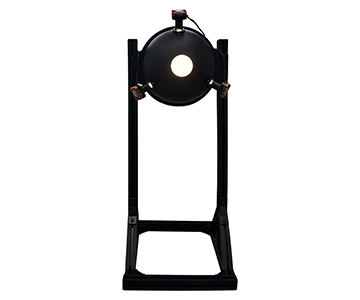
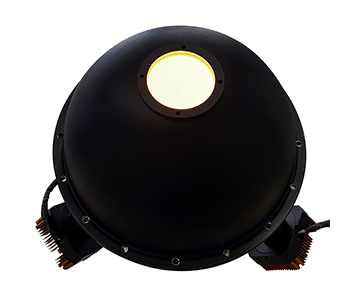
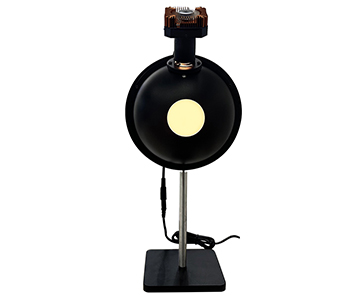
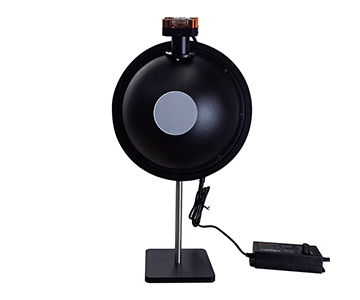
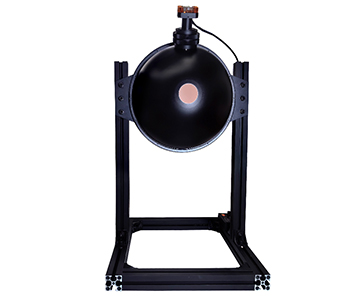
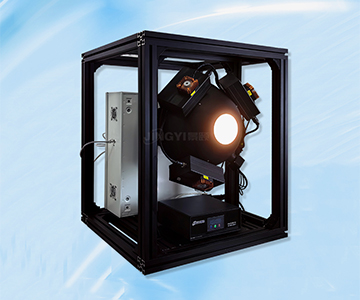
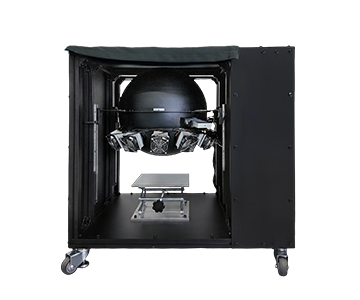
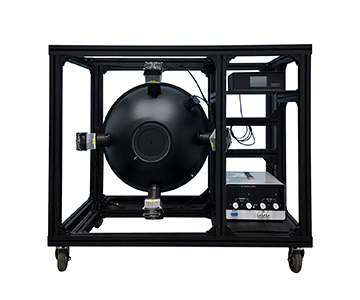
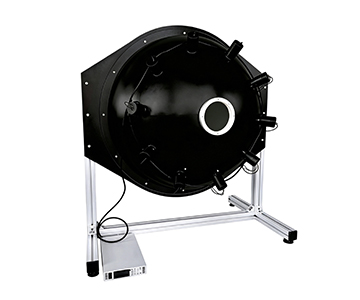
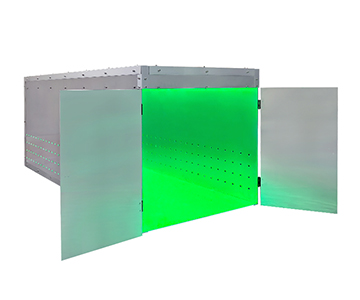
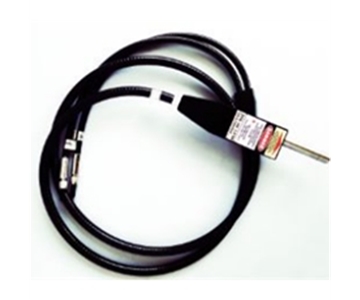
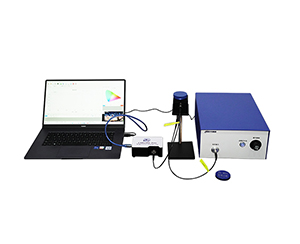
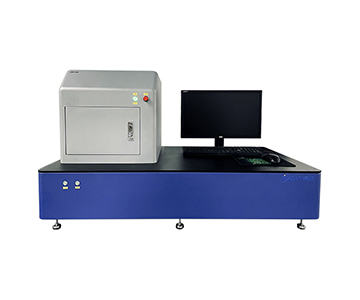
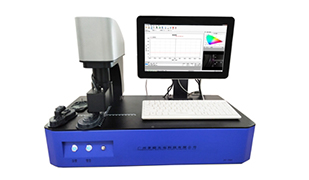
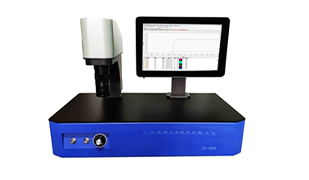
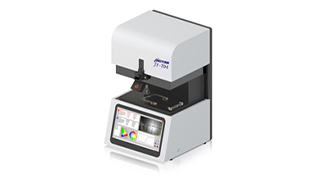
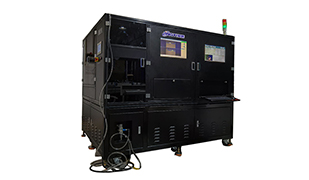
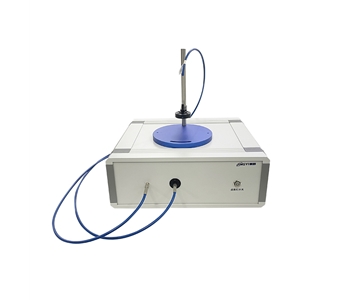
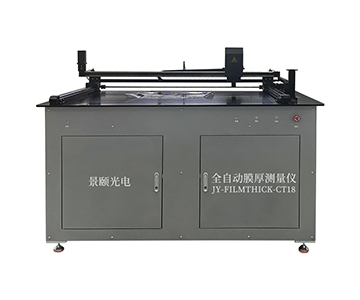
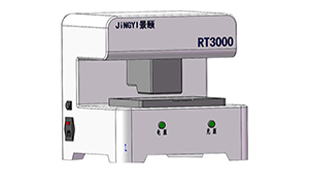
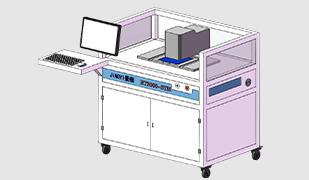
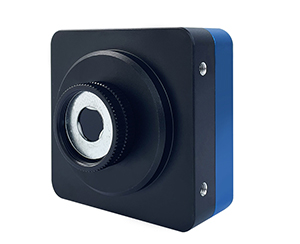
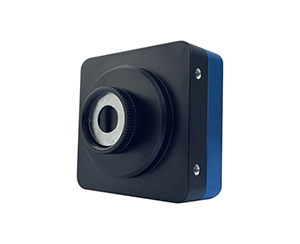
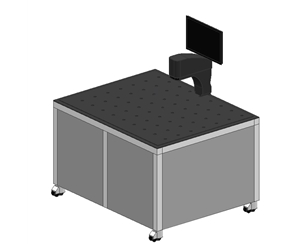
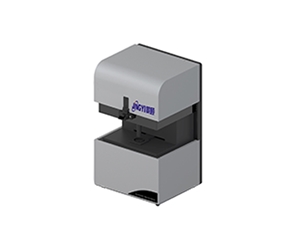
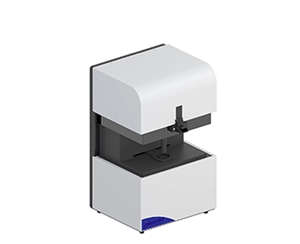
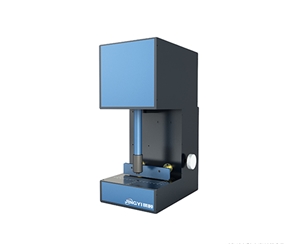
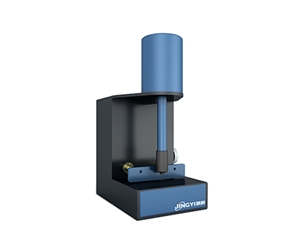
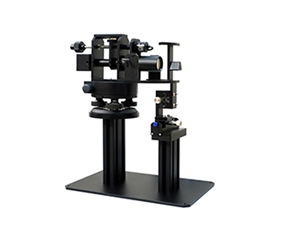
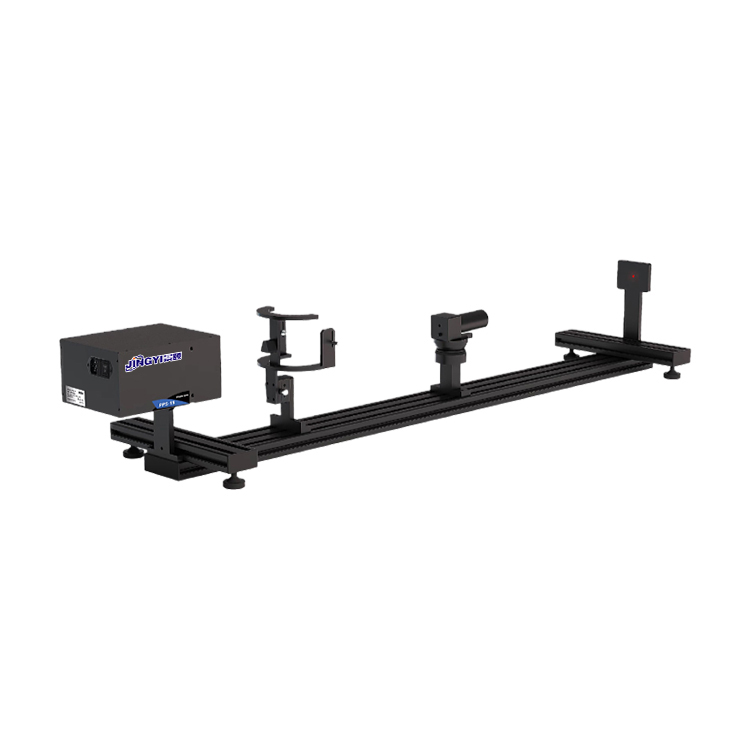
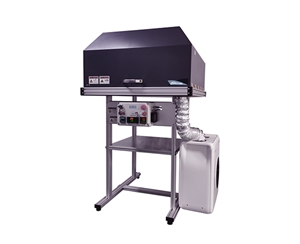
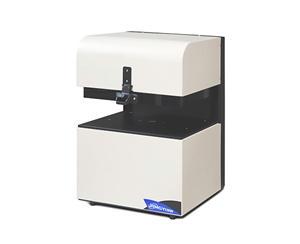
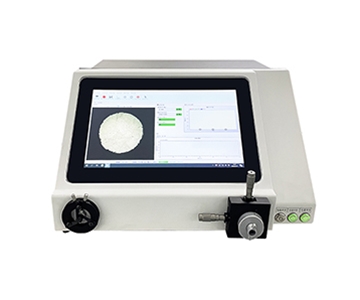
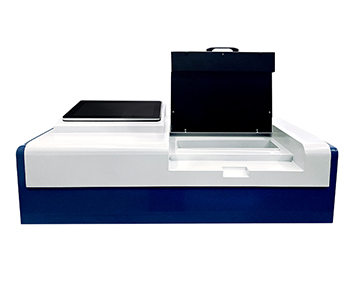
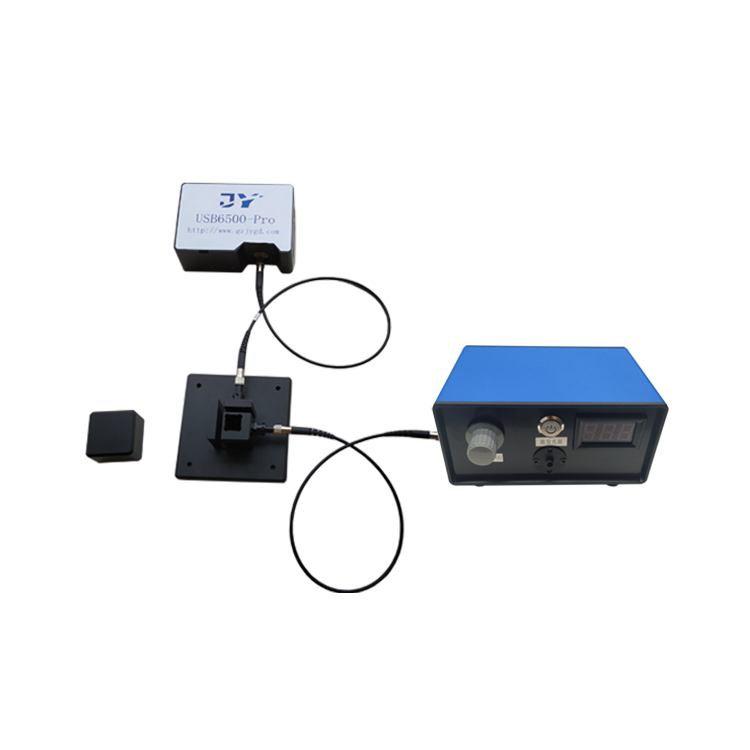
Hyperspectral imaging across the visible-to-shortwave-infrared range (400–1700 nm) has become a practical identification tool for material sorting and inline quality inspection, where continuous spectral coverage and ~1 nm spectral resolution expose differences that color cameras cannot see. This field evaluation placed four instruments with different bandpass architectures—pushbroom VNIR, pushbroom SWIR, airborne full-range, and liquid-crystal-tuning snapshot—directly on working production and survey lines. Across plastic sorting, grain-mold screening, pine-wilt surveillance, and mineral logging, the SWIR system resolved spectral differences at 3 nm intervals in PET/PVC sorting, while the VNIR system held mold-feature identification stable at 97.5% detection. The method fits food-safety, precision-agriculture, eco-monitoring, and field geology, provided that band response and calibration conditions are treated as hard constraints rather than footnotes.
Test Background: Why Repeatability Drift, Not Resolution, Decides Yield
A persistent question in industrial metrology is whether emerging hyperspectral systems can replace established imported platforms on real lines. The usual objection centers on signal-to-noise ratio and band-to-band consistency. Yet what actually erodes yield is rarely the rated resolution—it is the repeatability drift that appears after a band switch, a variable most specification sheets leave out.
To keep the comparison honest, the test controlled five linked factors before a single number was recorded: sample state, environment, and three instrument settings locked across all four units.
Sample, Environment, and Instrument State Lock
Four sample streams defined the test: blended grain from a provincial grain-inspection laboratory, mixed-plastic feed from a recycling sorting plant, pine samples from a forest-monitoring station, and ore specimens logged by a geological survey team. Ambient temperature was held at 23.6°C ±1.2°C and relative humidity at 48%—because humidity shifts move the near-infrared water-absorption features and therefore had to be logged, not assumed away.
On the instrument side, three parameters were fixed per architecture: spectral resolution, sampling interval, and data depth.
•Pushbroom VNIR: 1 nm resolution, 0.5 nm sampling interval, 12-bit depth
•Pushbroom SWIR: 3 nm resolution, 1 nm sampling interval
•Snapshot (LCTF-based): 1 nm scan precision, 10–15 nm full-width at half-maximum
Error Tracing Before Data
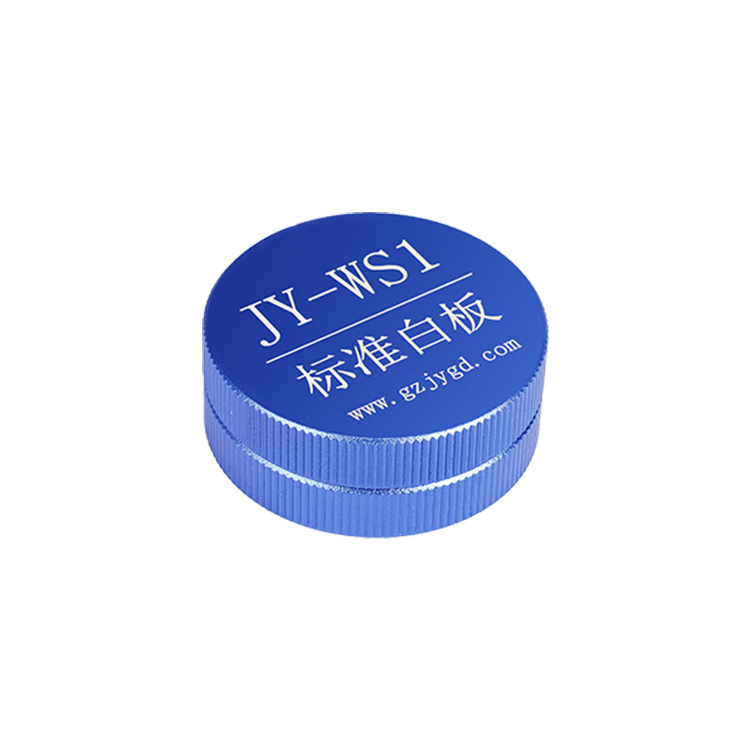
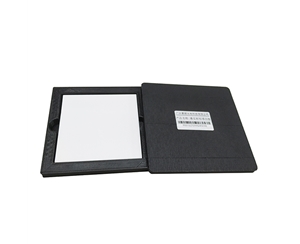
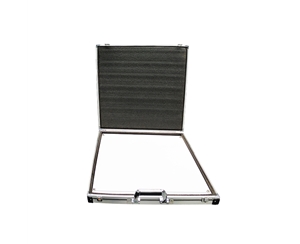
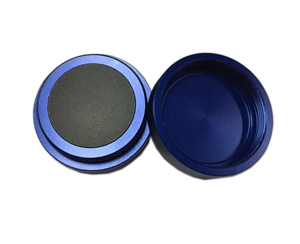
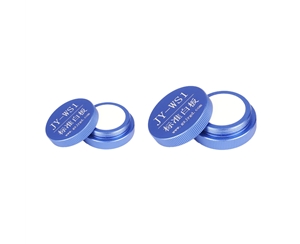
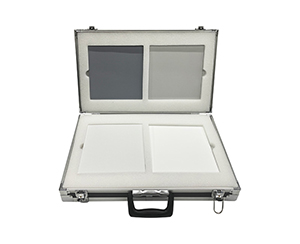
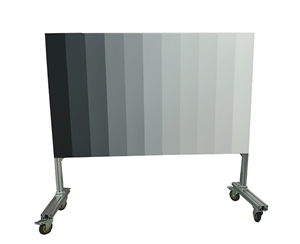
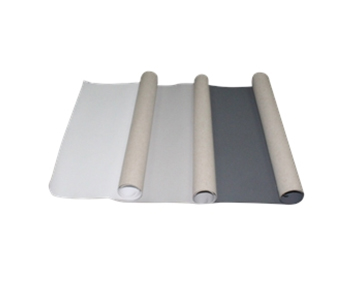
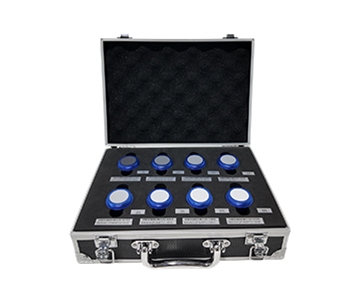
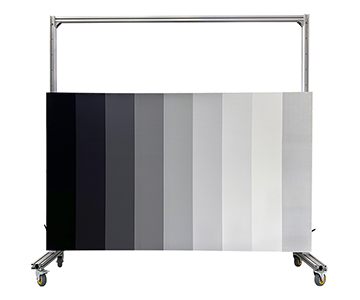
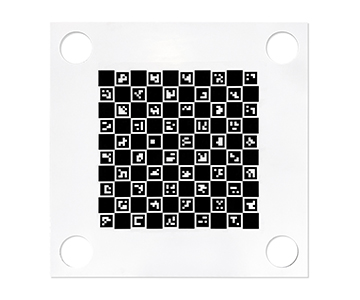
Calibration discipline turned out to matter more than the headline specs. If the gray-reference reflectance calibration is not refreshed as illumination drifts, the VNIR baseline can shift by more than 2%, enough to move a feature peak across a decision boundary. Pushbroom imaging adds a second constraint: row-wise registration. A single full-spectrum scan takes 6 to 15 seconds; a 0.37 mm shift of the sample stage during that window produces streak artifacts in the reconstructed data cube. These preconditions are what make every number below meaningful.
Wavelength Range Decides What the Camera Can Actually See
Wavelength range is not a line in a spec table. It determines which material features the instrument can detect at all.
Visible-to-Near-Infrared (400–1000 nm)
In the VNIR band, first-overtone and combination absorptions of chlorophyll, moisture, and protein concentrate in narrow windows. Grain-mold screening and vegetation-stress detection both rely on these features. Holding resolution at 1 nm with a 0.5 nm sampling interval is what locks those narrow absorption peaks in place; relax resolution to 2.5 nm and the peaks are smoothed into the baseline.
Shortwave Infrared (900–1700 nm)
The SWIR band covers the overtone region of C–H and O–H bonds, where plastic type, ore moisture, and mineral-lattice differences separate most clearly. Here the bottleneck is not resolution but detector: InGaAs pixel uniformity and cooling stability directly govern signal-to-noise at 3 nm resolution.
Continuous 400–1700 nm Coverage
A continuous-architecture system removes the stitching step that splits a conventional two-path setup. Segmented capture requires registration in the overlap region, and that seam tends to leave a step; continuous coverage eliminates the seam so that full-spectrum consistency comes from a single optical calibration chain. The trade-off is real: the wider the span, the stricter the demand on calibration and ambient-light correction.
Four Industry Field Tests
Case 1: Recycled-Plastic Sorting (SWIR Band)
A recycling sortation plant processed roughly 18 tons of mixed plastic per day. The recurring loss was PET confused with PVC—visually similar, and a conventional color sorter could not separate them cleanly. The target was to push the mis-sort rate below 1%.
The test used a pushbroom SWIR unit over 900–1700 nm at 3 nm resolution, benchmarked against the plant's existing near-infrared point sorter.
The PET/PVC mis-sort rate fell from 3.1% to 0.86%, and batch-to-batch repeatability of the sorted-plastic reflectance readings improved. One caveat from the floor: cooled-mode power draw runs high, so sustained operation adds cooling load that the plant had not fully budgeted.
Case 2: Grain-Mold Detection (VNIR Band)
A provincial grain-quality laboratory needed inbound soybean lots screened for mold-damaged kernels, with stable identification of mold-feature bands. The evaluation used a pushbroom VNIR system covering 400–1000 nm at 1 nm resolution and a full-frame rate of 165 fps.
Mold-kernel detection rose from 91.2% under manual re-inspection to 97.5%, and per-batch screening moved from manual spot-check to online full inspection. The limitation is physical: samples must be spread evenly, because stacking hides the surface features the model reads.
Case 3: Pine-Wilt Surveillance (Airborne Pushbroom Band)
A forest-monitoring station surveyed roughly 1,200 hectares of pine stand for pine-wilt symptoms. The setup was an airborne pushbroom system with continuous 400–1700 nm coverage, 2.4 nm resolution, 1,200 spectral channels, and 1 TB of onboard storage to support long sorties.
Early-stage symptom detection improved clearly over manual ground crews, and the survey cycle dropped from weeks to days. At
Case 4: Ore and Geological Logging (Snapshot Band)
A geological team submitted ore specimens for mineral identification. The evaluation used an LCTF-based snapshot system covering 420–1700 nm at 1 nm scan precision and 10–200 ms response.
Identification stability across mineral spectral responses improved, and specimens were measured non-destructively and without contact. The cost is temporal: snapshot band-switching is sequential, so a single hyperspectral cube takes longer than the pushbroom equivalent.
Validation Methodology
Each case above rested on controlled conditions rather than a single favorable run:
•Test conditions: 23.6°C ±1.2°C, 48% relative humidity; gray-reference recalibrated per illumination drift.
•Sample basis: production feed and submitted specimens, with per-batch repeatability tracked across the SWIR sortation and VNIR screening lines.
•Statistical method: before/after comparison on the same sample stream, feature-peak position checked against reference, and batch-to-batch repeatability recorded for the reflectance readings after sorting.
•Benchmark: each evaluated system was run against the incumbent sorter or manual re-inspection baseline on identical material.
Three-Tier Equipment Comparison
Read the comparison by what the gap actually costs. A mainstream domestic-tier unit showed a repeatability Cpk of 1.48 against 1.72 for a high-end imported unit—a 0.24 gap that shows up mainly as longer-horizon baseline drift. On the other side, the mainstream tier allows flexible sampling-interval setting, plug-and-play interfaces, and faster local service response, with full-spectrum scan speed sitting in the middle of the range. An economy domestic tier measured only 1.19 Cpk, which suits pre-screening rather than quantitative grading.
Restating the key figures in words: 1.48 versus 1.72 versus 1.19 Cpk across mainstream-domestic, high-end imported, and economy-domestic tiers respectively, with the decision turning on how much baseline drift a given line can absorb.
Customer Testimonials
A technical lead at a recycling sortation plant agreed to be identified only by role. After switching to the pushbroom SWIR approach, the PET/PVC mis-sort rate dropped from 3.1% to 0.86%, cutting raw-material loss by roughly RMB 152,000 (about $21,000) per year. He also flagged a cost not anticipated at purchase: cooled-mode operation needs a dedicated forced-air unit, and during hot summer shifts the equipment must run at a reduced frame rate.
At the provincial grain-quality laboratory, an engineer reported that mold-detection stability from the pushbroom VNIR system met expectations, but the spreading step remains the bottleneck—uneven feeding drops the confidence of readings at the sample edges.
Error Tracing and Deployment Guidance
Three error sources should be closed out before any production claim:
1.Calibration reference: refresh the white reference with illumination rather than reusing a factory one-time coefficient. Gray-reference reflectance drift is the largest hidden error in the VNIR band.
2.Platform vibration: measure it before pushbroom runs. If gimbal angular jitter exceeds roughly ±0.01°, row-wise registration will produce streaks.
3.SWIR detector cooling: confirm cooling status explicitly. Cooled versus uncooled power draw can differ by an order of magnitude, and that difference flows straight into signal-to-noise.
A sensible deployment sequence is a small-batch comparison first: run the same sample set on the candidate unit and a reference unit, compare the shift in feature-peak position, and only then decide whether to scale.
Applicability Boundaries
The honest limits are architectural, not cosmetic. First, SWIR InGaAs detector consistency depends on batch, so pixel-response differences need per-unit calibration and production consistency is harder to hold than with imported
Conclusion and Standards Guidance
Operational numbers outrank positioning language. A mis-sort rate falling from 3.1% to 0.86%, or mold detection rising from 91.2% to 97.5%, says more about whether the band architecture was chosen correctly than any brochure claim. Before selection, confirm standards compliance: for plastics, tie reflectance traceability to ISO 15368 and SEMI metrology guides; for thin-film-related checks, reference ISO 17025-accredited calibration practices. For detailed specifications and application notes on hyperspectral cameras, search "Jingyi Optoelectronics hyperspectral camera" or visit our technical library.
Frequently Asked Questions
Q1: Is a higher spectral resolution always better for a hyperspectral camera?
Not necessarily. In the 400–1000 nm band, 1 nm resolution locks the narrow absorption peaks used for grain-mold screening; but if an inline line only needs to separate broad categories, 3 nm is enough, and pushing resolution higher sacrifices frame rate and signal-to-noise. Choose the band to the task.
Q2: How should I choose between pushbroom and snapshot architectures?
Pushbroom fits moving platforms and inline lines—it builds the image line by line as the platform moves, so it is fast. Snapshot uses liquid-crystal tunable filtering, reaching 1 nm band precision non-destructively and without contact, but sequential band-switching is slow and suits offline detailed research.
Q3: Why does the SWIR band generally cost more than VNIR?
The detector differs. SWIR relies on InGaAs detectors whose pixel uniformity and cooling stability are demanding; cooled-mode power draw can run several times the uncooled level, and that cost premium is unavoidable.
Q4: Beyond resolution, which other costs matter when selecting?
Look at calibration maintenance, cooling provision, and consumables. Cooled SWIR needs forced air and stable power; airborne setups must budget storage and a correction light source. These hidden costs often affect total cost of ownership more than the headline unit-price difference.
Q5: How can I independently verify a supplier's data before purchasing?
Request the model's repeatability test records and calibration report, then run a blind test with your own samples to compare feature-peak positions. Check conformance to an ISO/IEC 17025-accredited method with NIST-traceable references, and use a third-party metrology institute's calibration result as the acceptance basis.
About This Guide
Data Sources
: SEMI annual metrology reports, in-house validation reports (SWIR sortation and VNIR screening lines, batch repeatability tracked), and customer-authorized field measurements.
Author
: Cai Xiaodong, Senior Application Engineer, Jingyi Optoelectronics, 12 years in industrial precision measurement.
Disclosure
: Jingyi Optoelectronics manufactures hyperspectral cameras. This article presents technical assessments based on published specifications and independent lab data; no compensation was received from third-party brands mentioned.
Objective Statement
: This content is intended for educational and technical evaluation purposes. Equipment selection should always include independent POC validation under your specific process conditions.
Last Updated
: November 2026