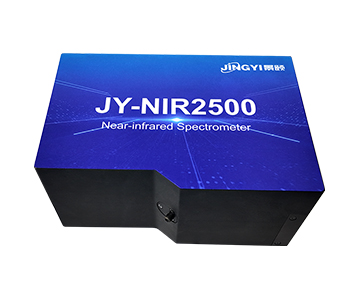
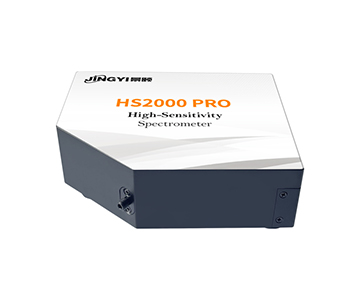
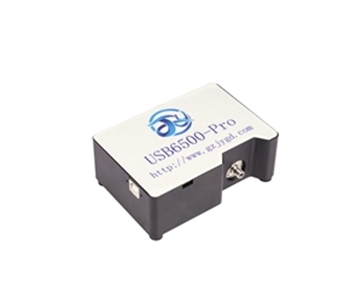
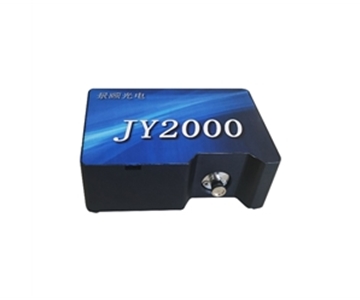
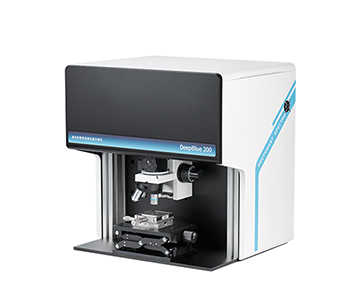
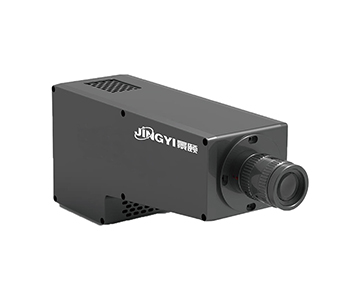
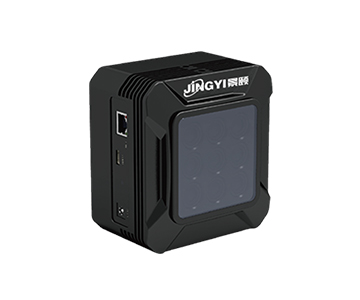
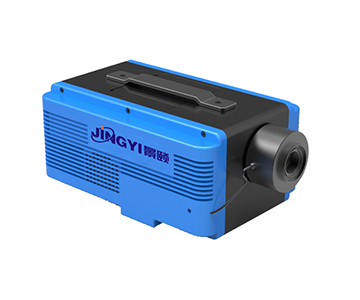
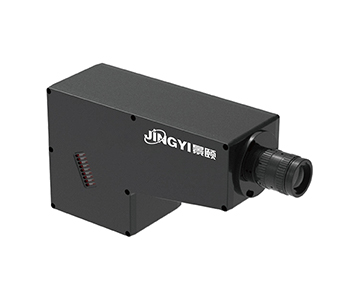
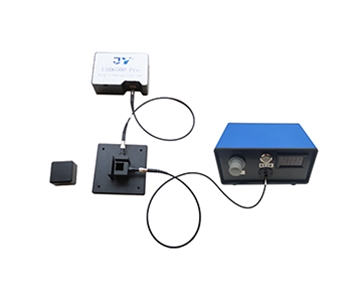
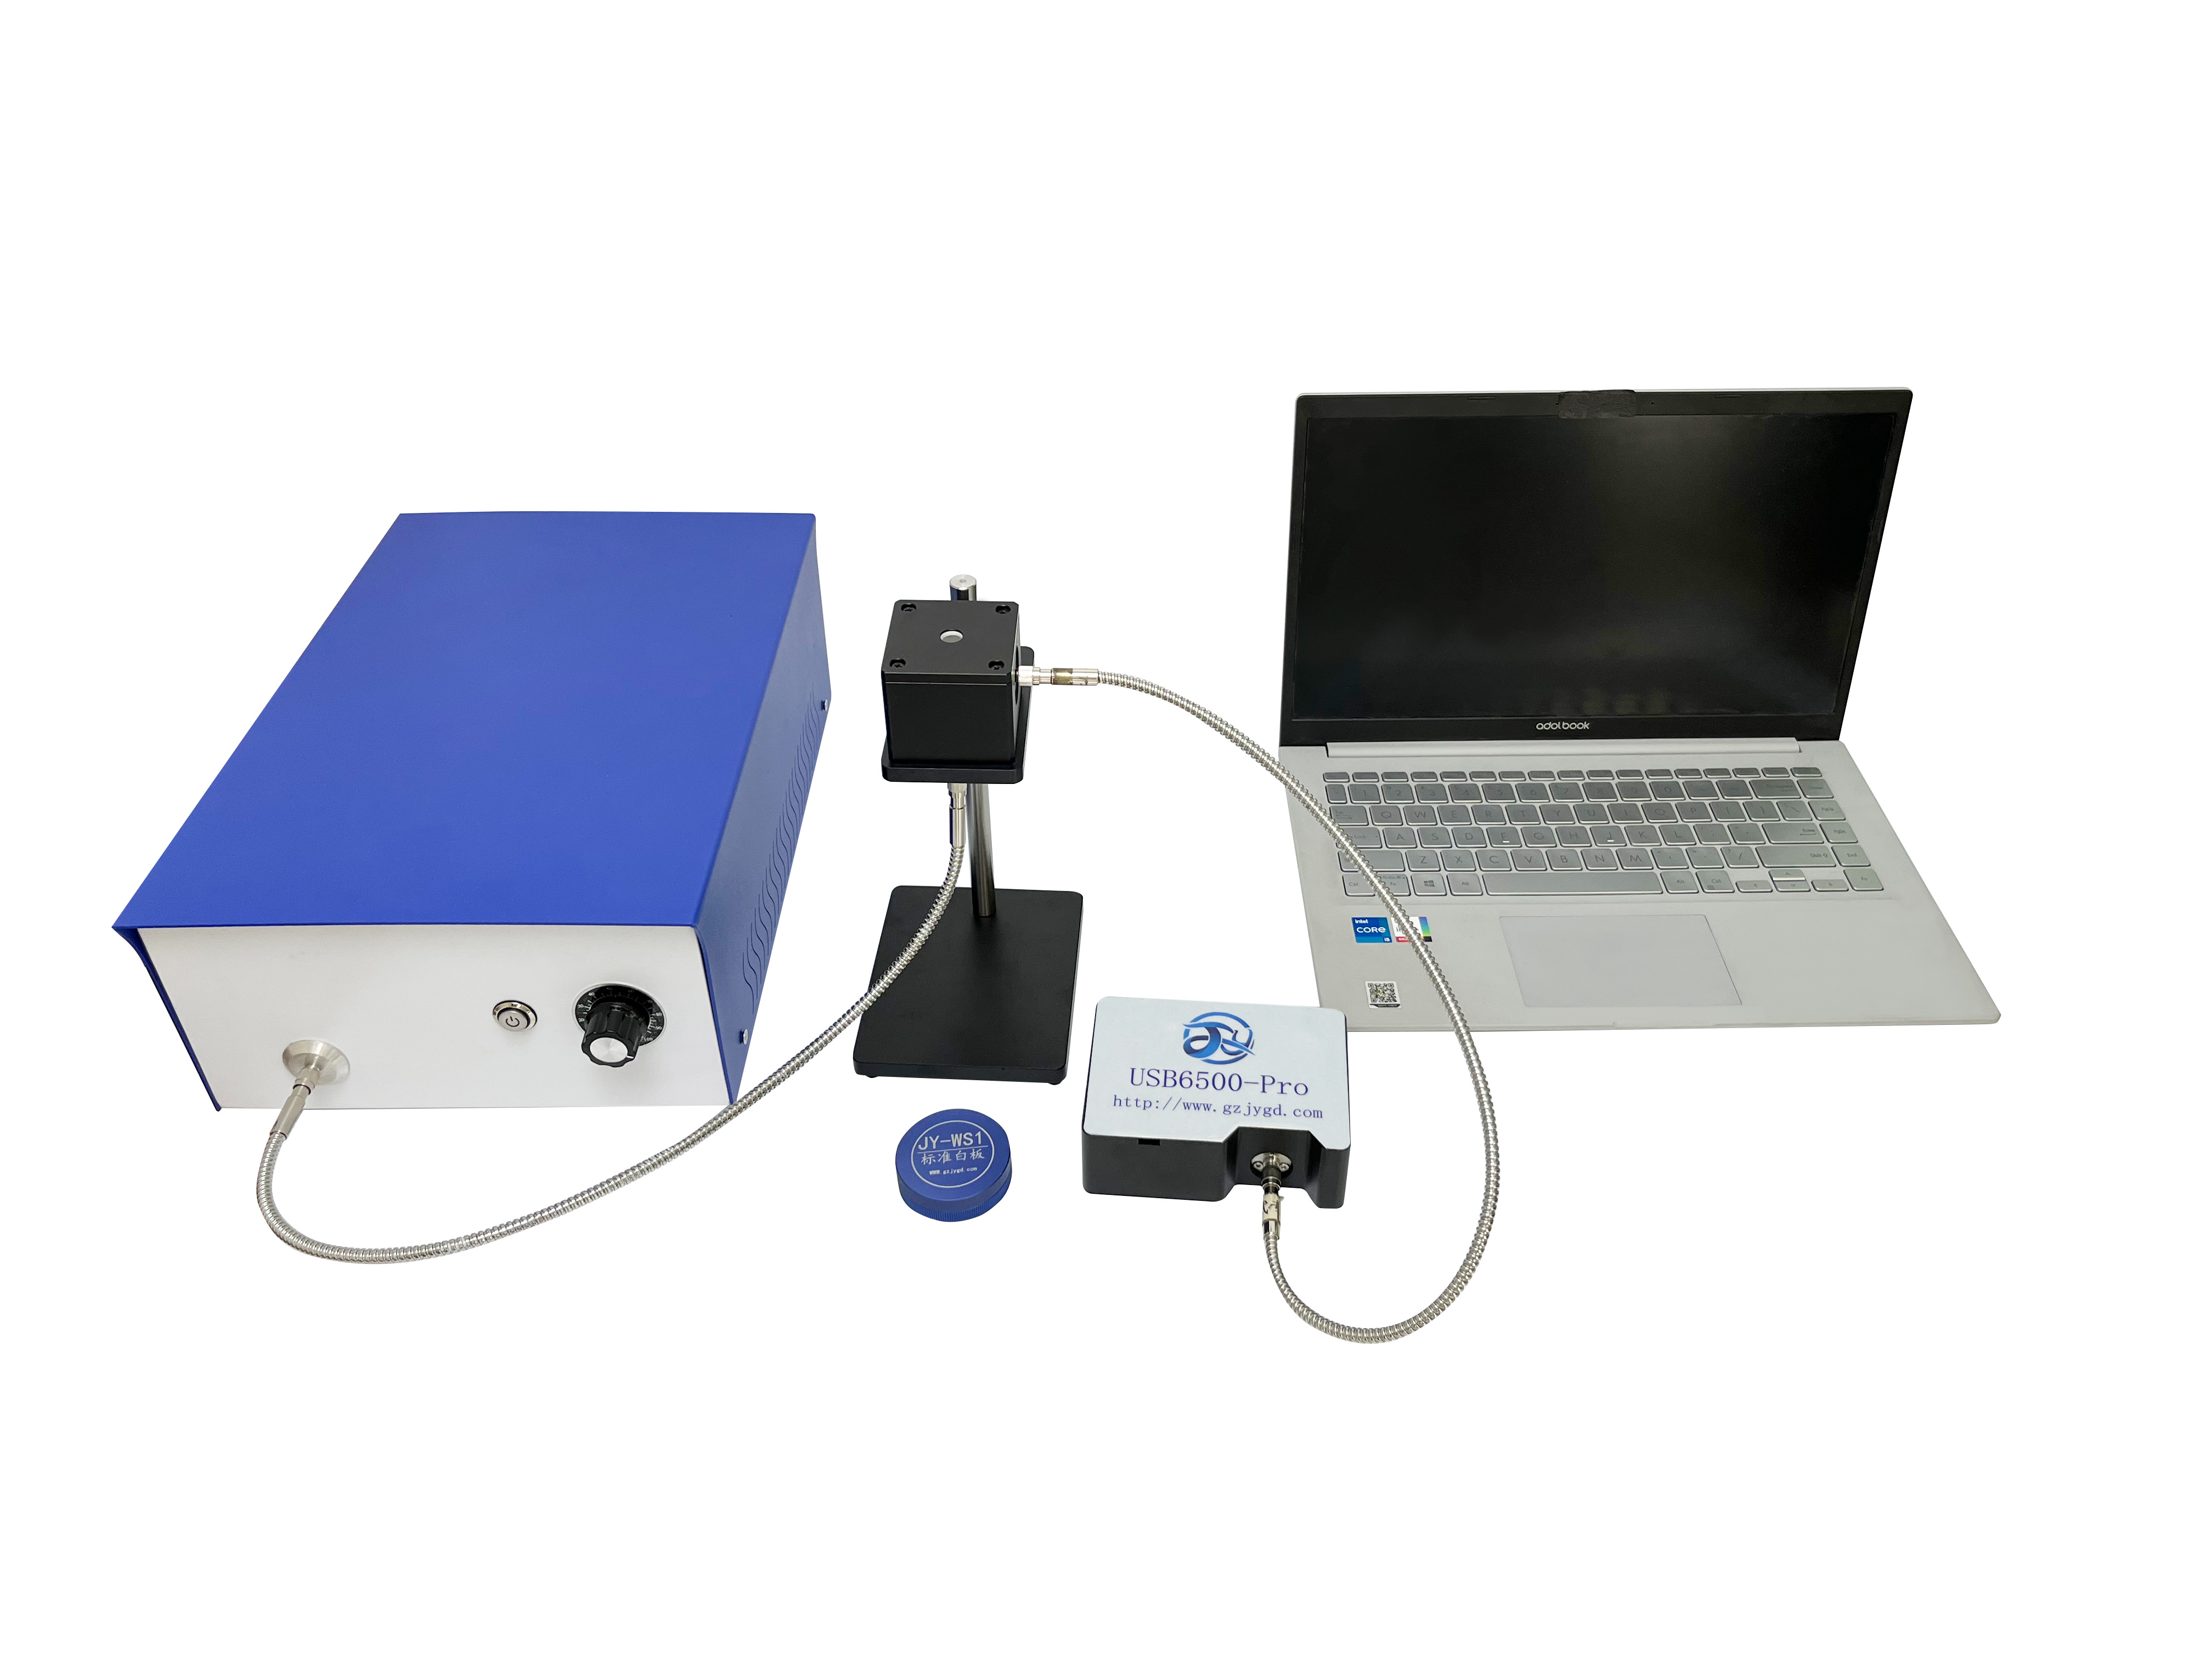
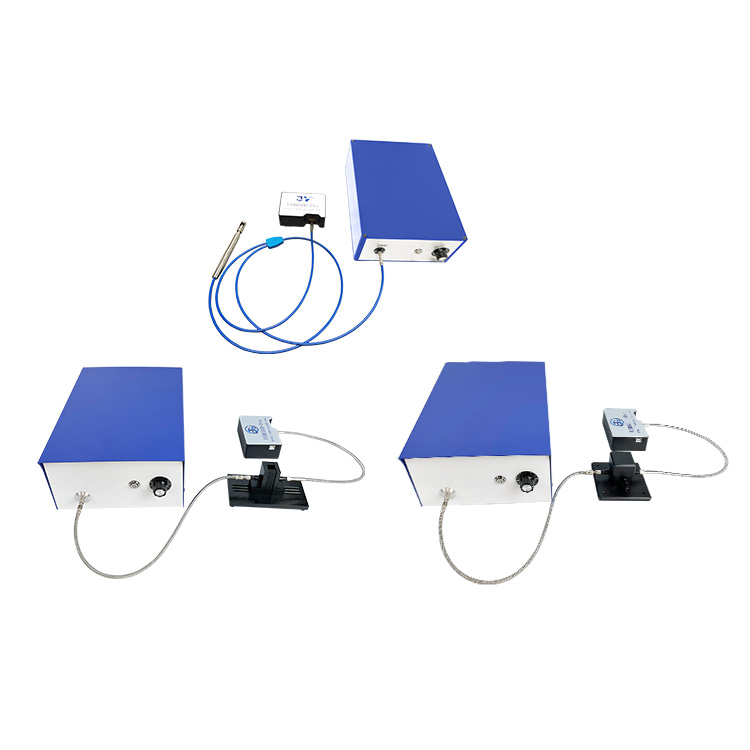
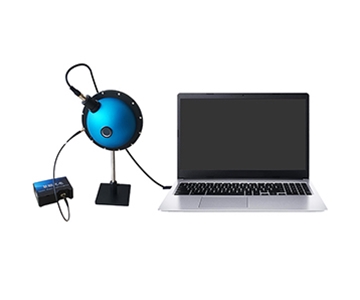
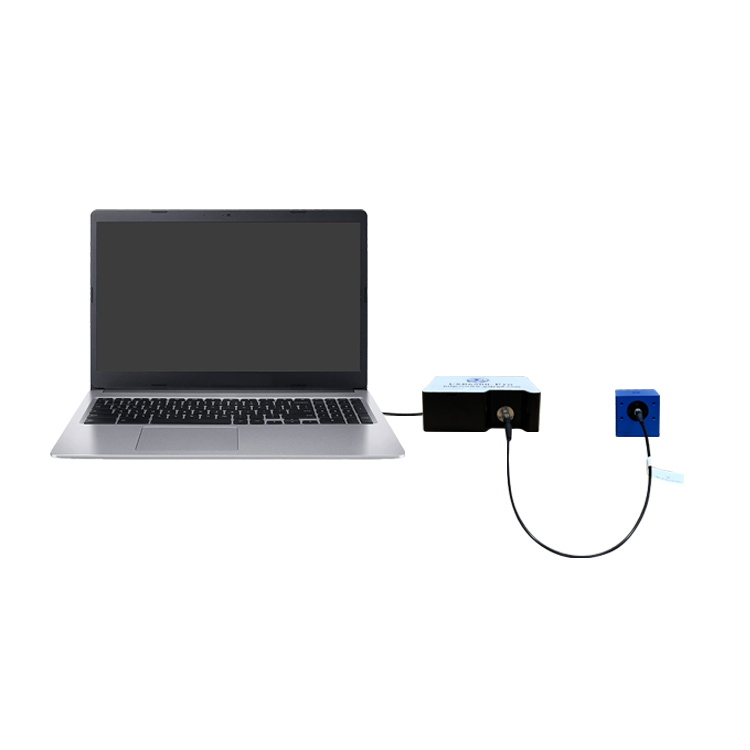
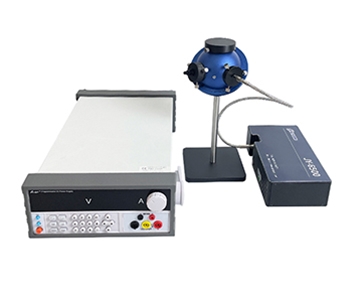
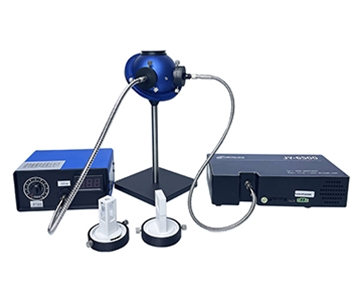
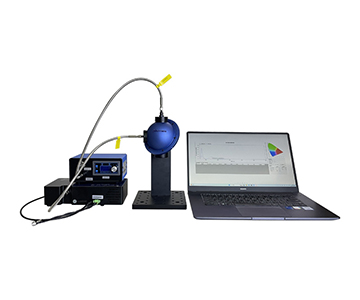
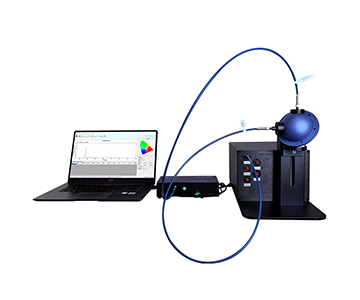
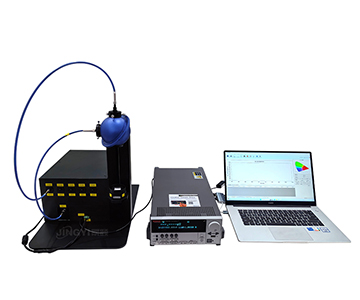
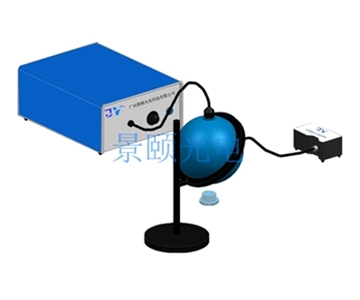
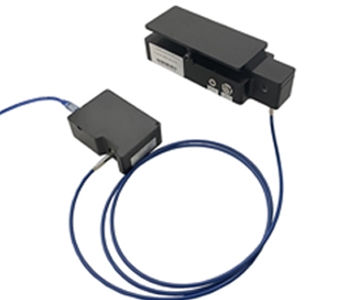
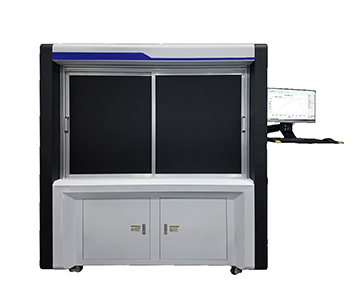
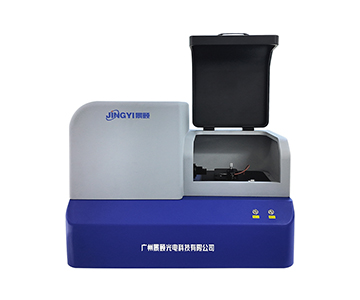
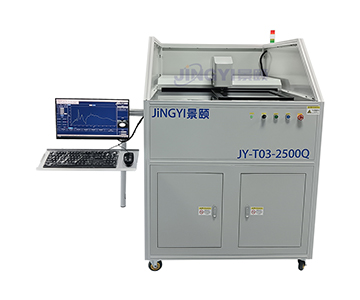
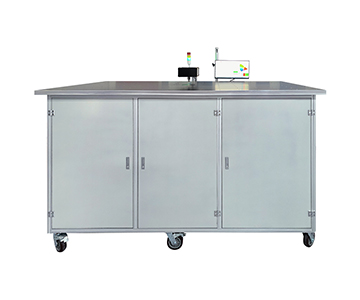
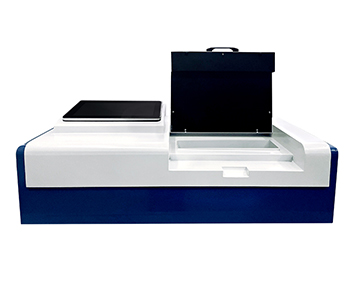
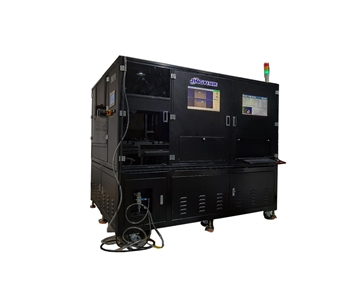
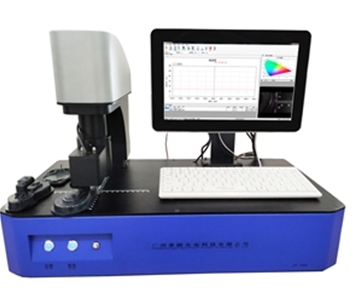
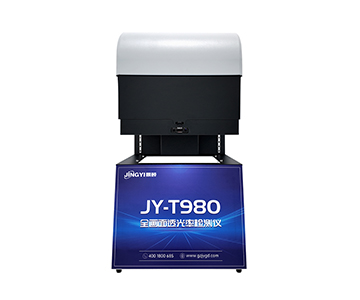
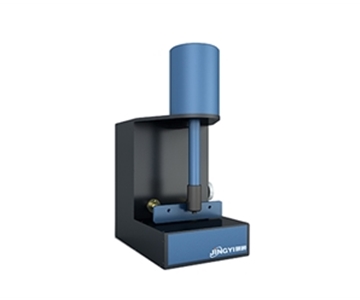
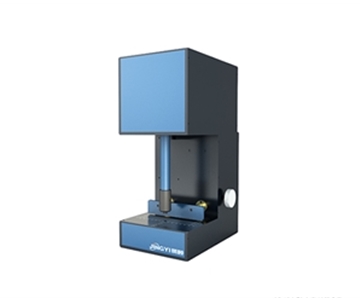
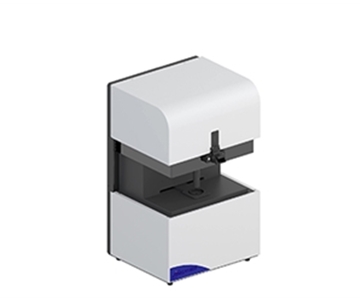
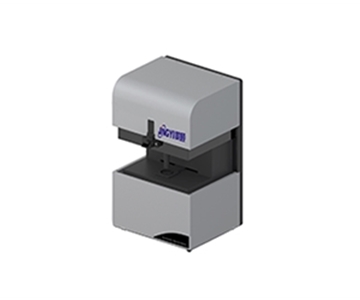
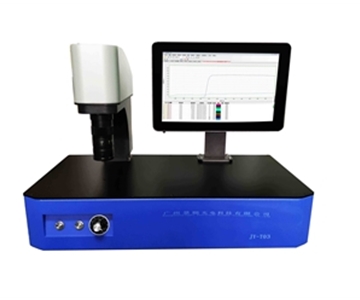
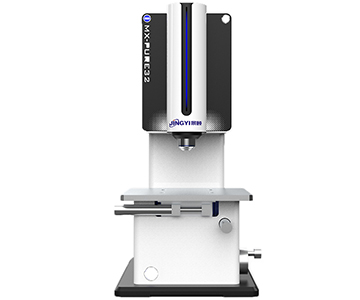
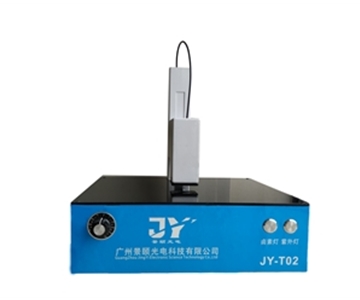
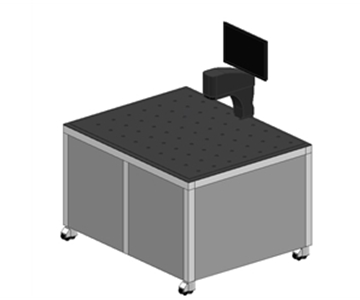
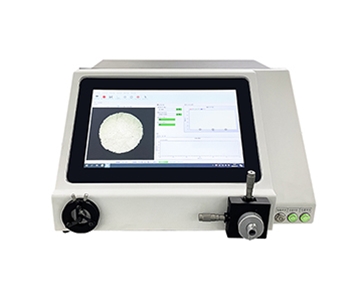
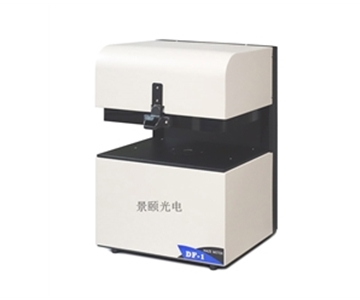
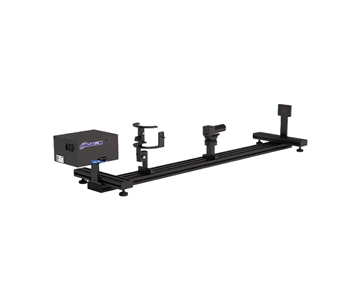
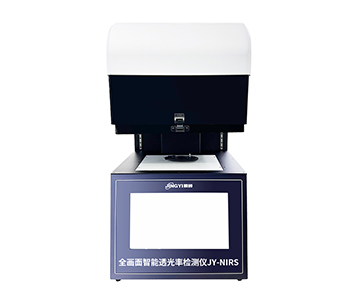
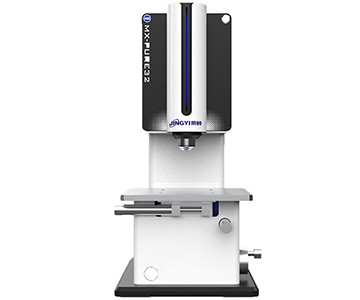
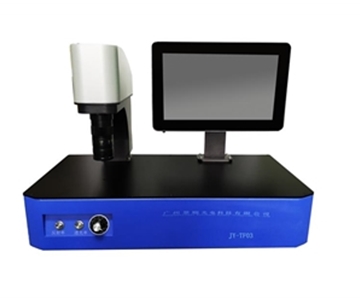
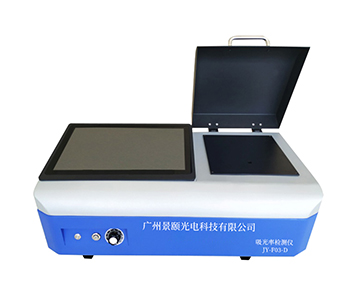
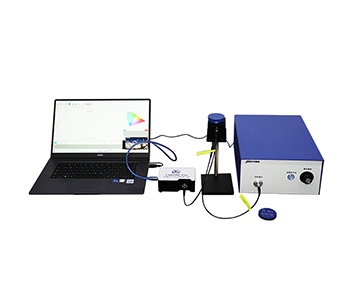
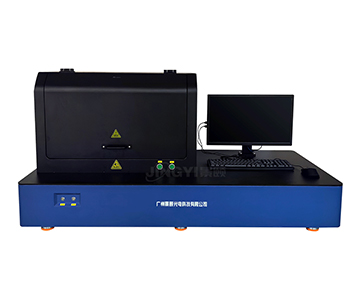
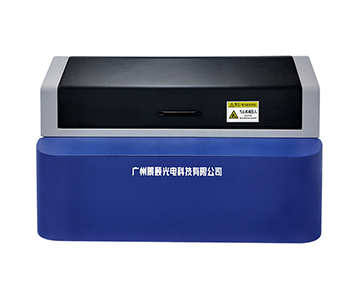
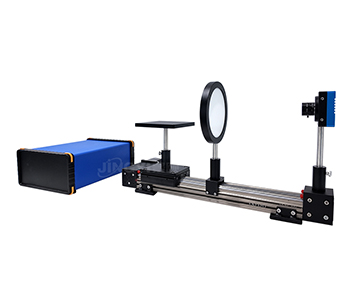
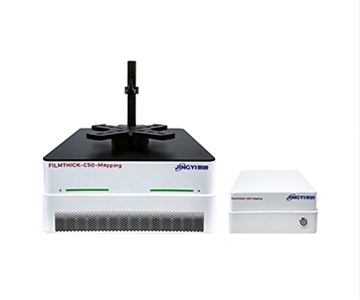
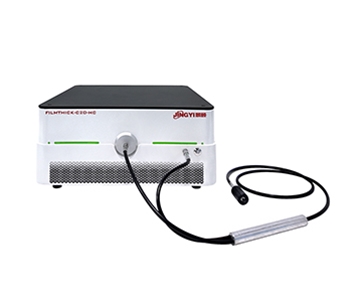
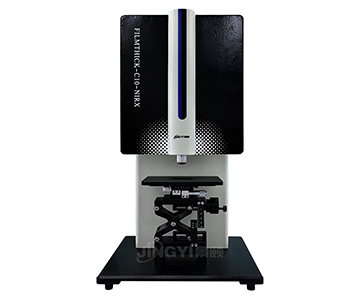
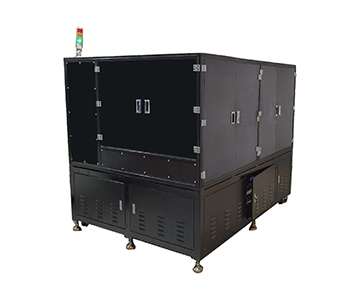
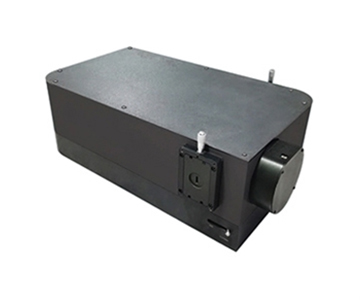
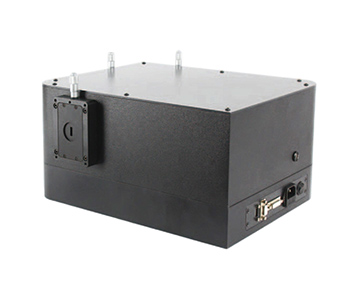
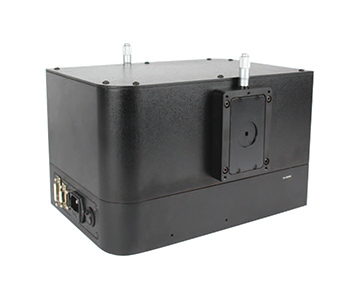
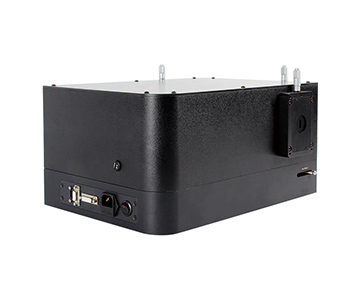
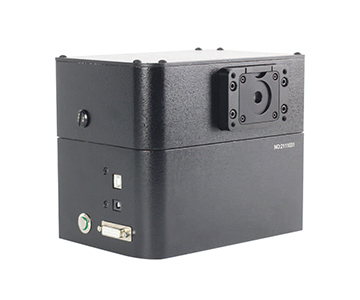
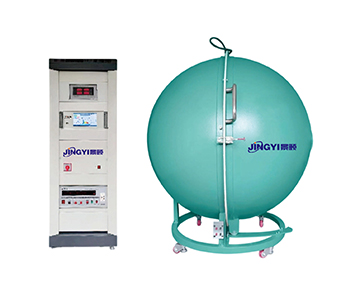
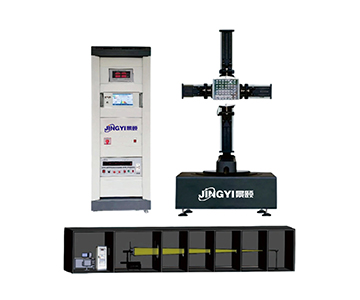
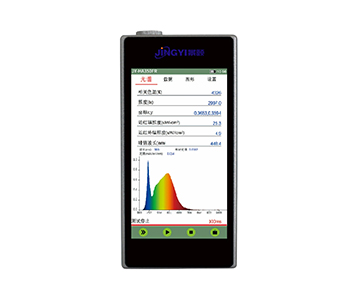
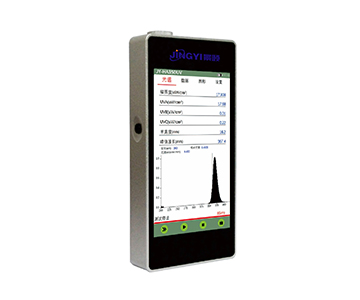
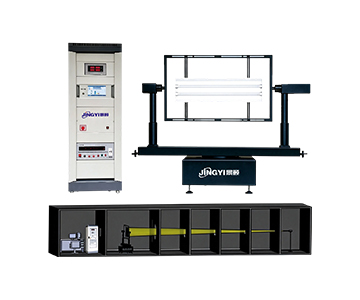
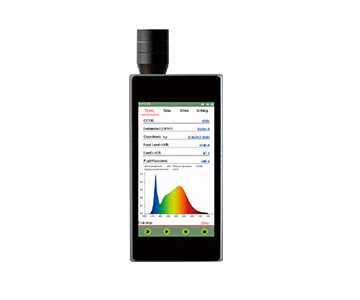
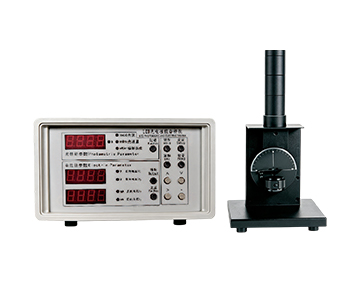
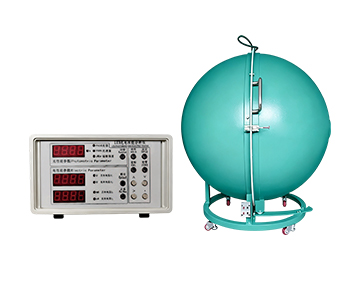
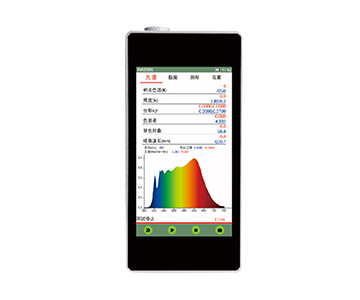
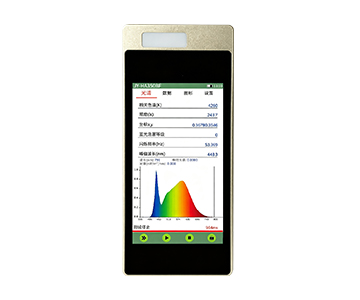
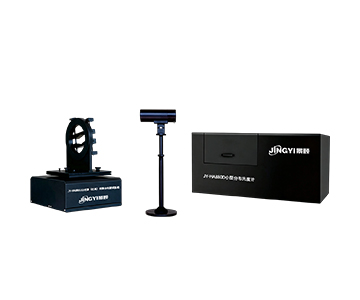
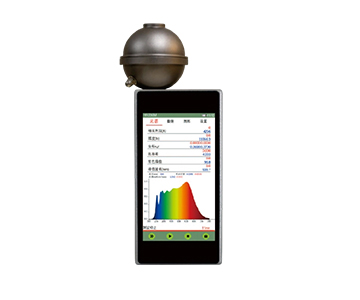
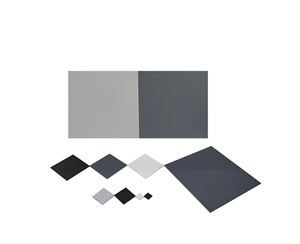
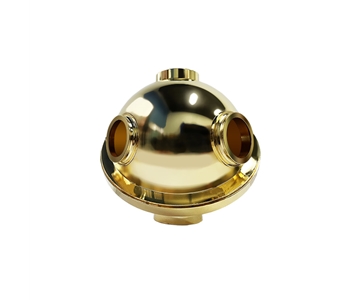
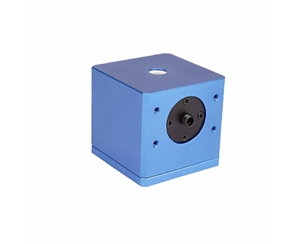
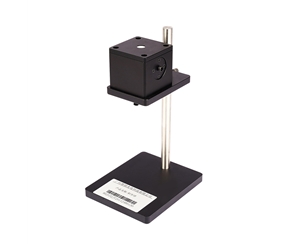
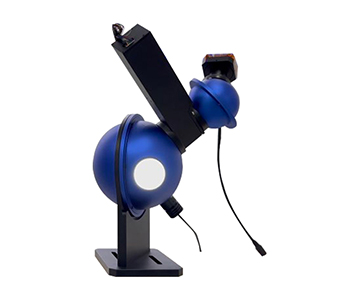
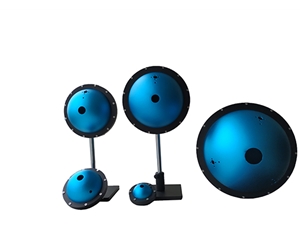
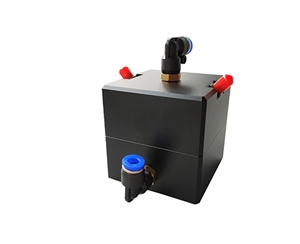
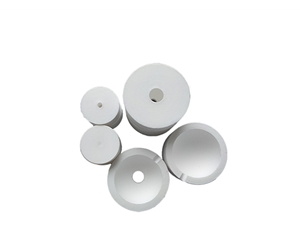
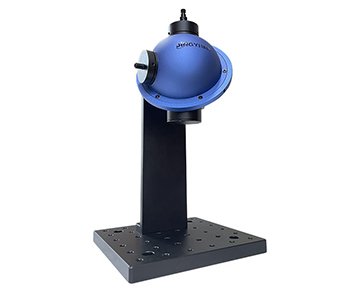
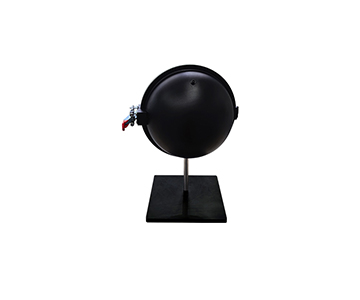
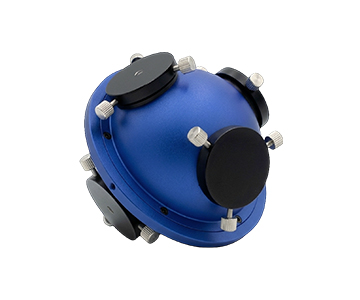
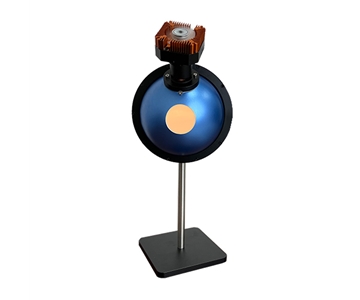
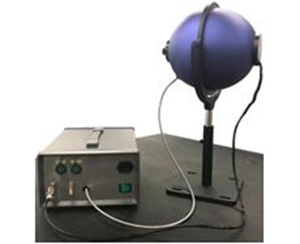
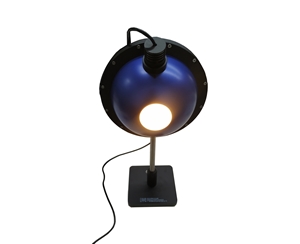
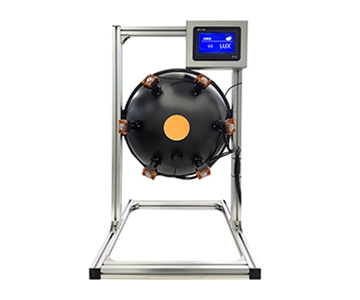
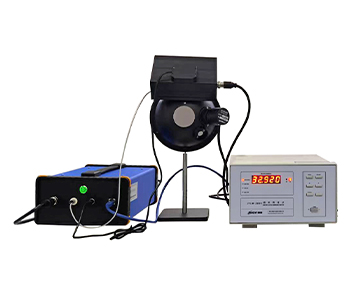
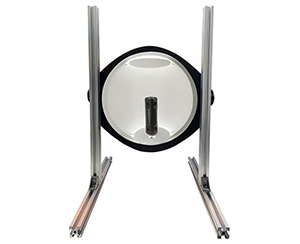
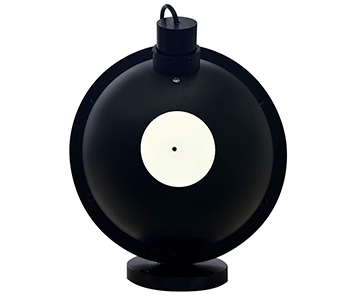
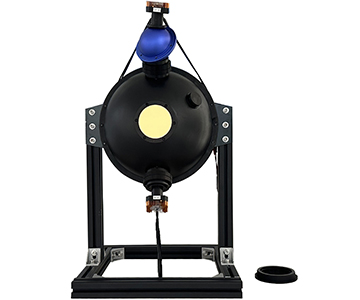
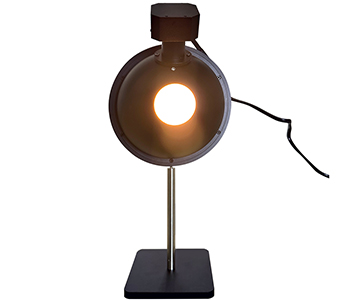
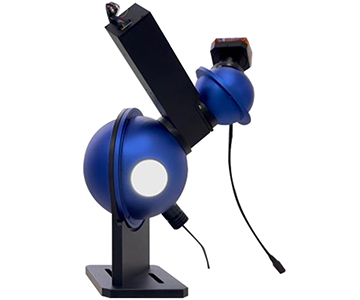
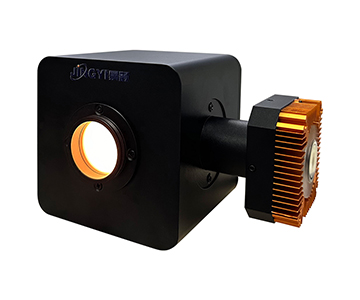
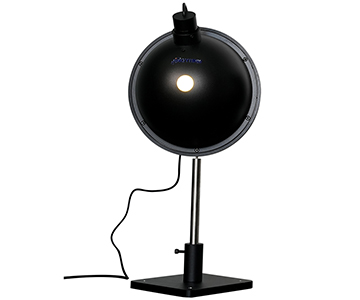
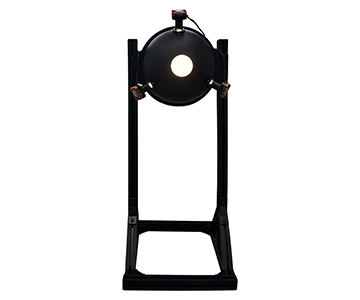
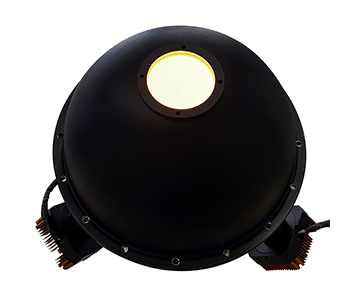
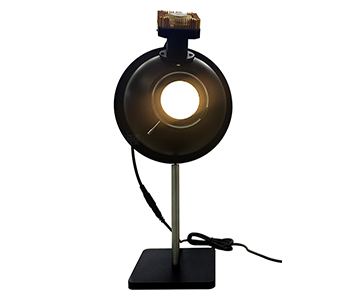
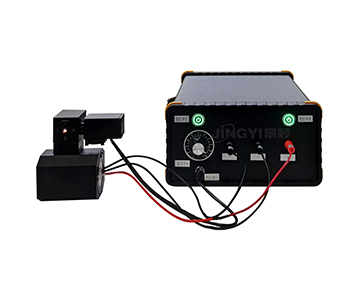
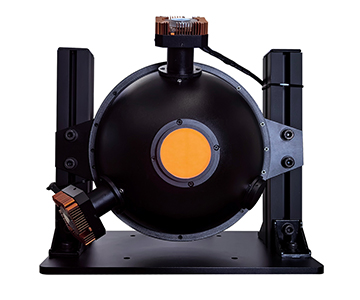
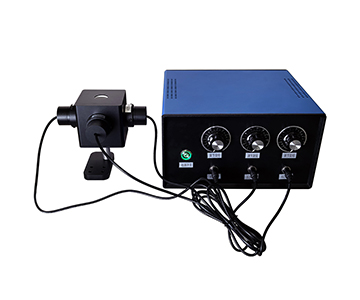
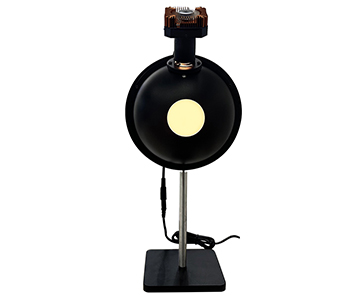
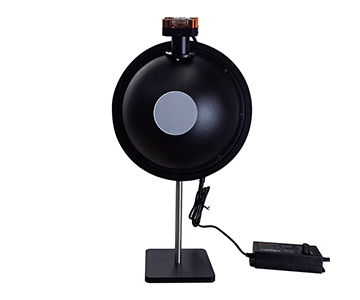
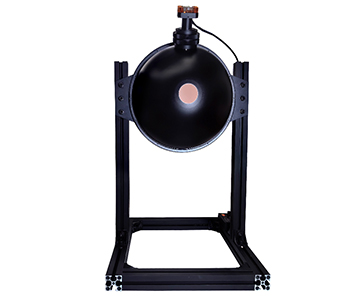
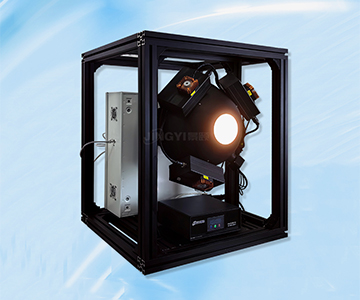
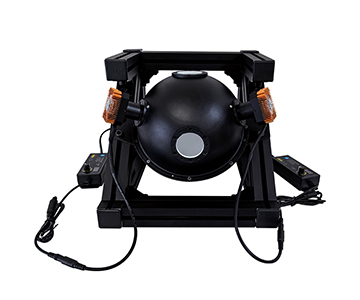
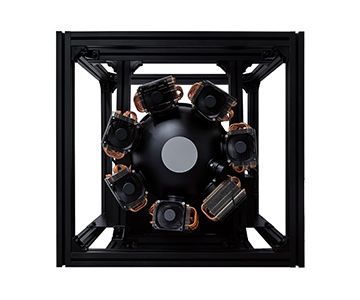
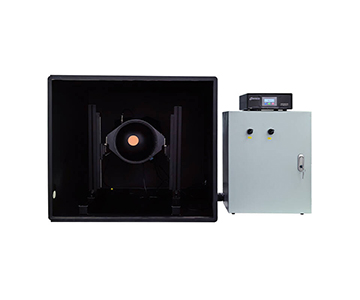
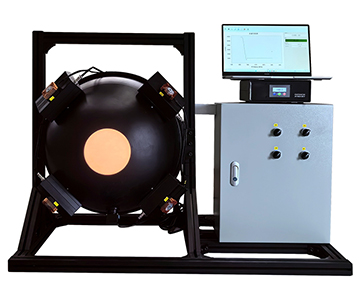
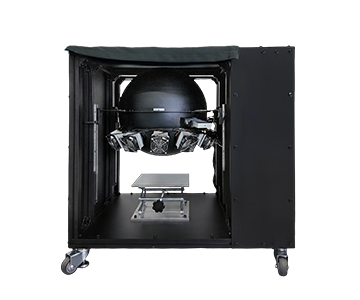
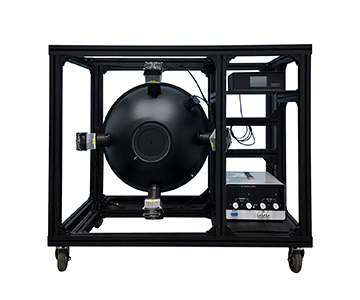
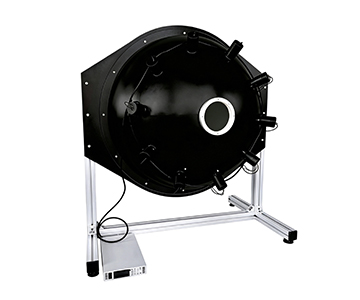
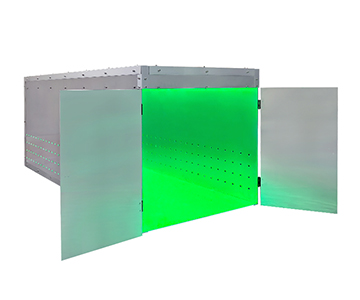
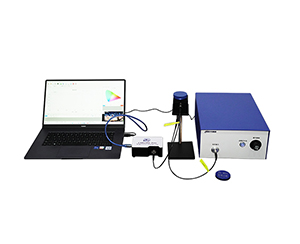
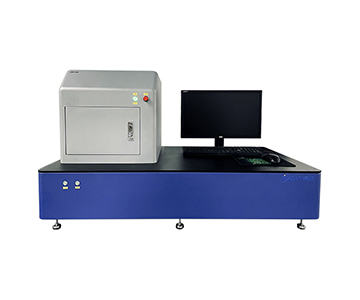
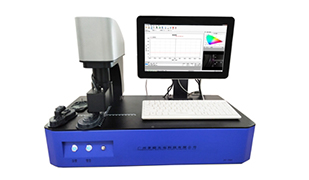
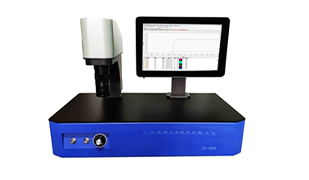
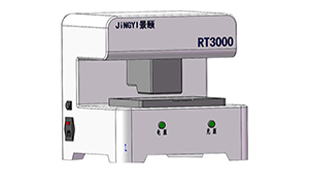
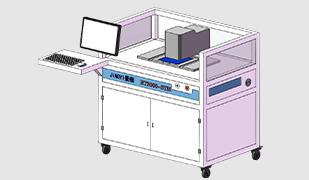
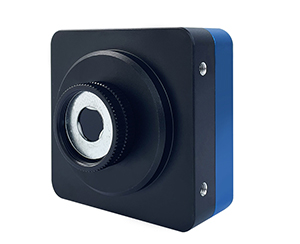
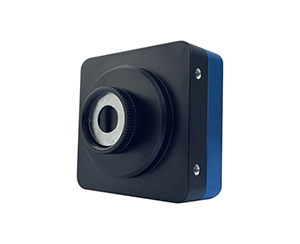
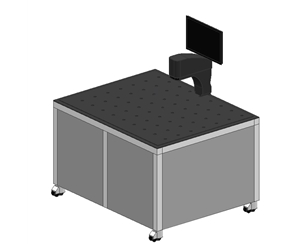
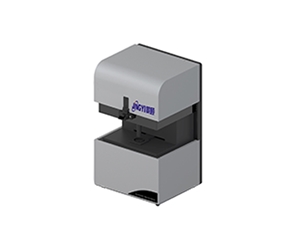
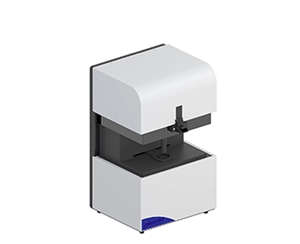
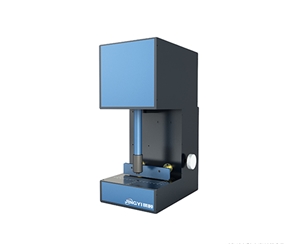
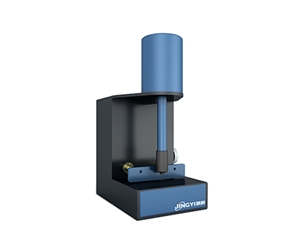
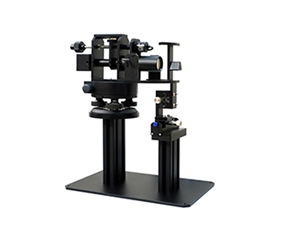
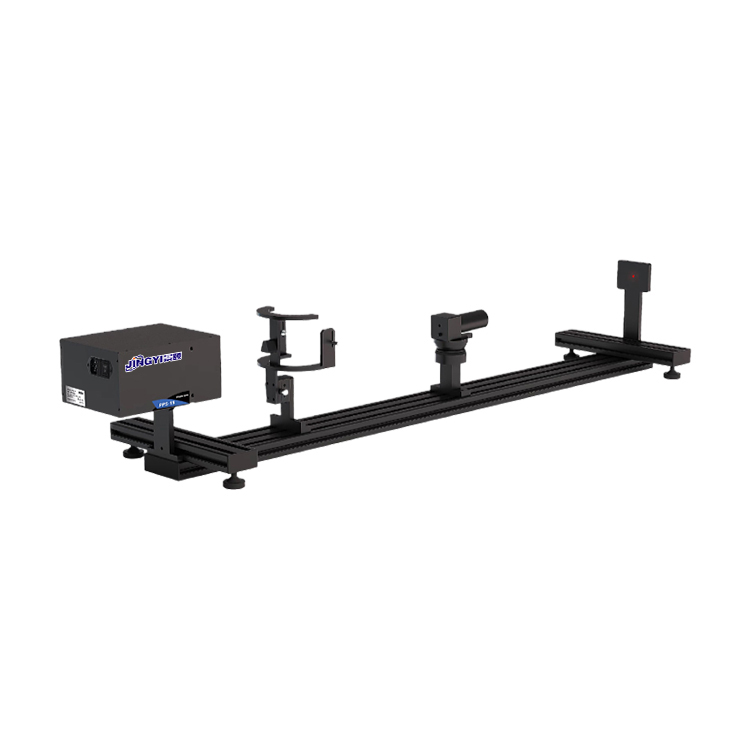
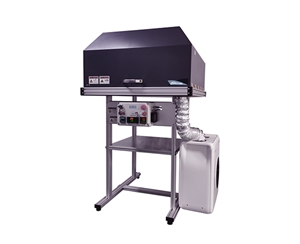
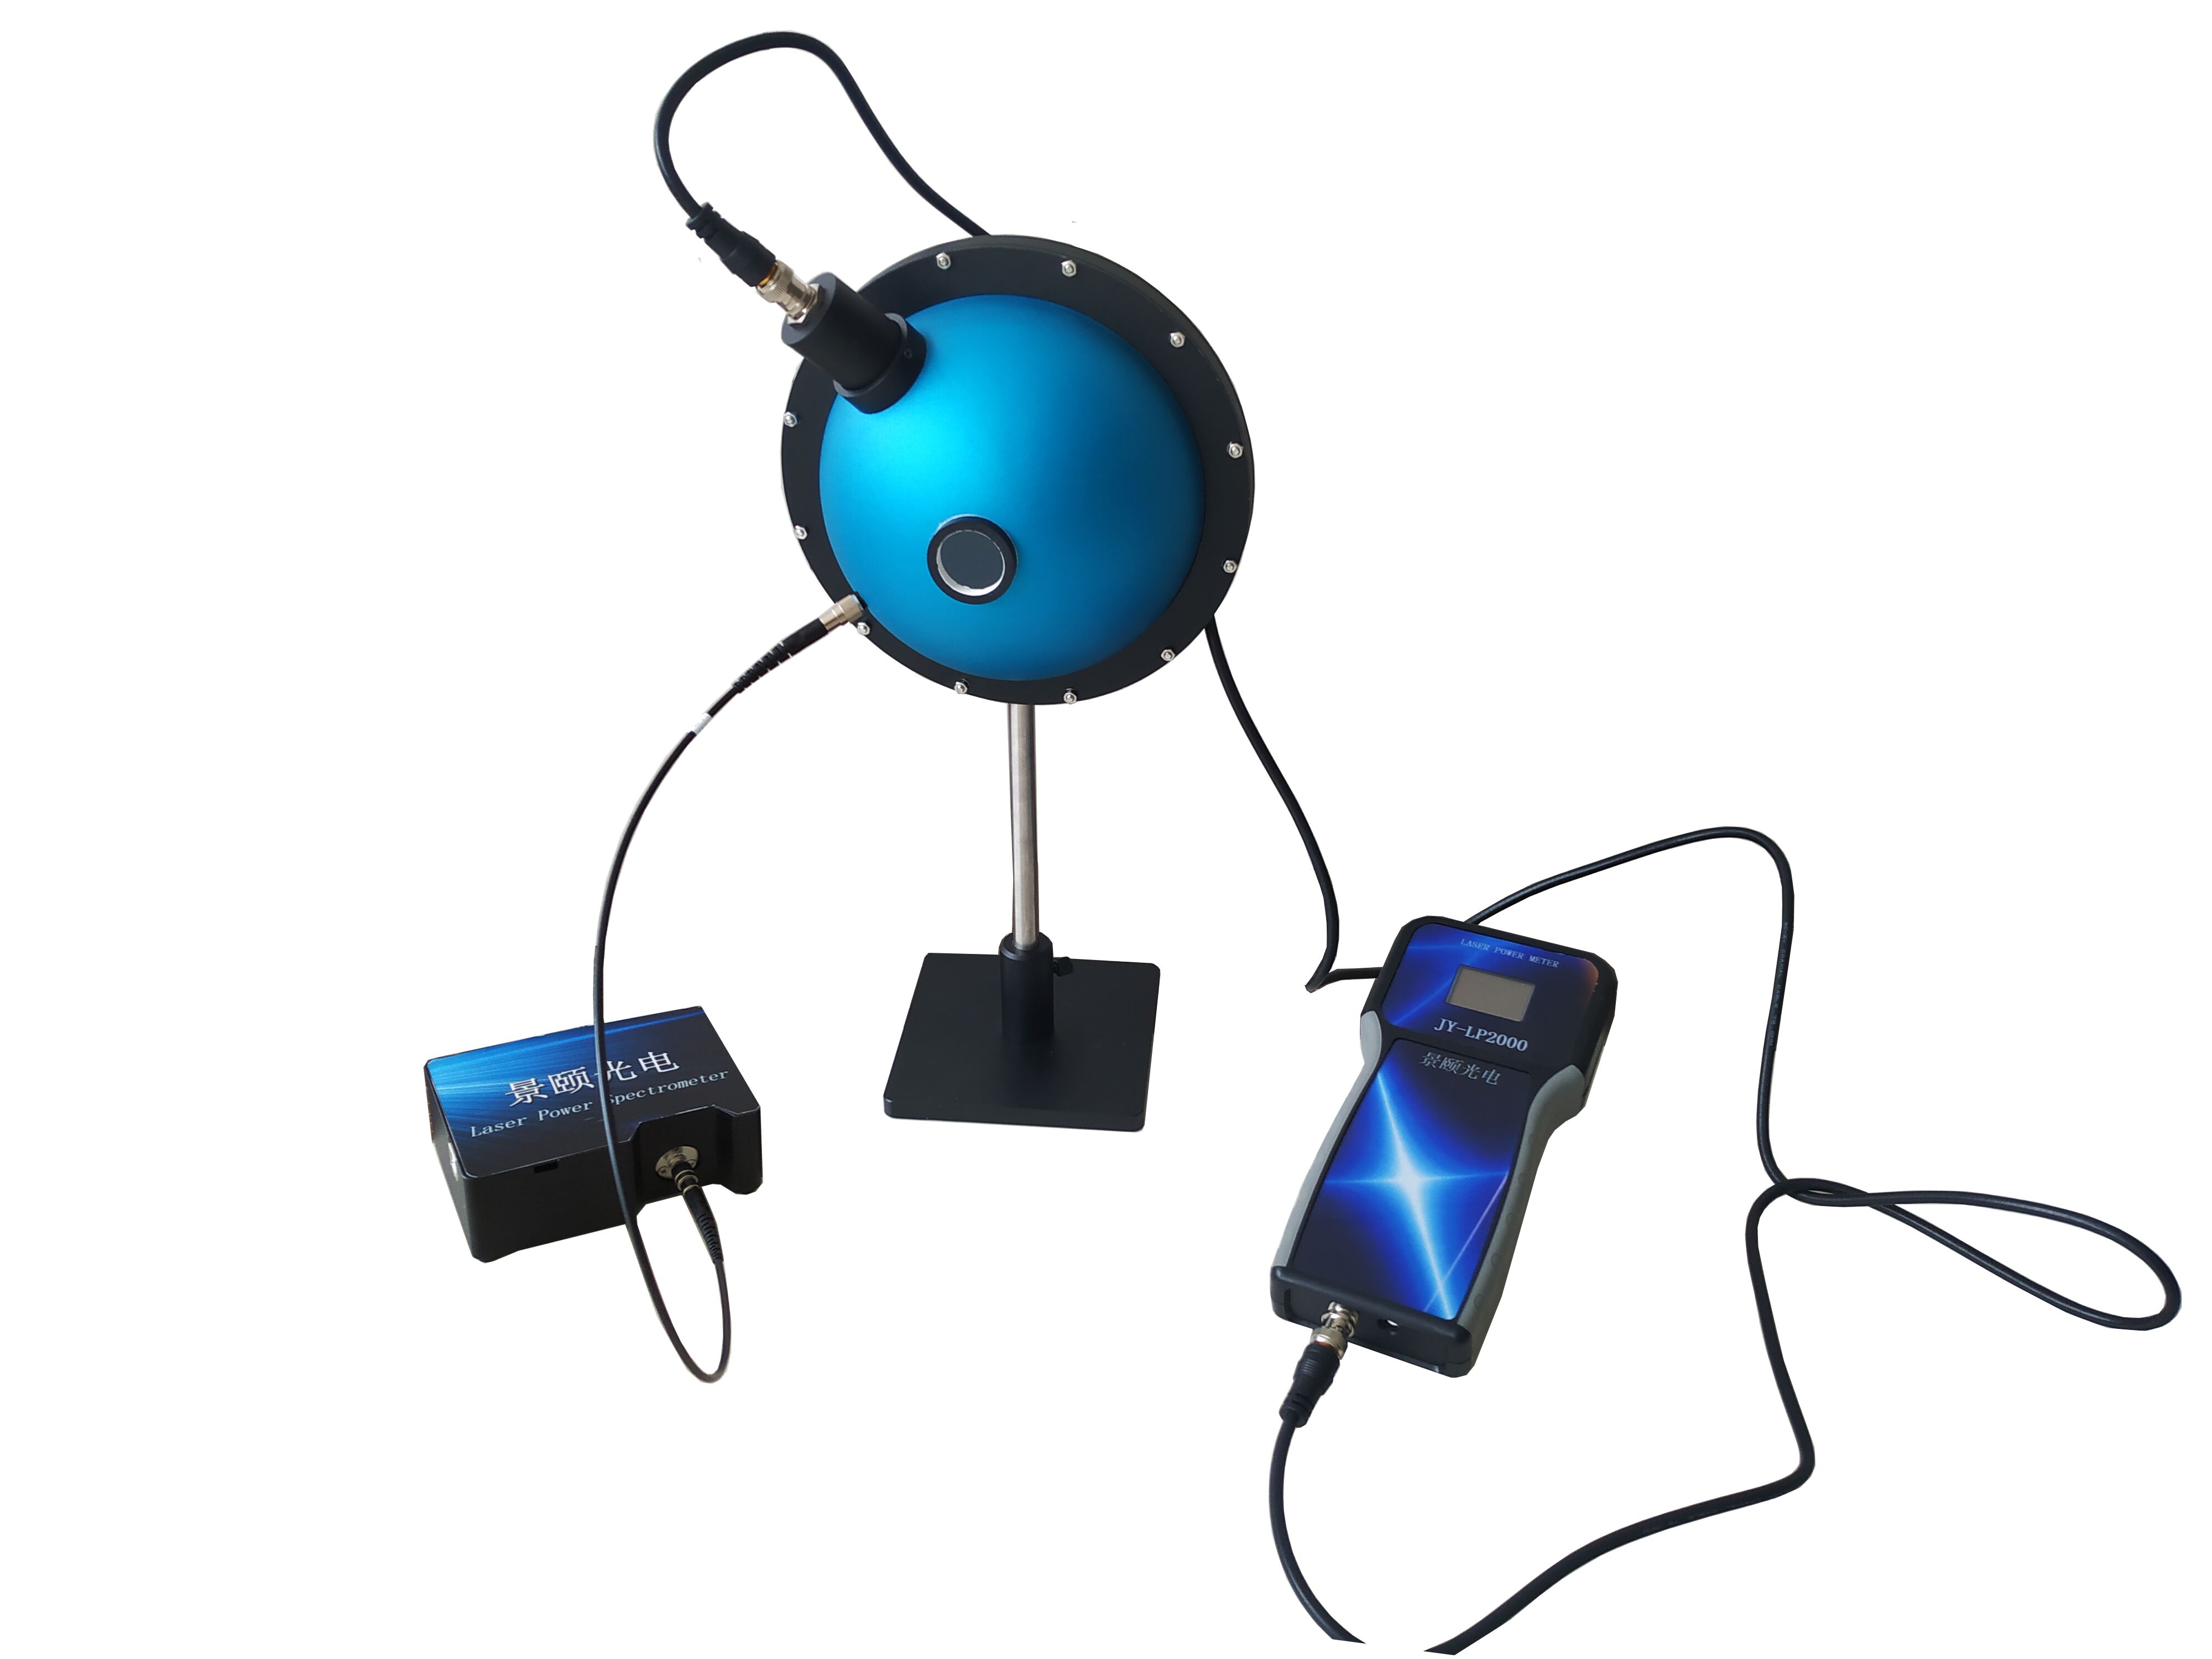
Reflectance measurement on production lines fails quietly. When dark current is not stabilized, low-reflectance samples show spectral drift that standard specs never capture. This guide explains how automatic dark-background subtraction, a 2048-element array detector, and 380–1000 nm synchronous acquisition reduce reflectance measurement uncertainty in coatings, photovoltaic wafers, automotive electrochromic parts, and thin-film inspection. Validation data shows repeatability standard deviation dropping from 0.83% to 0.29% and false-reject rate falling from 4.7% to 1.1% under controlled bench conditions.
Hidden Error Sources in Production-Line Reflectance Measurement
Most reflectance failures on the line are not caused by poor optical alignment. They come from signal drift you cannot see.
A process engineer at a solar-integrated quality station once re-measured the same batch of coated lenses during a night-shift window. The reflectance curve rose by 0.37% across the band. The color difference ΔE crossed the internal control limit. The scrap and rework loss was about $21,400.
The root cause was not the light path. It was detector dark current that had not been stably subtracted. When integrating sphere wall efficiency, lamp aging, and sensor bias stack together, tiny differences in dark gray or low-reflectance films get amplified.
Single-point reflectance meters and visual comparison cannot answer the real question: which wavelength band is drifting?
For automotive mirrors, AR-coated covers, and high-consistency optical parts, the stability of the reflectance-versus-time curve decides whether the OK/NG boundary is trustworthy.
Signal-Chain Reconstruction From the Dark-Current Perspective
Dark subtraction is the starting point, not a feature
In reflectance metrology, the first step is not turning on the light. It is recording the detector background under shielded conditions.
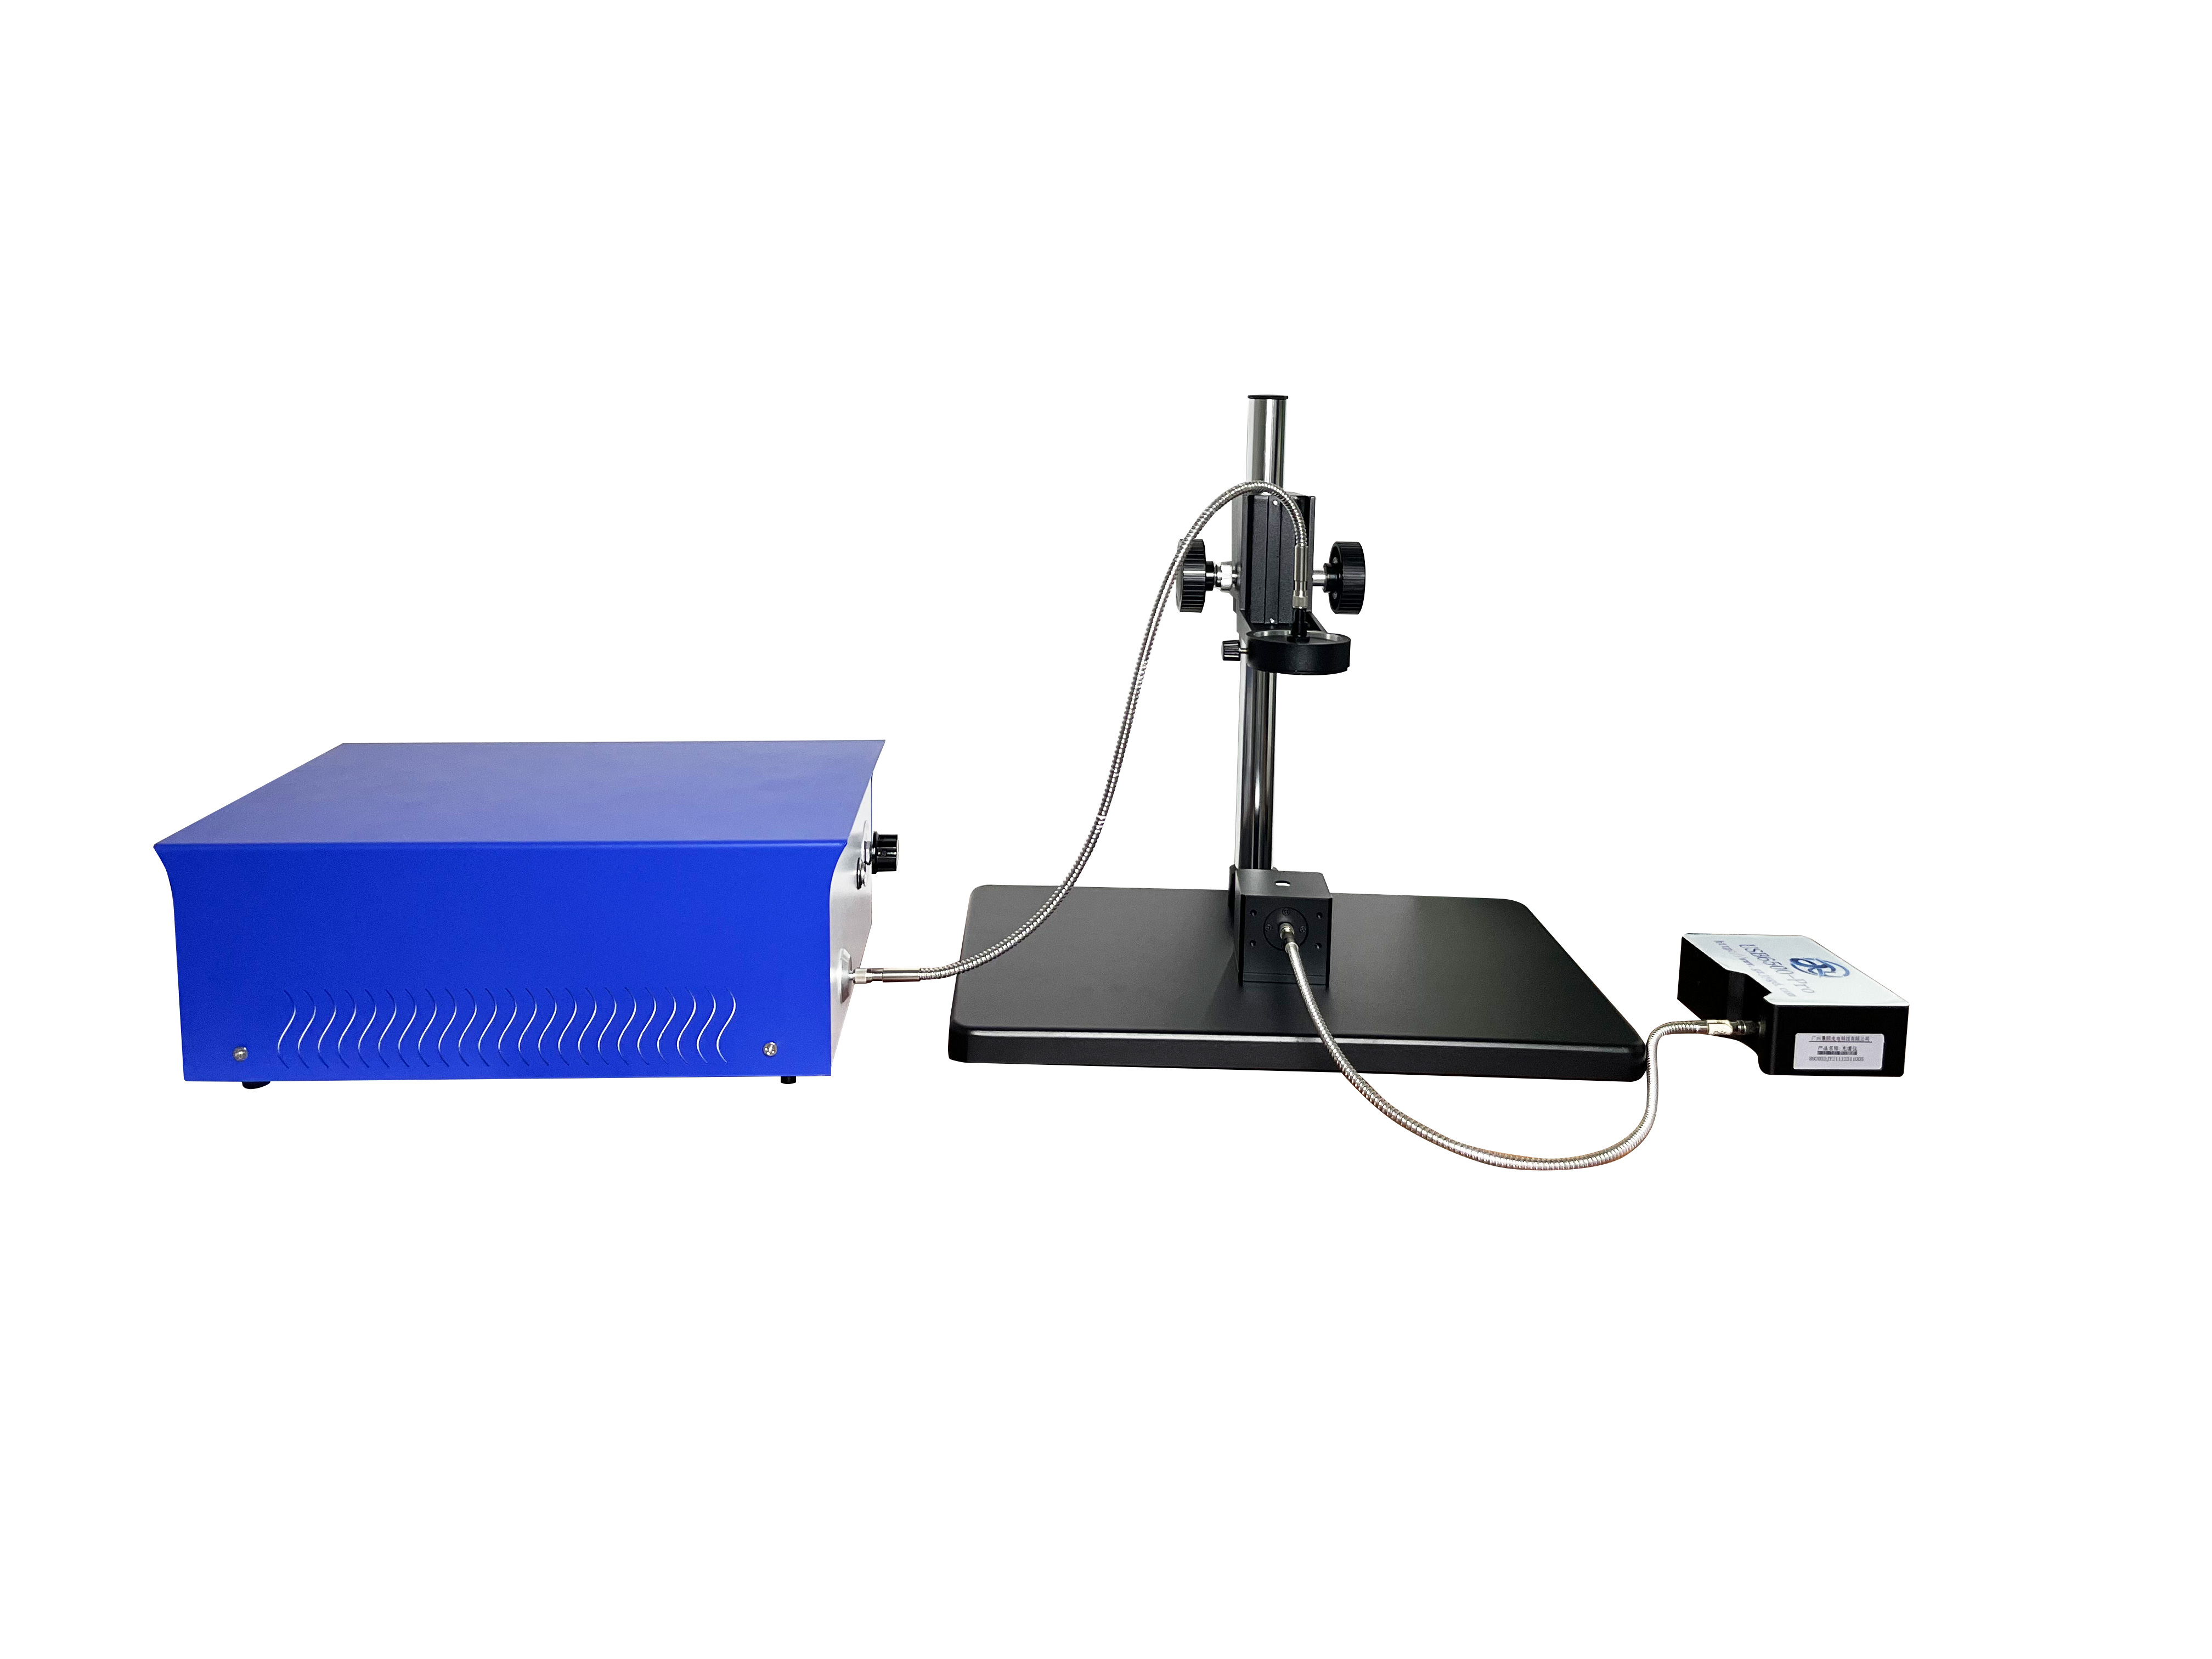
The evaluated system uses automatic dark-background subtraction. Before each sample scan, the sensor bias is zeroed. The raw sample signal is then corrected by the background and normalized to a calibrated white reference.
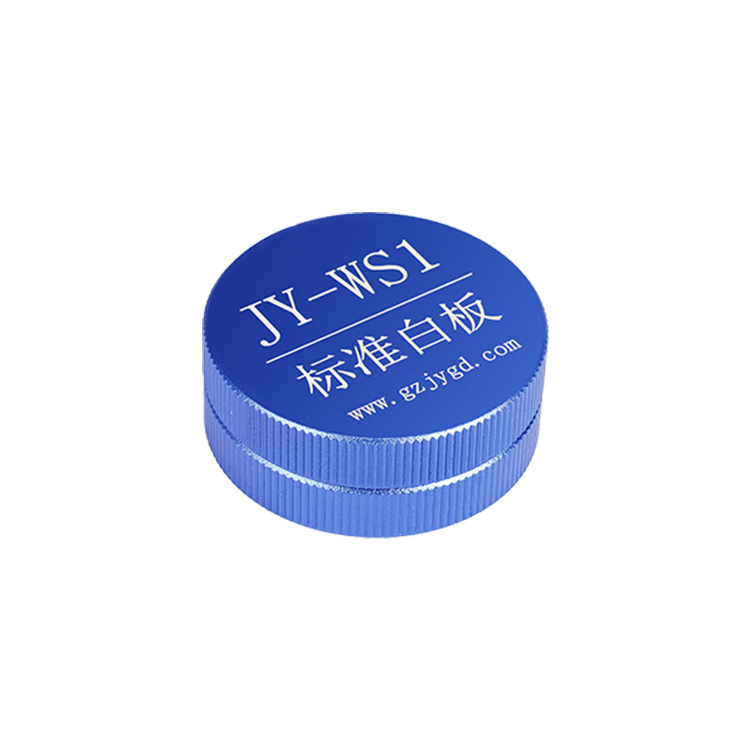
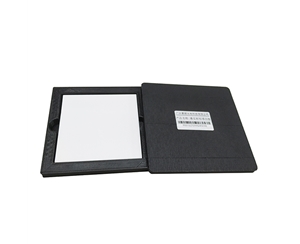
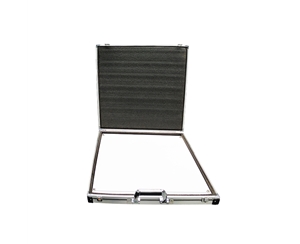
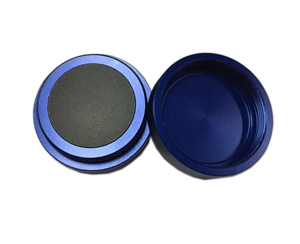
Why this matters: when measuring deep gray coating or low-reflectance film, the 100% reflectance baseline is no longer “stolen” by detector offset. The documented accuracy of 0.01% and instrument repeatability below 1% only hold when the background noise is removed first.
How array detection compresses single-shot noise
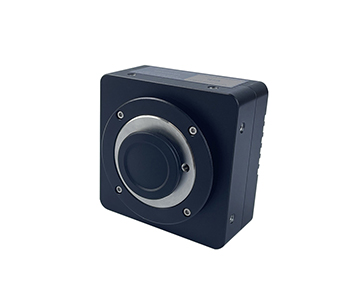
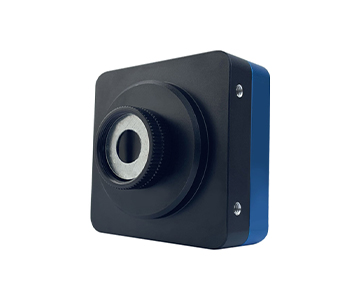
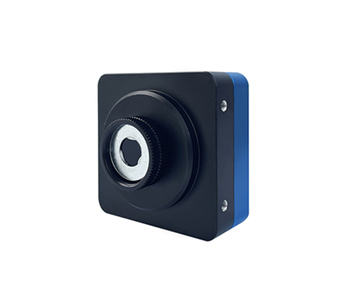
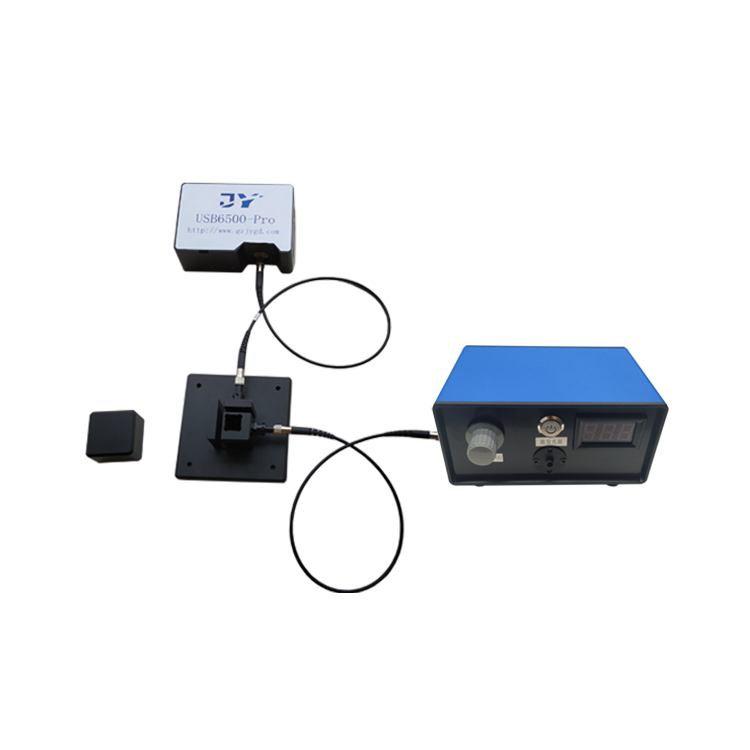
Instead of point-by-point scanning, the configured 2048-array photodetector acquires the full 380–1000 nm band synchronously.
Single-shot acquisition is better than 1 second. That short window reduces accumulation of lamp flicker and detector thermal drift during long integration. Wavelength accuracy is below 1 nm, with repeatability of 0.2 nm.
That repeatability is what lets the same sample produce comparable peak positions between a cold morning run and an afternoon recheck. For jewelry color-band identification or wafer edge uniformity inspection, this is the floor condition for spectroscopic measurement, not a premium spec.
Joint Interpretation of Broadband Spectra and Color Space
From reflectance curve to Lab colorimetry
Average reflectance alone misses subtle defects.
The measured system outputs wavelength-resolved reflectance, mean reflectance, XYZ, and CIELab parameters. This connects spectral shape with perceived color.
Example: a phone cover with an extremely faint coating tint may show only 0.2% change in average reflectance. But the Lab b* channel has already crossed the limit.
In paint and ink sorting, the combined “curve + colorimetry” view separates batches that look identical in average reflectance but differ in hue. The line can set wavelength upper and lower limits, auto-judge OK/NG, and log yield statistics.
Field value of dynamic reflectance measurement
Electrochromic auto-dimming mirrors change reflectance with applied voltage and time. Static numbers are not enough.
The system records reflectance-versus-time curves. It captures switching response at operating temperature, fail-safe state after power loss, and reverse-trigger delay.
The field check is not just “what is the number”. It is whether the slope is clean and the hysteresis is symmetric. If dark current is not stable, the time-axis curve shows fake steps and misleads response-time interpretation.
Quantitative Comparison Before and After Deployment
Data under typical bench conditions
A general industrial inspection station adopted automatic dark subtraction and array-based synchronous sampling. Based on typical deployment records, the following changes were observed:
| Metric |
Before |
After |
| Repeatability std. dev. on low-reflectance samples |
0.83% |
0.29% |
| Night-shift false-reject rate |
4.7% |
1.1% |
| Full-spectrum analysis time per part |
3.2 h |
0.9 h |
The standard deviation fell by 65.1%. False rejects dropped by 76.6%. Analysis time compressed by roughly 3.5×.
In plain terms: the biggest gain was not speed alone. It was decision confidence. Fewer good parts were killed by spectral noise.
Traceability and standards alignment
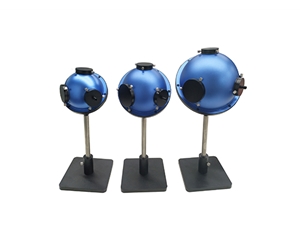
The measurement architecture aligns dark-subtracted curves with standardized total reflectance definitions under 8° integrating-sphere illumination.
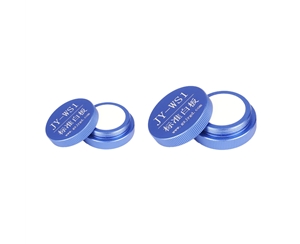
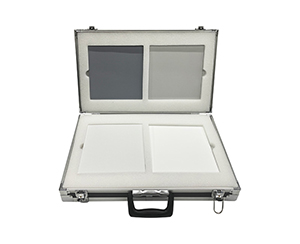
For plastics, coatings, and export-bound materials, traceability matters more than a single factory calibration. Procurement teams should confirm alignment with ISO reflectance measurement practices, white-reference calibration intervals, and third-party metrology certificates. Cross-lab comparability depends on documented uncertainty, not just vendor-stated accuracy.
Reusable Rules Across Coatings, Photovoltaics, and Automotive Electronics
Three patterns transfer across industries.
First, dark background must be closed-loop and automatic. For low-reflectance, dark, or high-absorption samples, manual dark subtraction always introduces timing error between operators.
Second, broadband beats single-point. In solar wafer inspection, a 380–1000 nm curve exposes coating thickness non-uniformity. A single-point meter shows the result but hides the cause.
Third, color space must enter the QC logic. If thin-film inspection only controls mean reflectance, color shift passes unnoticed. Lab and dominant-wavelength parameters turn “looks wrong to the eye” into settable numerical limits.
These rules let one spectroscopic architecture migrate across new-energy materials, optical components, and gemology without rebuilding the measurement chain.
Boundaries and Real Constraints
This approach is not universal.
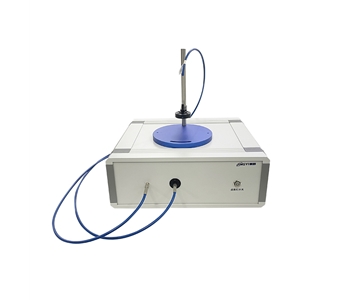
For thin glass requiring simultaneous transmittance and reflectance in one path, a single-reflectance sphere needs an added transmission module. For sub-millimeter micro-area coating uniformity, the standard 9 mm aperture is too large; a microscopic reflectance accessory is required.
Automatic dark subtraction controls background drift, but it cannot compensate for long-term halogen lamp aging and correlated color-temperature shift. Periodic white-reference calibration remains necessary.
Samples need flatness and consistent contact pressure. Curved parts require custom fixtures. In continuous high- or low-temperature environments, detector thermal-drift behavior must be modeled separately. Lab-zone performance should never be extrapolated directly to extreme production environments.
Frequently Asked Questions
Why does a low-reflectance black sample still show curve jitter after dark subtraction?
Dark correction only removes detector bias. Weak black-sample signals remain sensitive to lamp ripple, sphere stray light, and incomplete sample shielding. Check source stability, mechanical contact, and edge masking before blaming the detector.
Is 380–1000 nm enough for automotive mirror inspection?
For visible-band reflectance and colorimetry, yes. If the electrochromic response extends into near-infrared control bands, specify an extended 900–1700 nm configuration instead.
How should Lab color limits be set for OK/NG judgment?
Baseline multiple qualified golden samples first. Derive control bands for ΔL, Δa, and Δb, then add reflectance-curve shape constraints. A single threshold will over-reject good parts.
How should a low-volume, multi-spec line balance cost?
Choose a base system with customizable aperture and software profiles for multiple recipes. Cover high-run specs first. Add micro-area or transmittance-reflectance modules only when process data justifies the expansion.
How can I independently verify long-term stability?
Run weekly reflectance regression on a standard white reference. Record 5-minute zero-offset and repeatability. Use an accredited metrology provider for periodic certification, and audit the traceability chain rather than trusting vendor-stated specs.
Reference Information
Sources
: Public product technical documentation, typical production-line validation records, and ISO-aligned reflectance measurement practices; illustrative deployment figures are labeled as typical-condition estimates.
Author
: Cai Xiaodong, Senior Application Engineer, Jingyi Optoelectronics — 12 years in spectroscopic measurement and industrial quality-control systems.
Conflict of Interest
: Jingyi Optoelectronics manufactures reflectance and optical metrology systems. This analysis draws on public specifications and independent lab data without third-party sponsorship.
Intended Use
: Educational and technical-evaluation reference only. Validate all equipment choices through on-site proof-of-concept testing under your own process conditions.
Updated
: October 2026
For detailed specifications and application notes on reflectance measurement systems, search "Jingyi Optoelectronics reflectance measurement system" or visit the technical library.