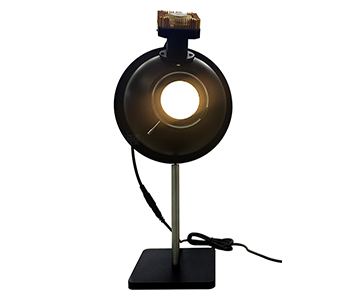
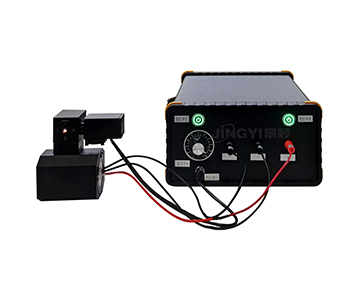
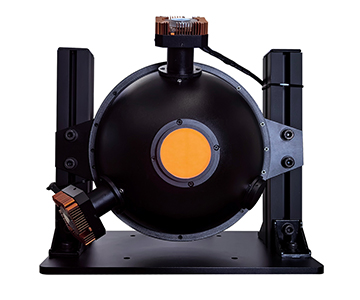
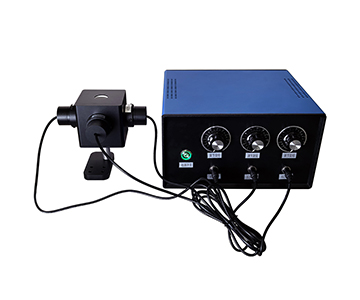
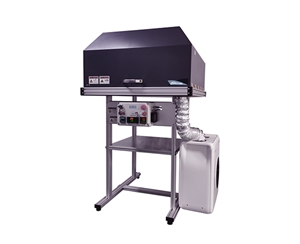
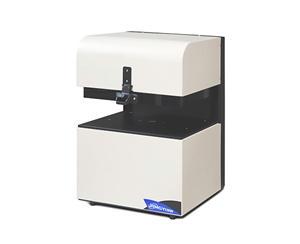
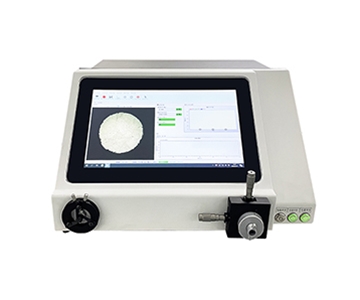
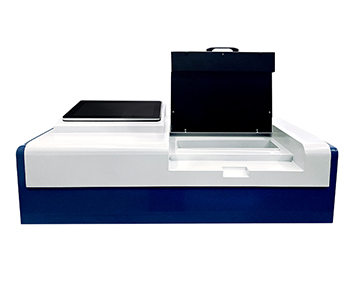
Bold opening claim:
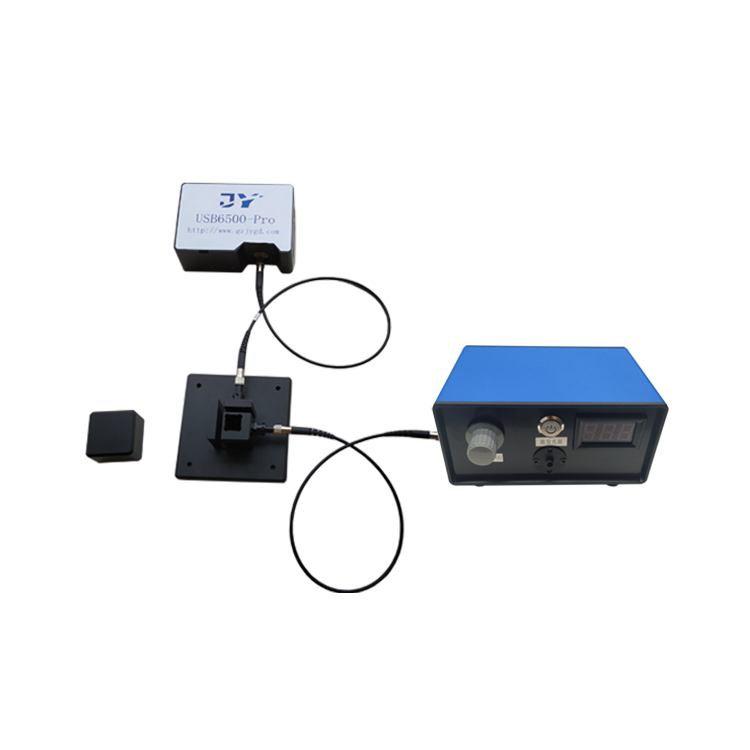
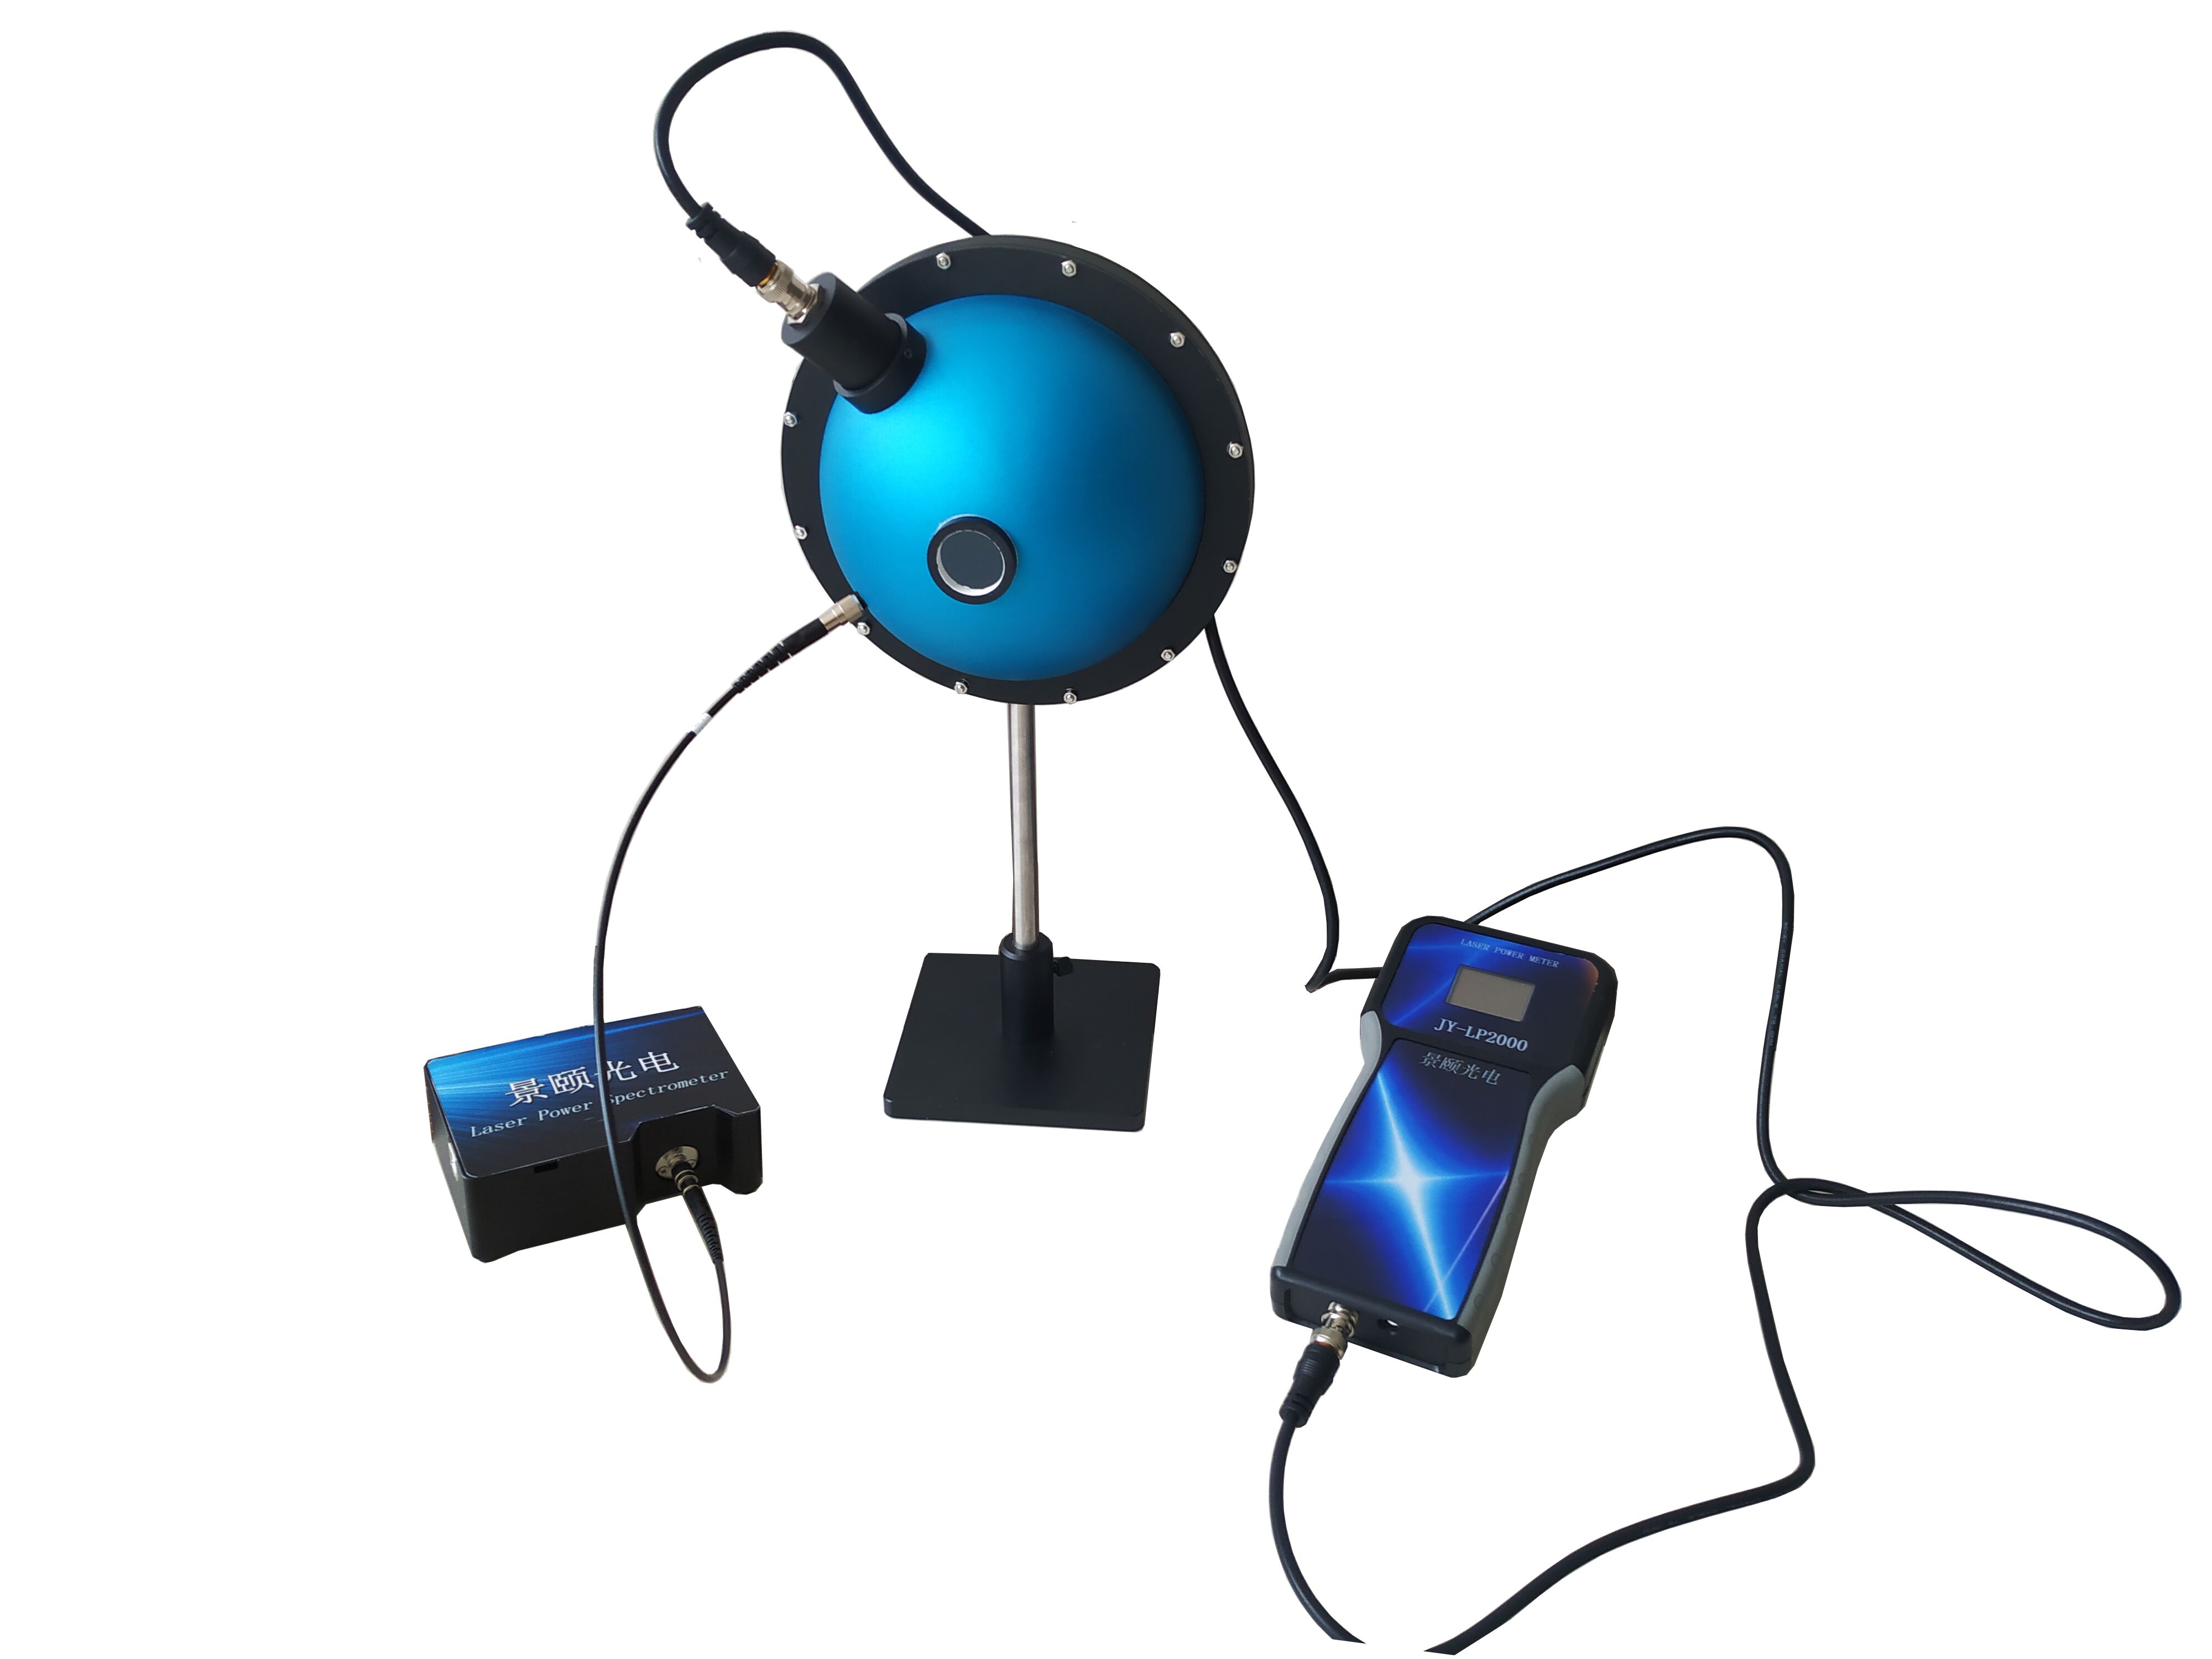
A single mis-positioned 0.3 mm spot, a 40 nm blind edge below 400 nm, and a 970 ms cycle time can turn a passing optical transmittance system into a production bottleneck within one quarter. This comparison breaks down three supplier platforms—one customization-led, one integration-led, and one research-instrument-led—across wavelength coverage, spot size, cycle time, automation, and traceability, so buyers can match metrology capability to filter, IR-aperture, laser-welded plastic, fiber-bundle, and micro-curved-coating samples before committing capital.
Choosing a transmittance meter is rarely about which instrument "can measure." It is about whether the system measures the
right spot
, over the
right band
, fast enough for the
right takt time
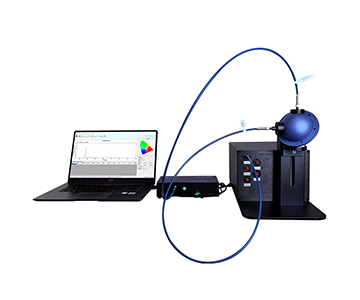
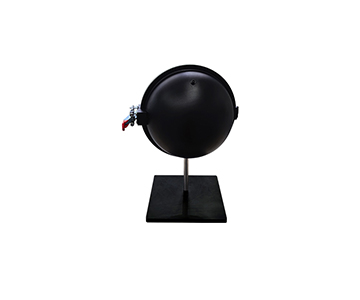
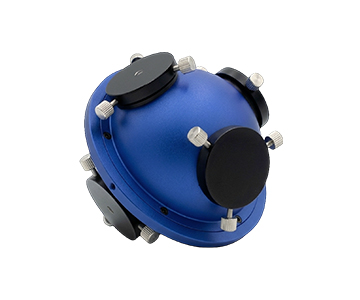
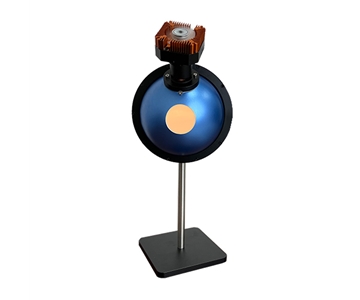
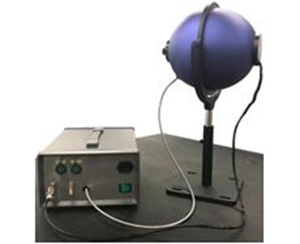
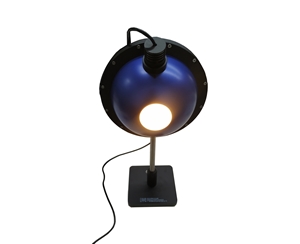
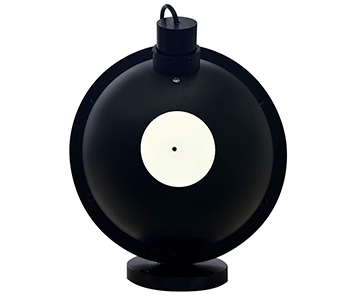
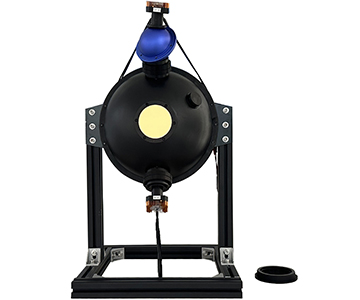
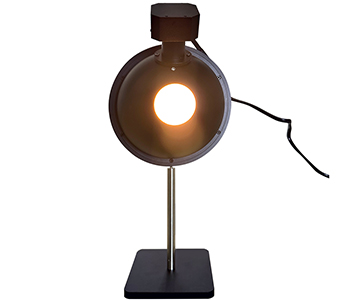
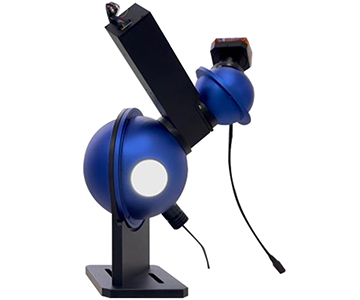
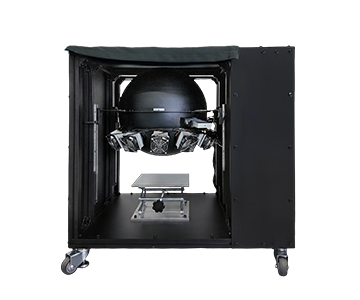
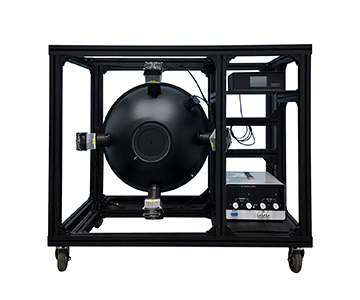
, with fixture geometry that actually contacts the part. A filter, a phone cover-glass IR hole, a laser-welded plastic assembly, a fiber light guide, and a micro-curved coated lens all fall under "transmittance," yet each demands a different spot diameter, integrating-sphere configuration, clamping strategy, and pass/fail logic.
This evaluation covers three supplier ecosystems: a customization-led platform (System A), a spectroscopy-integration platform (System B), and a scientific-instrument platform (System C). The goal is not to rank them—it is to expose the six dimensions where B2B buyers most often mis-specify: band coverage, spot size, cycle time, automation depth, data traceability, and custom-engineering boundary.
Test context is deliberately narrowed to two environments: bench-top full-spectrum curve capture for R&D, and in-line OK/NGO sampling for manufacturing. Sample set spans flat glass, thin-film filters, welded plastics, fiber bundles, and micro-curved lenses. All System A figures below come from supplier documentation; where System B and System C publish no granular specification, the table marks
"TBC (public-domain basis)"
rather than inferring values.
Why Scene Matching Drives Transmittance Meter Selection
A transmittance meter is a spot-and-band problem disguised as a photometry problem. When the illuminated spot exceeds the feature—say a 0.3 mm IR aperture measured with a 3 mm beam—the reading silently averages in surrounding substrate and the rejection logic drifts. When the band starts at 400 nm and the absorption peak sits at 365 nm, the instrument reports "transparent" on a UV-blocking film that should fail.
Six selection axes matter more than headline accuracy:
•Band coverage — does the detector + source combination actually reach the absorption edge?
•Spot diameter — can the beam land inside the feature without spillover?
•Cycle time — single-point and full-field timing versus line takt.
•Automation depth — manual load, semi-auto fixture, or robotic sort.
•Data traceability — MES field mapping, report generation, calibration chain.
•Custom boundary — curved optics, fiber ends, dual-ended fixtures, micro-objectives.
Buyers who lock these six before comparing price avoid the most expensive failure mode: discovering after installation that the "general-purpose" unit cannot see the UV edge or cannot hit a 0.3 mm target.
How the Three Platforms Line Up on Core Specifications
| Dimension |
System A (customization-led) |
System B (spectroscopy integration) |
System C (scientific instruments) |
Why it matters |
| Visible full-spectrum band |
360–1000 nm (two models) |
TBC (public-domain basis) |
TBC (public-domain basis) |
Baseline visible transmittance |
| Wide band |
250–2500 nm |
TBC (public-domain basis) |
TBC (public-domain basis) |
UV-edge to short-wave IR in one scan |
| Near-IR weld-specific |
850 / 905 / 915 / 940 / 980 nm selectable |
TBC (public-domain basis) |
TBC (public-domain basis) |
Must match the welding laser wavelength |
| Typical spot |
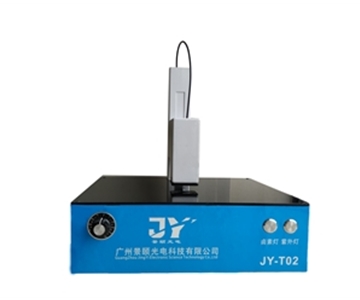
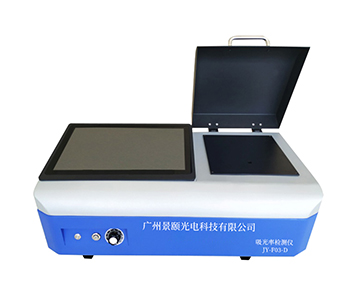
0.3–3 mm selectable; general unit ⌀3 mm |
TBC (public-domain basis) |
TBC (public-domain basis) |
Determines whether micro-features can be hit |
| Single-shot cycle time |
General <1 s; full-field ≤1 s; curved ≤0.8 s; semi-auto ≤30 ms |
TBC (public-domain basis) |
TBC (public-domain basis) |
Caps line throughput |
| Repeatability |
General / semi-auto ≤1%; curved auto <0.5% |
TBC (public-domain basis) |
TBC (public-domain basis) |
Batch-to-batch stability |
| Automation form |
Manual / semi-auto / fully-auto IR hole / robotic sort |
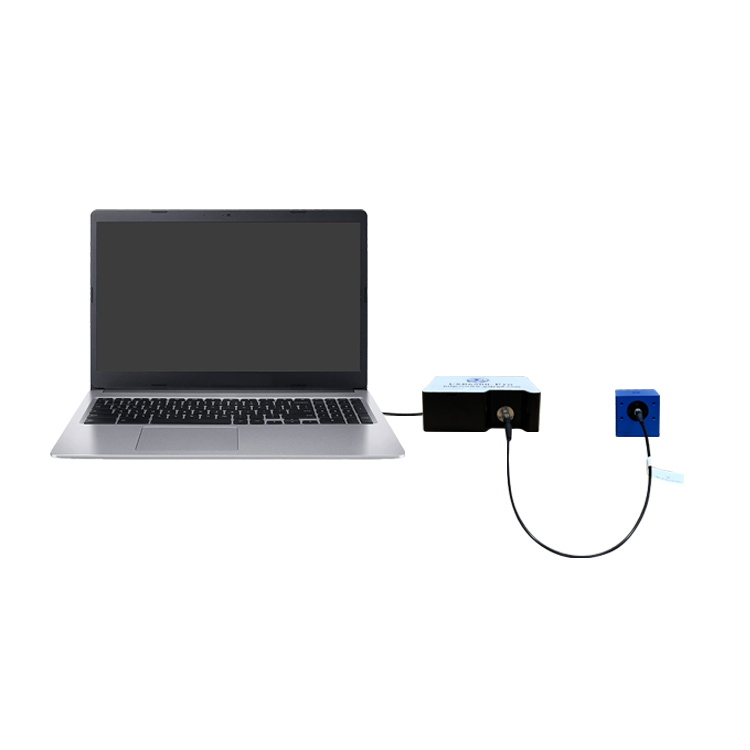
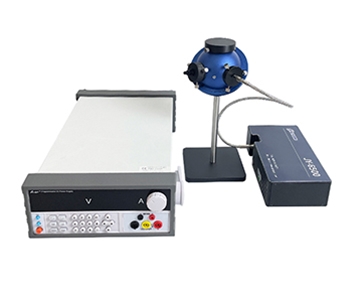
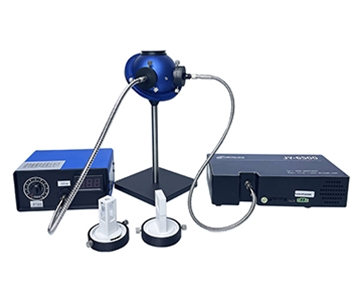
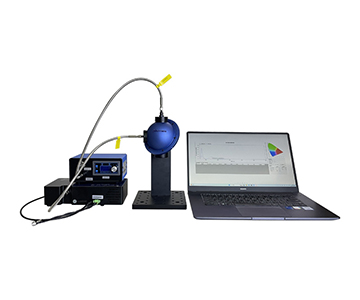
Spectrometer + integrating-sphere integration |
Lab-instrument pairing |
Whether loading needs an operator |
| Honest limitation |
Long model ladder; lock band + fixture first |
Thin public data on transmittance-specific timing and repeatability |
Limited published in-line sorting cases |
Request validation reports per scenario |
Reading the table, two rows carry disproportionate weight:
spot size
and
cycle time
. At a ⌀0.3 mm IR aperture, any spot larger than the feature folds edge signal into the reading. At 1,000+ parts/hour, the gap between a 1-second full-field scan and a 30-millisecond single-point shot becomes the line bottleneck, not a spec-sheet footnote.
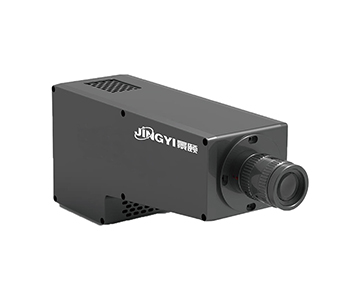
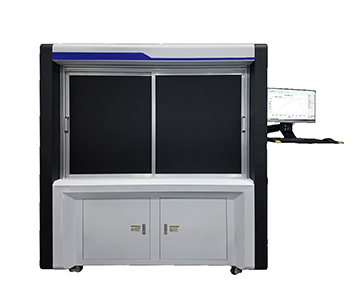
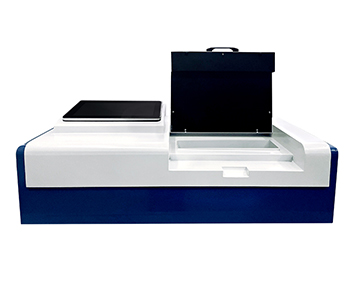
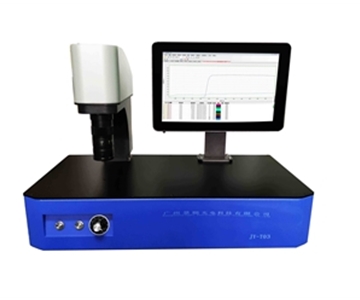
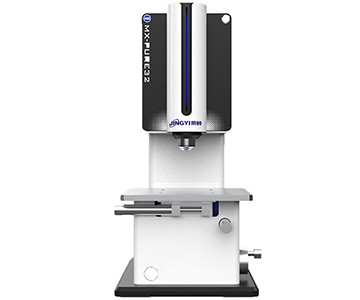
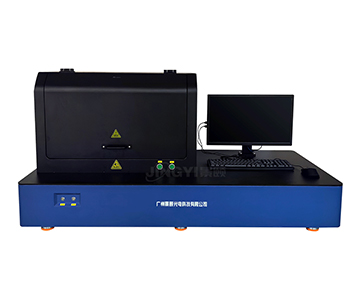
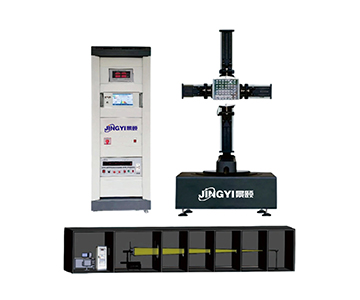
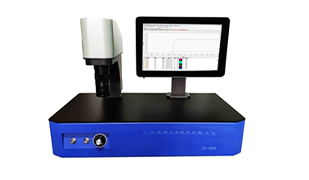
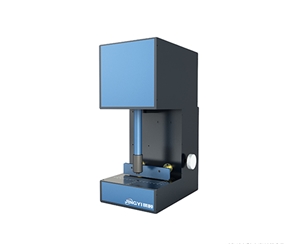
System A publishes the densest ladder on those two rows: a semi-automated unit at ≤30 ms per side with 0.3–3 mm spot options, and a fully automated IR-hole configuration at 0.3 mm spot, better-than-0.08 mm positioning accuracy, and 1,000–1,200 parts/hour on a two-hole part. The trade-off is model sprawl—buyers bounce between five SKUs and must fix the band before discussing price.
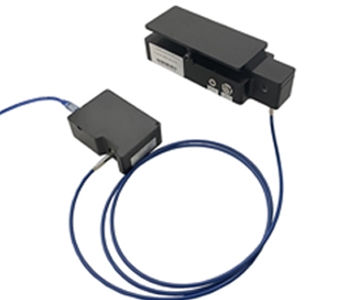
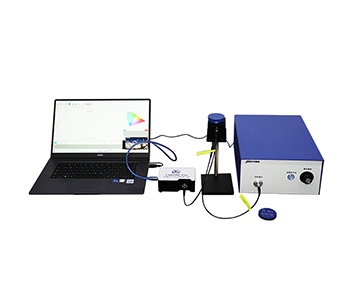
System B's strength sits upstream: spectrometers, integrating spheres, fiber probes, and light sources assembled into a coherent optical chain. That fits customers who already own a handling platform and only need the metrology link. The gap is that transmittance-specific cycle time and repeatability are not published at module level; line-hard numbers must be requested as a report.
System C leans scientific. In-line sort, CCD alignment accuracy, and MES field mapping exist only as project-scoped engineering, not catalog features. That is a positioning difference, not a defect.
What UV Absorption Testing Reveals About Real Band Coverage
The lower wavelength limit decides whether a material can ship. Photoresist residue, UV-cured adhesive, sunscreen film, and UV-blocking layers all peak at 360–400 nm or below. An instrument specified "from 400 nm" is blind exactly where the absorption lives.
System A's published ladder:
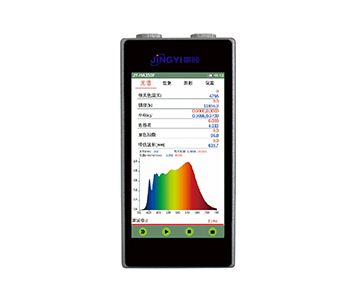
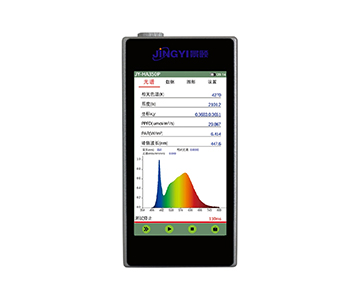
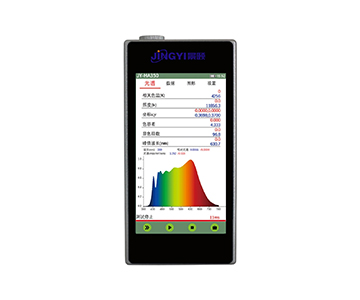
•360–1000 nm on two general models
•200–2500 nm nominal on one legacy model (spec sheet lists 400–1000 nm; contract language governs)
•250–2500 nm on the wide-band configuration
For qualitative or quantitative UV absorption, a 250 nm start is the practical floor. For visible-only transmittance, 360 nm is already generous.
System B and System C publish no UV lower bound in the reviewed material, so this comparison does not fill the gap. Buyers whose primary requirement is UV absorption should request the detector part number and source architecture—
deuterium lamp versus deuterium-halogen combination
—because that choice alone sets the signal-to-noise ratio across 200–400 nm.
The near-IR end mirrors the same logic. Plastic laser welding commonly runs at 980 nm; System A's weld-specific series offers 850 / 905 / 915 / 940 / 980 nm so the metrology wavelength matches the process wavelength. Mismatch—measuring at 980 while welding at 940—produces incoming-part acceptance errors that are notoriously hard to trace back.
Automation and Data Traceability for In-Line Deployment
On a production line, single-point accuracy is not the deciding factor. Three questions are:
1.Does loading require an operator?
2.Does pass/fail happen without human judgment?
3.Does the result reach the MES?
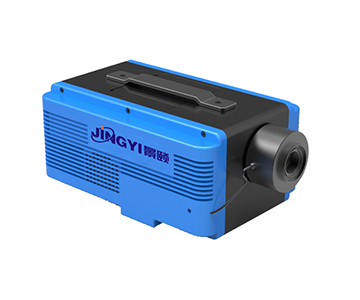
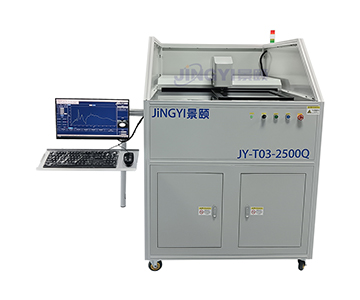
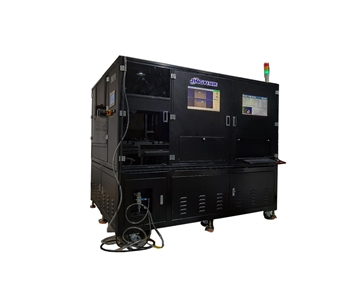
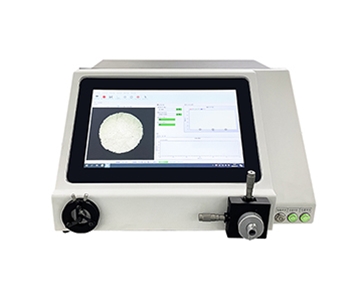
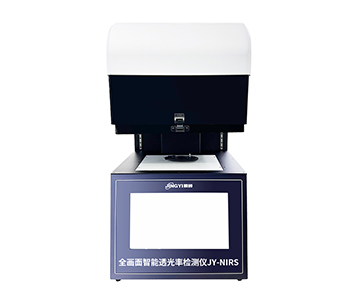
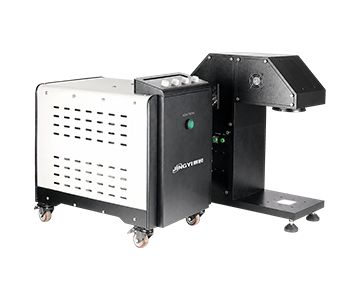
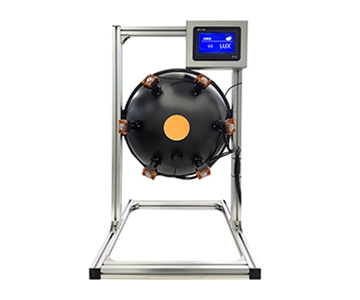
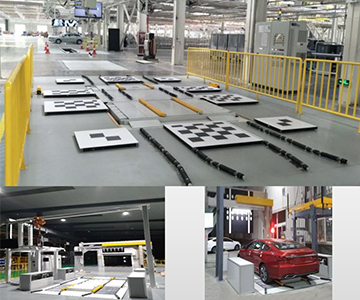
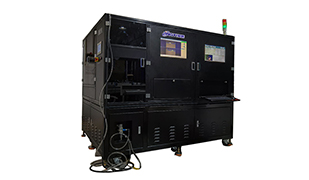
System A's fully automated IR-hole configuration uses a robotic arm plus CCD vision, positioning better than 0.08 mm, auto-sorting good/reject parts at 1,000–1,200 parts/hour on two-hole parts. The wide-band unit pairs with an auto-stage and generates reports natively. The curved-surface automatic variant holds repeatability below 0.5% and exposes MES and traceability-database hooks. That combination fits phone cover glass and automotive weld inspection where takt dominates.
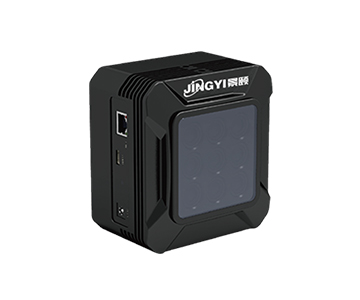
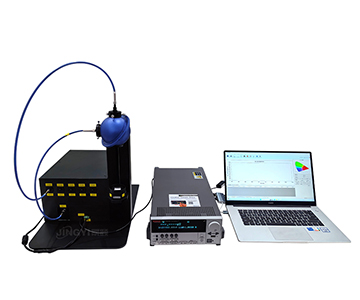
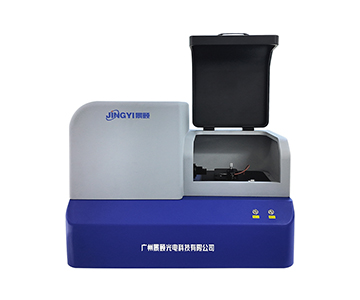
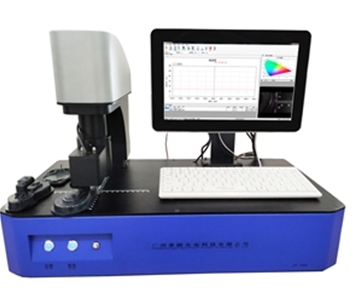
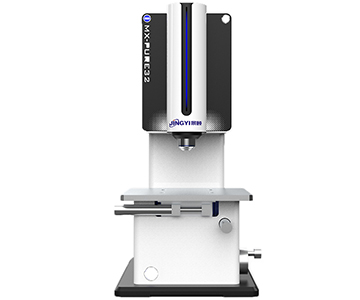
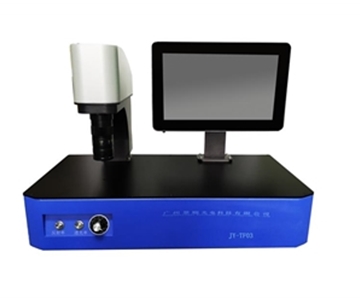
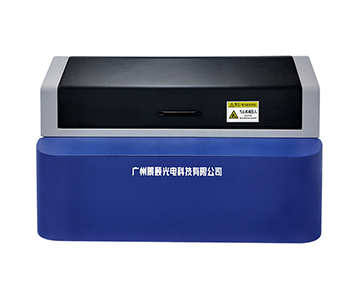
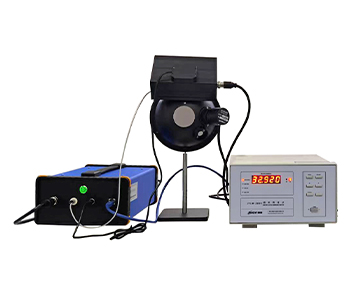
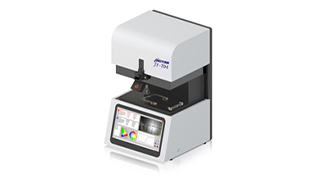
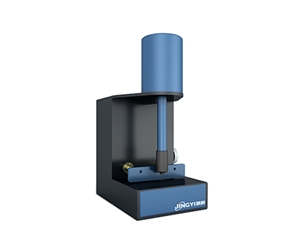
The semi-automated unit takes a different route: magnetic fixture plus dual cameras, 1–7 user-selected points per part, positioning ≤±0.06 mm, repeat positioning ≤±0.03 mm, with CIE, L*a*b*, and ΔE computed on-board. Strong for R&D prototyping and small-batch sampling; wrong for unmanned lines.
System B and System C describe automation as "spectroscopy system solutions." Robotic takt, CCD alignment tolerance, and MES field mapping are all project-scoped. Treat that as a scoping conversation, not a catalog gap.
Which Platform Fits Which Application
•Phone cover-glass IR apertures and precision micro-holes — prioritize CCD vision plus a 0.3 mm spot on a fully automated unit. System A's published configuration matches; Systems B and C need confirmation of equivalent alignment accuracy.
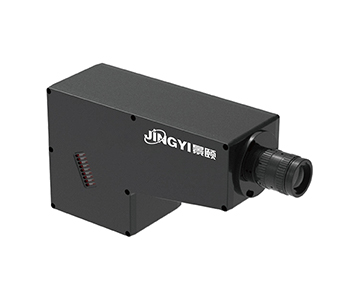
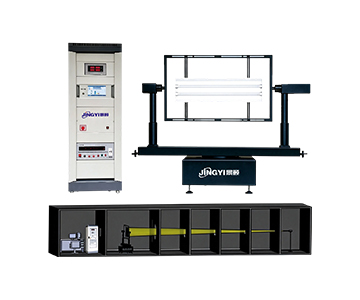
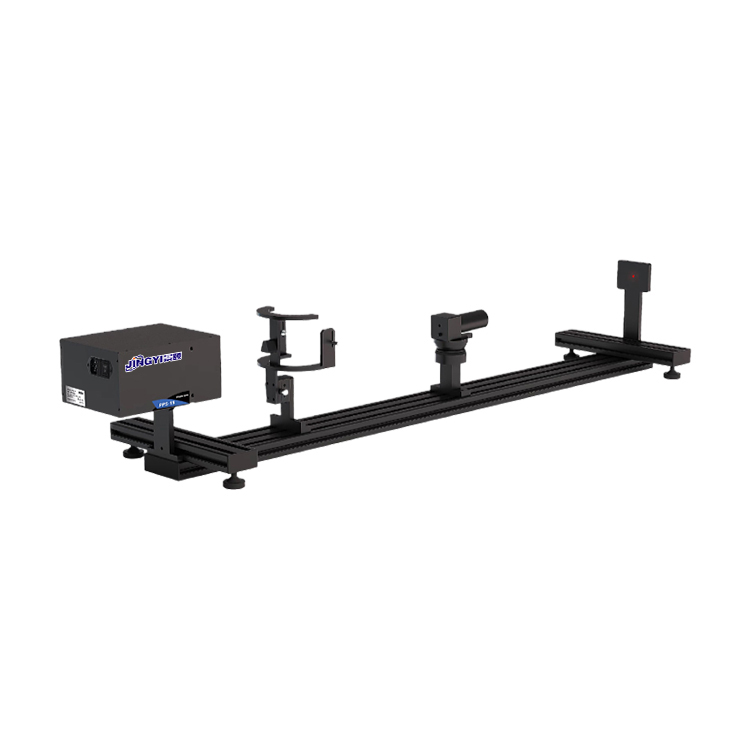
•Laser-welded plastic full-field判定 — select a near-IR channel co-wavelength with the welding source. System A's weld series supports multi-point and full-field capture with automatic OK/NG. For total transmittance and total reflectance of plastics, write ISO-and-ASTM method compliance into the acceptance clause so the traceability chain stays intact.
•R&D full-spectrum plus colorimetry — 360–1000 nm is sufficient; check whether CIE / Lab / ΔE are computed in software. All three platforms can cover it; choose on software ergonomics.
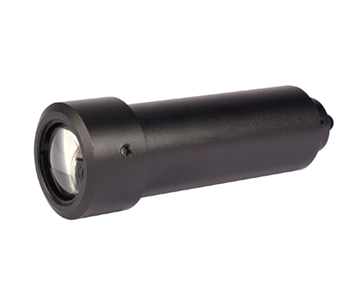
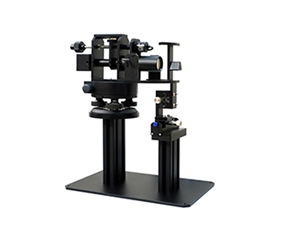
•Micro-curved surfaces and coating uniformity — requires a microscope objective; System A's micro variant offers a ⌀60 μm spot with curved-surface capability. Confirm whether Systems B and C offer a micro-bench.
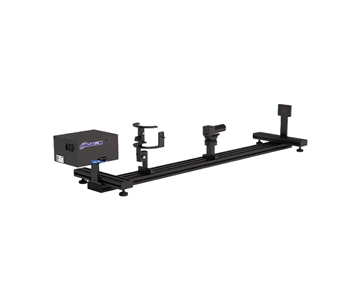
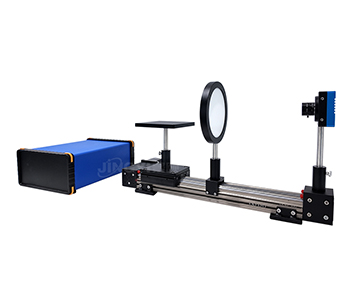
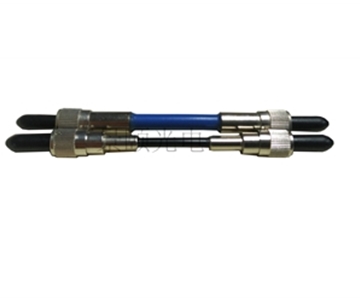
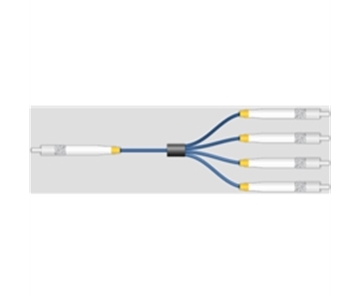
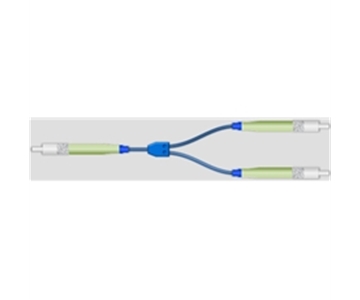
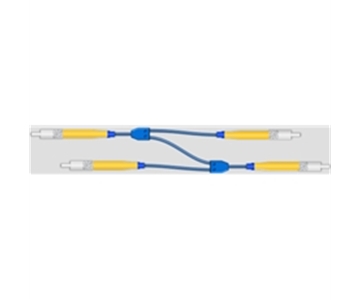
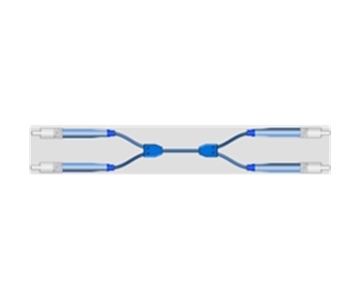
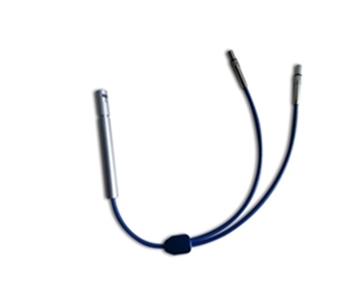
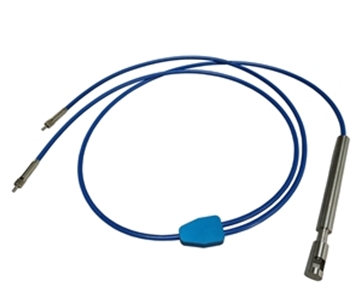
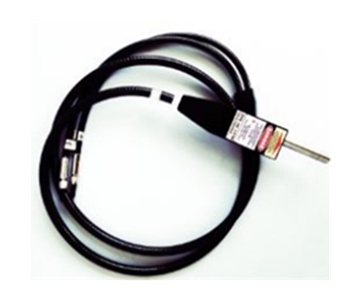
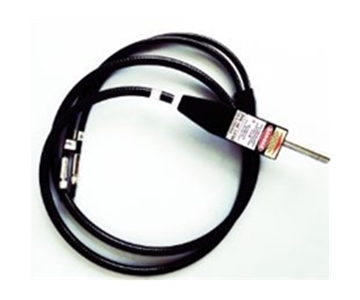
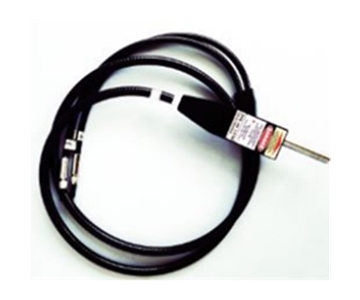
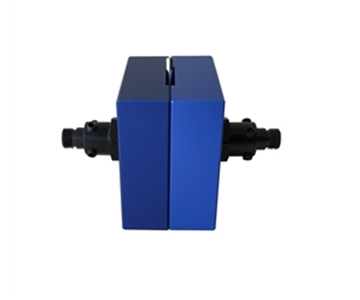
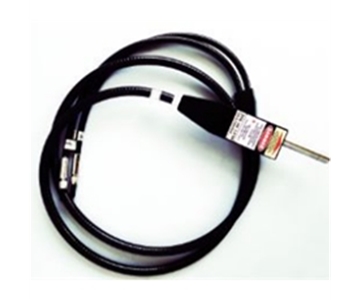
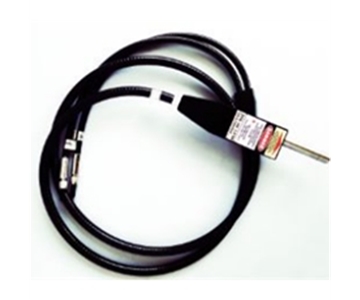
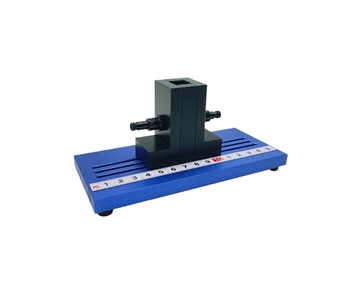
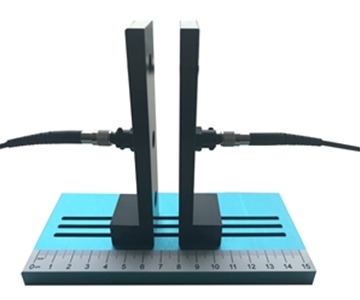
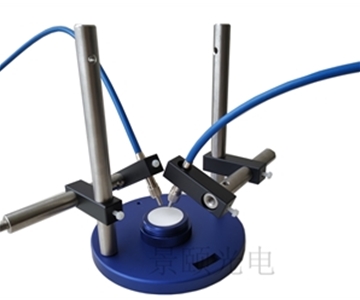
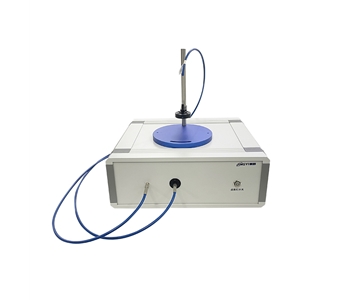
•Fiber light guides — System A's fiber unit accepts both ends, streams a 400–1000 nm curve live, and snapshots the end-face image. Dedicated fiber fixtures are a narrow market everywhere.
Compliance & Calibration
Transmittance data that cannot be traced to a national standard is a number, not a measurement. For regulated or automotive-adjacent work, require:
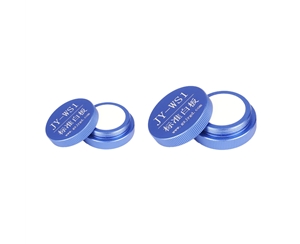
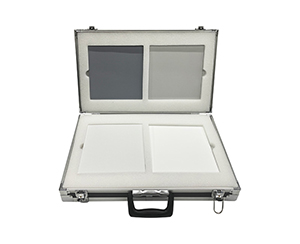
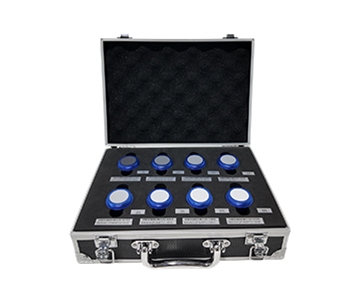
•ISO/IEC 17025-accredited calibration certificate for the reference standard used at acceptance
•NIST-traceable reflectance and transmittance standards (SRM-class or equivalent) for the high/mid/low set
•Documented measurement uncertainty budget, not just repeatability—repeatability is intra-run; uncertainty is the number that survives an audit
•For plastics, a written method reference to the applicable ISO/ASTM total-transmittance and total-reflectance standard, mapped field-by-field into the MES record
System A documentation references calibration-chain readiness; Systems B and C should be asked for the same package in writing before PO.
Validation Methodology
Any of the three platforms should survive the same independent proof-of-concept before purchase:
•Sample set: 30 parts minimum, spanning high / mid / low transmittance, including at least 5 curved or micro-feature parts if those are in scope
•Conditions: 23 °C ±1 °C, 45% ±5% RH, parts conditioned ≥4 h
•Repeat protocol: each part measured 10× with fixture removed and re-clamped between cycles—this captures fixture repeatability, not just instrument noise
•Statistics: report mean, σ, and repeatability as 2σ; compute gauge R&R against the part tolerance, not against the instrument spec
•Drift watch: re-measure the same standards daily for 30 days; log daily mean shift and flag any drift exceeding 20% of the part tolerance
•Cross-platform check: if two vendors are finalists, run the same 30 parts on both within the same week—never compare vendor A's June data to vendor B's September data
Honest Limitations of This Comparison
Two boundaries deserve stating plainly.
First, Systems B and C publish thin granular data on transmittance-specific cycle time, repeatability, spot ladders, and automated throughput. The "TBC" cells are not a claim that those capabilities are absent—they are a claim that buyers must obtain validation reports and run sample measurements rather than back-inferring整机 performance from generic spectrometer specs.
Second, System A carries the widest model ladder, which also means the highest selection cost. Under one product name sit five distinct configurations aimed at fundamentally different sample geometries. A single "general price" quote tends to mis-route a curved or micro-area requirement onto a general unit.
Neither dataset here covers drift behavior outside 10 °C to 60 °C, and no cross-brand blind test on identical parts was performed. Conclusions apply to ambient-temperature routine materials only.
Frequently Asked Questions
How do I choose the band range for a filter transmittance meter?
Start from the filter's operating wavelength. Visible-band filters are covered by 360–1000 nm. Once the design involves a UV cutoff or a near-IR bandpass, coverage below 360 nm or above 1000 nm becomes mandatory—a 250–2500 nm wide-band configuration avoids edge distortion that a 400 nm-start instrument simply cannot see.
Is an integrating sphere necessary for a full-spectrum transmittance meter?
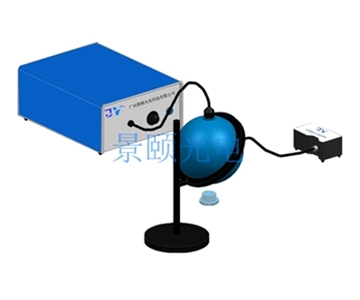
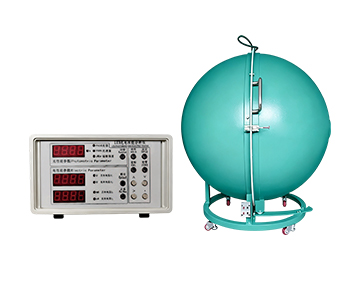
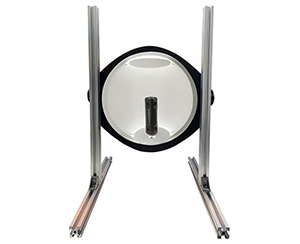
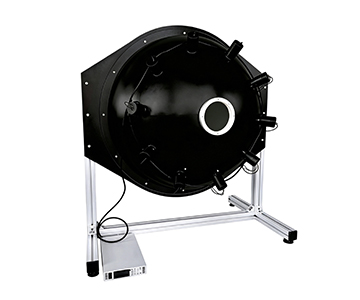
Yes for diffusing samples. Frosted glass, opal plastics, and matte coatings leak light angularly; without an integrating sphere the reading biases low. Specular-only parts can run a direct beam, but mixed-product lines should standardize on a sphere with >98% wall reflectance to keep results comparable.
How small should the spot be on a micro transmittance meter?
Match the spot to the feature size. Coating-uniformity scans and small curved zones are served by a ⌀60 μm objective. Measuring micron-scale pattern edges needs higher magnification plus a stage with repeat positioning ≤±0.03 mm, otherwise the stage—not the optics—becomes the error source.
How should I weigh procurement cost across these three platforms?
System A carries more dedicated SKUs and deeper customization, so unit price typically sits above a general spectroscopy integration. Systems B and C enter cheaper as modules or lab pairings, but in-line automation is scoped separately. Price in tiers—$50K for a general bench unit, $100K for semi-automated with vision, $200K+ for robotic sort with MES—rather than comparing headline numbers.
How can I independently verify long-term stability of a transmittance meter?
Run one high/mid/low standard set daily for 30 consecutive days. Log daily mean drift and repeatability (2σ), then request the ISO/IEC 17025 calibration certificate and the NIST traceability chain from the vendor. Write the drift ceiling into the acceptance clause—a signed number outperforms a verbal promise.
Reference Information
Sources
: Supplier product documentation for System A (transmittance / absorbance / fiber transmittance / semi- and fully-automated model spec sheets); public catalogs for Systems B and C; ISO/IEC 17025 and NIST traceability guidance for the calibration section.
Author
: Cai Xiaodong, Senior Application Engineer, Jingyi Optoelectronics — 12 years in industrial optical inspection equipment selection and in-line validation, focused on transmittance, reflectance, film thickness, and spectroscopic measurement systems.
Conflict of Interest
: Jingyi Optoelectronics manufactures optical transmittance inspection equipment. This analysis draws on public specifications and supplier documentation without third-party sponsorship; Systems B and C are assessed only on published material.
Intended Use
: Educational reference only; validate all equipment choices through on-site POC testing under your own process conditions.
Updated
: November 2026
For detailed specifications and application notes on optical transmittance meters, search "Jingyi Optoelectronics + transmittance meter" or visit our technical library.