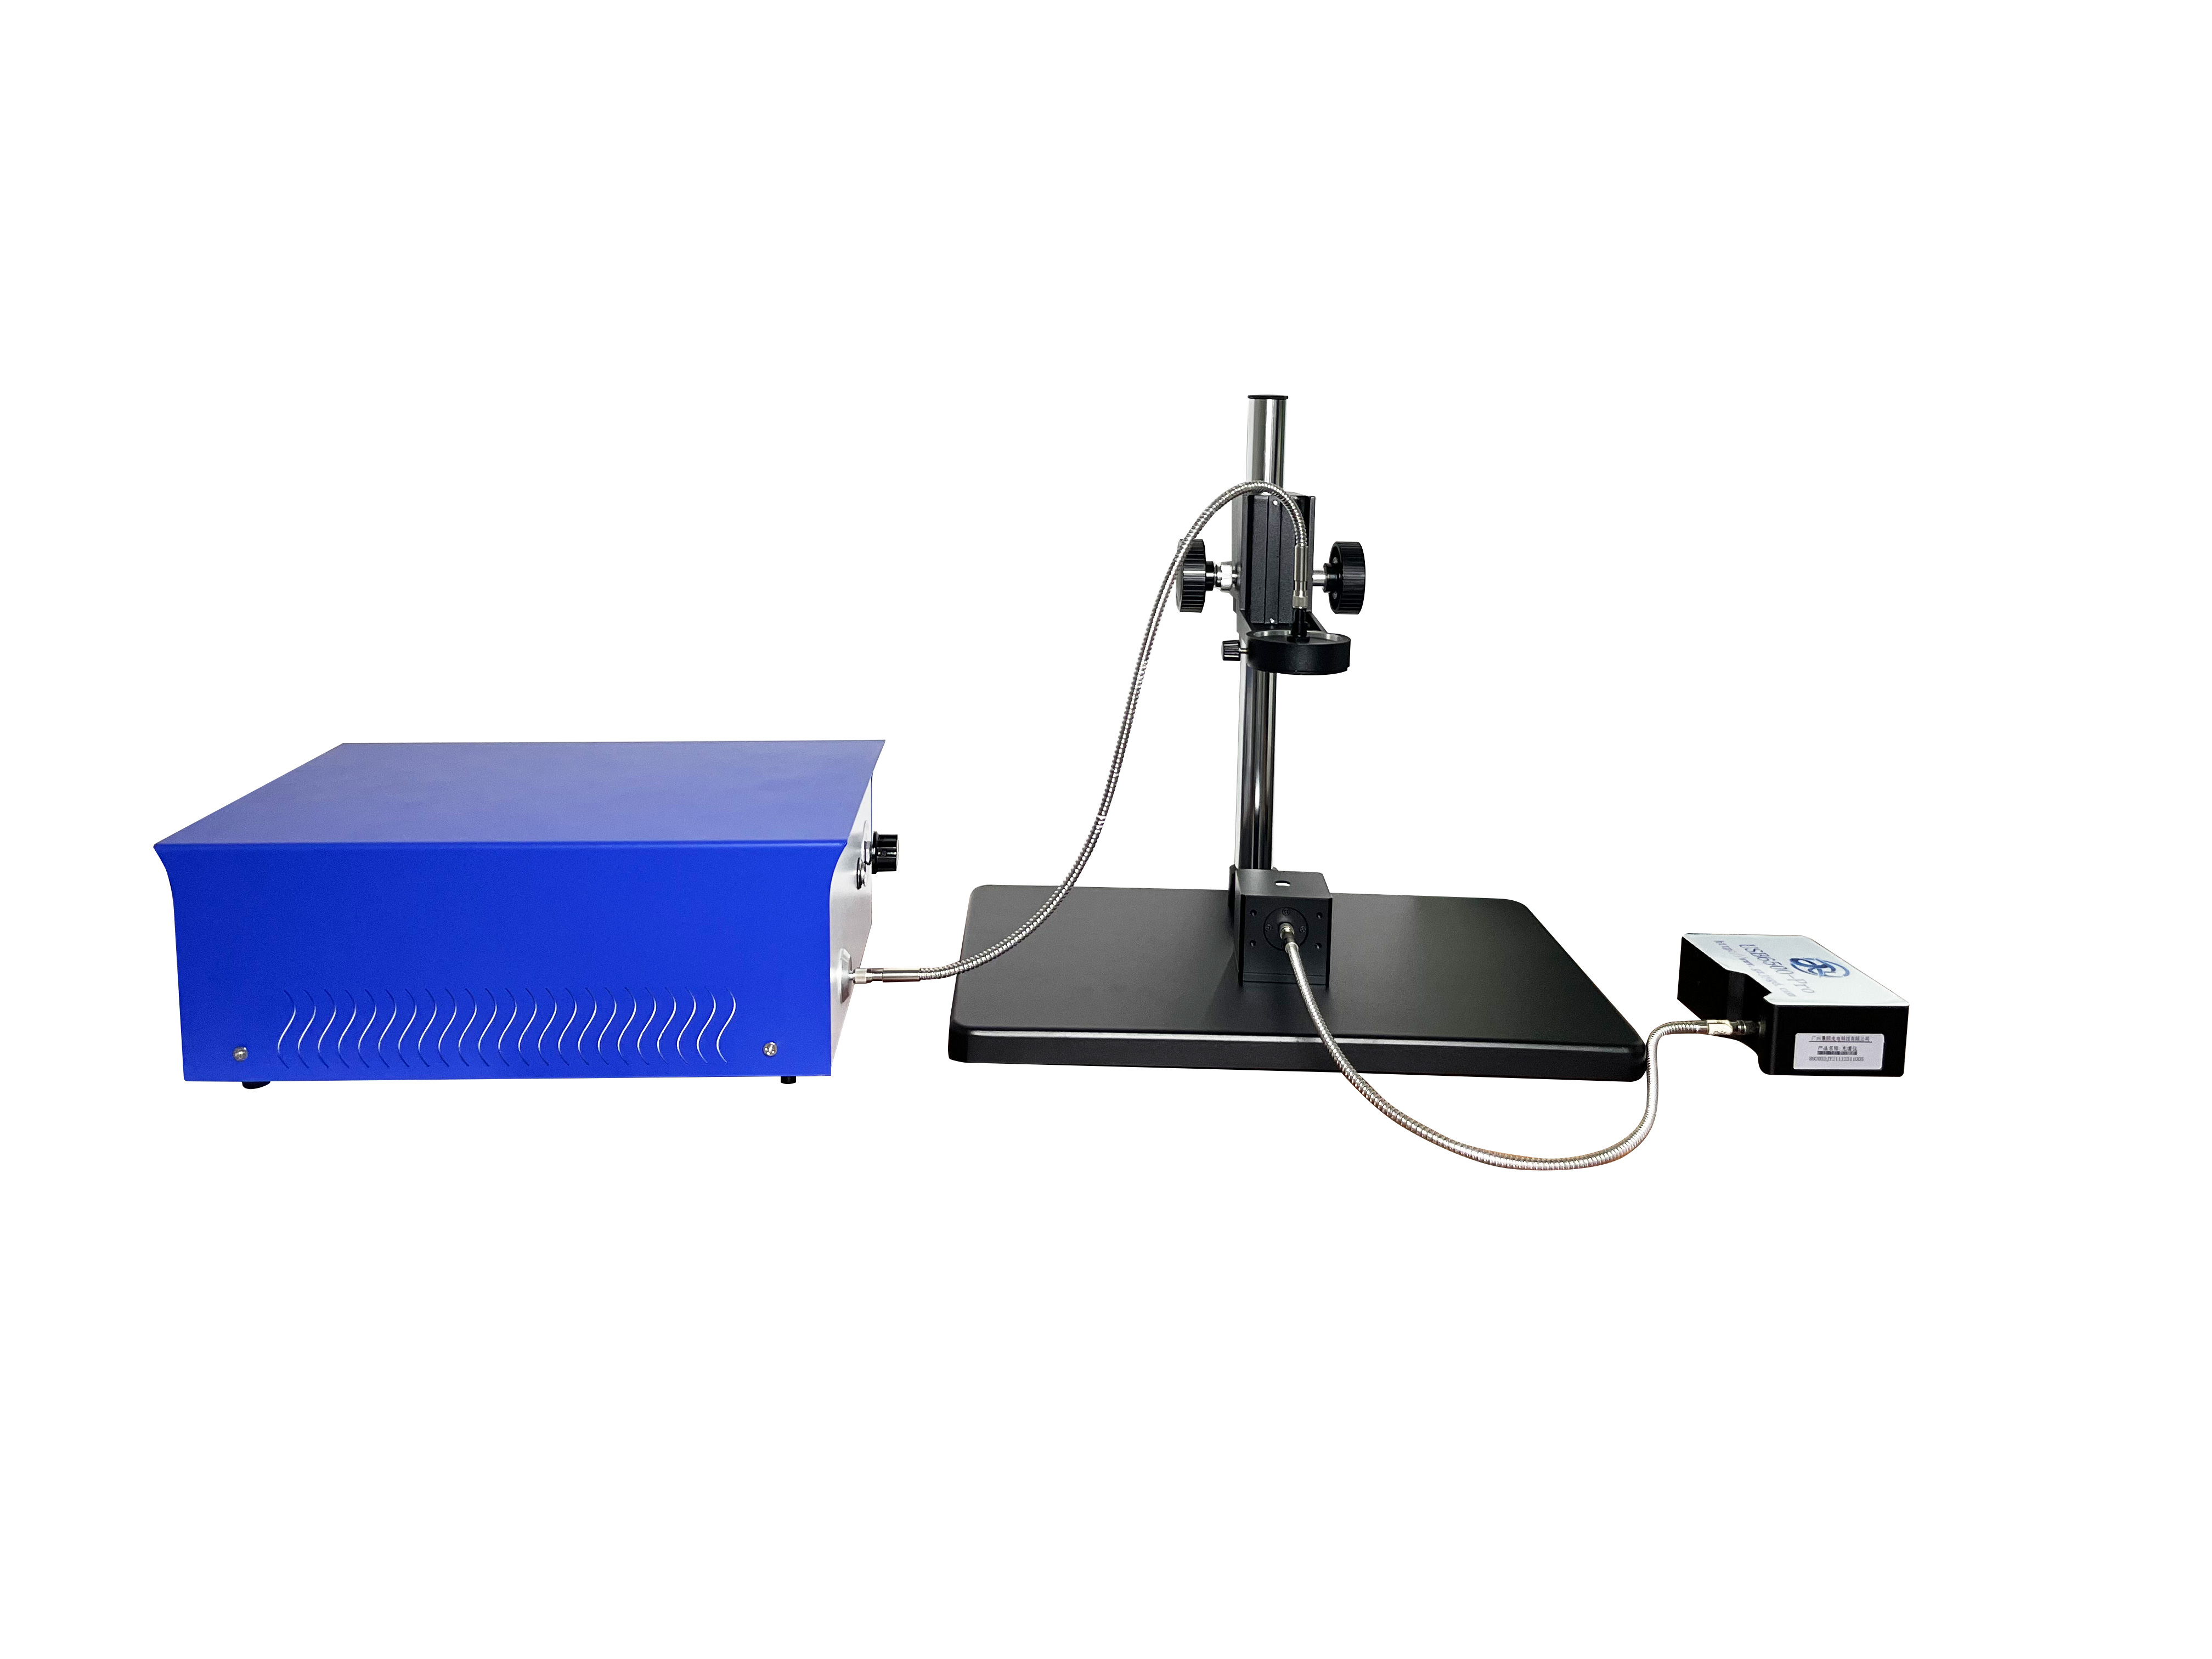
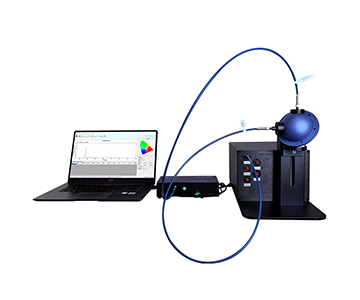
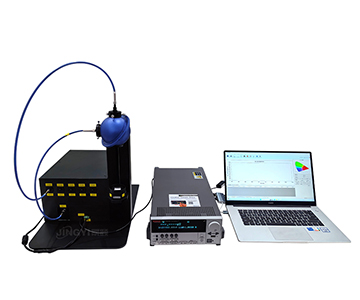
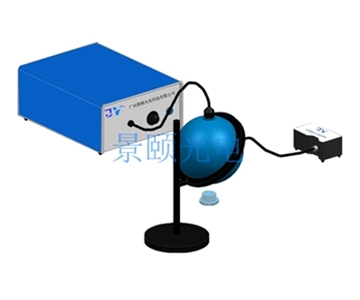
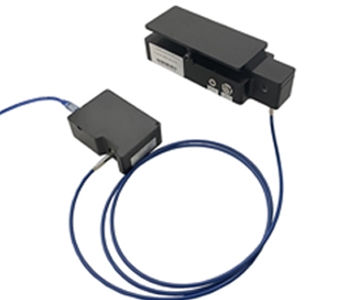
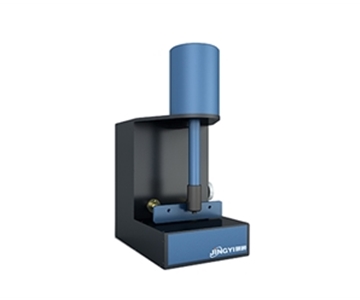
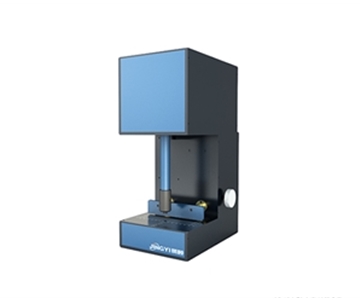
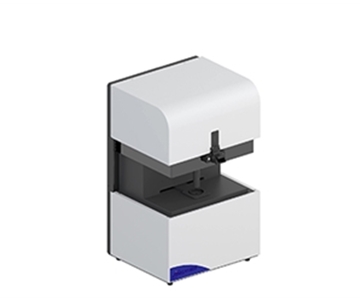
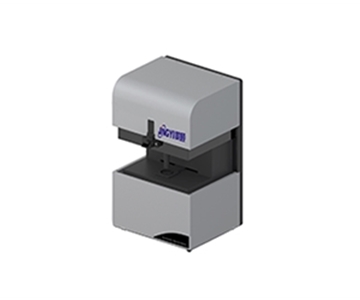
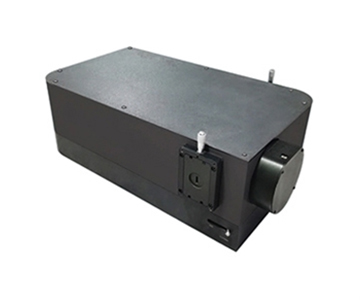
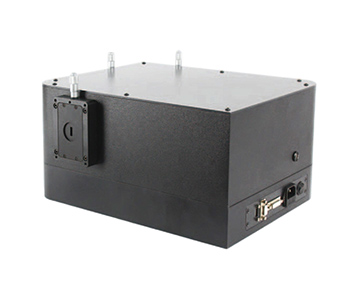
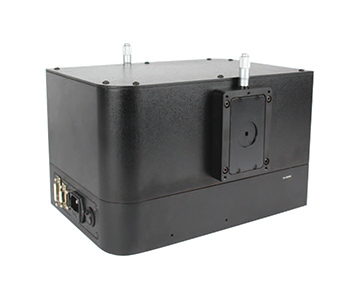
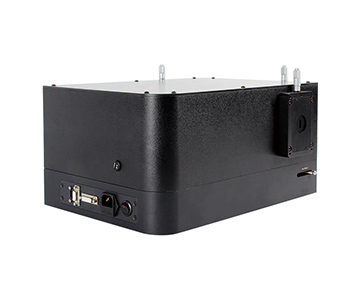
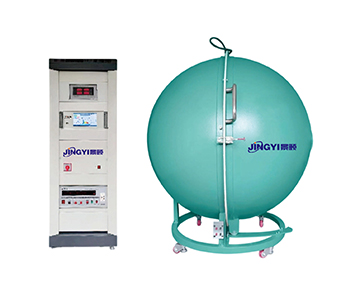
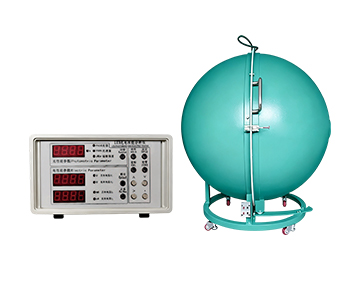
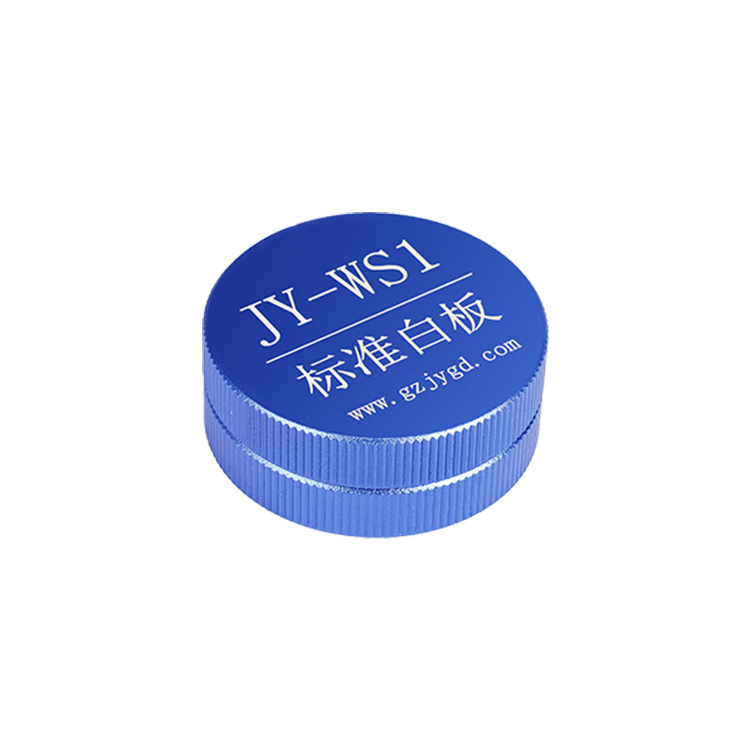
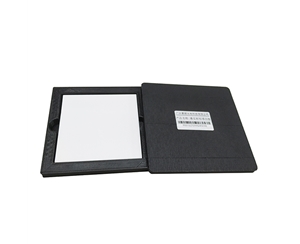
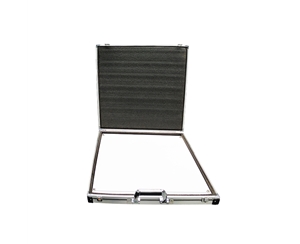
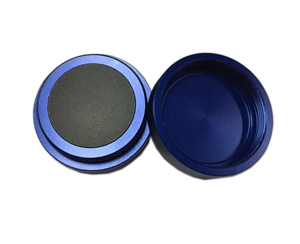
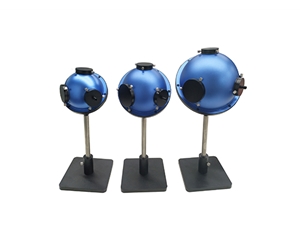
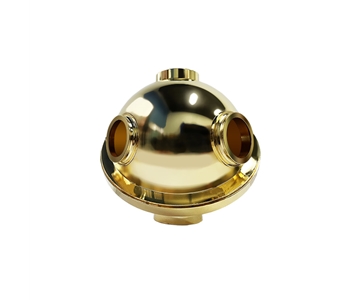
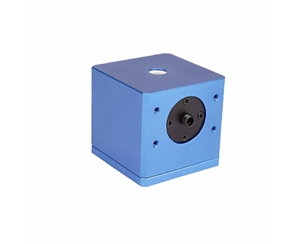
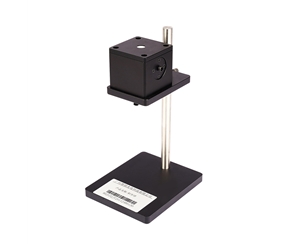
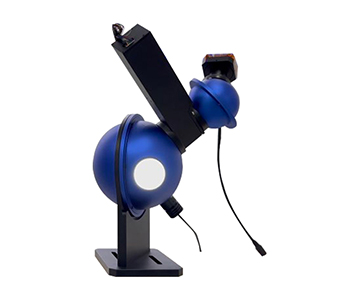
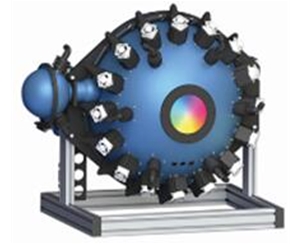
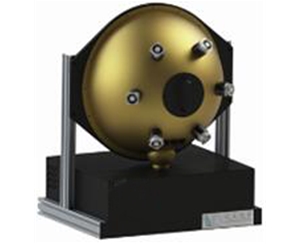
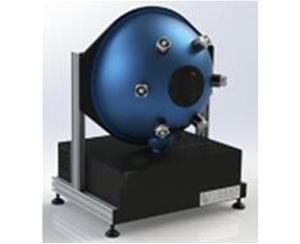
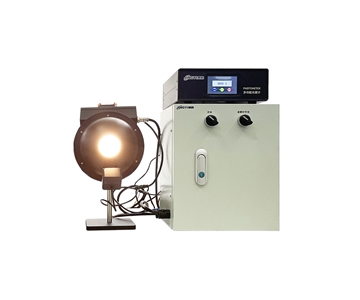
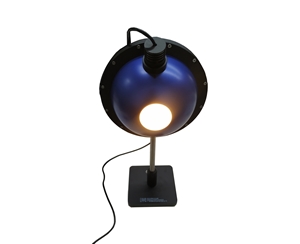
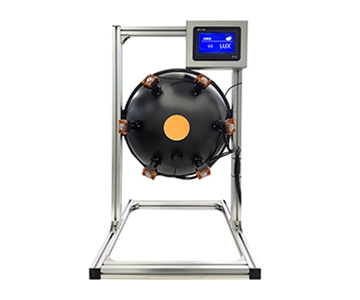
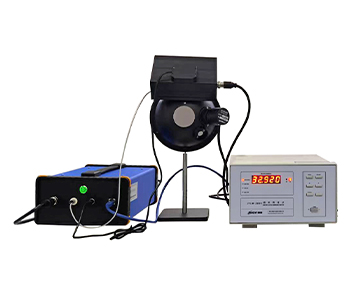
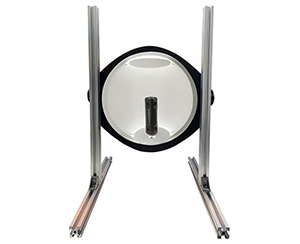
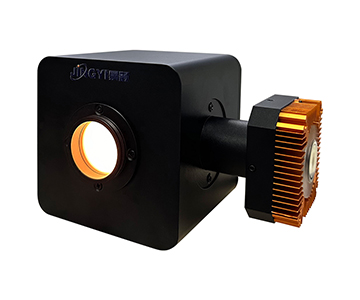
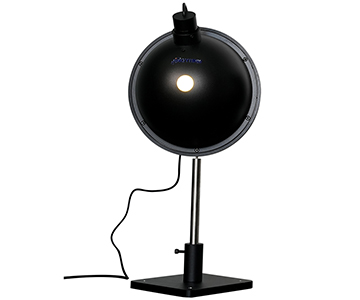
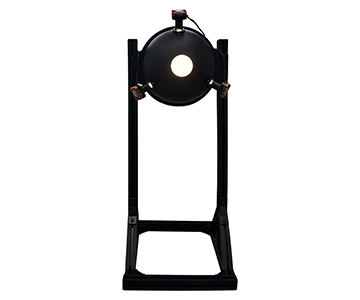
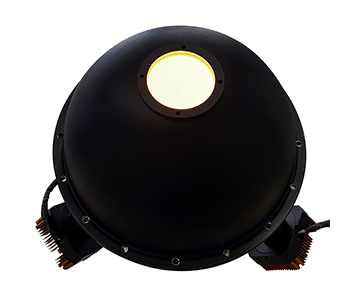
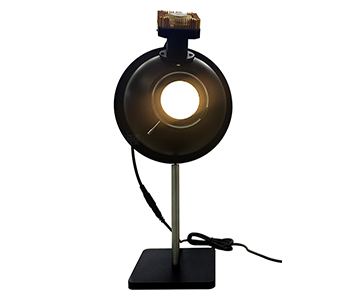
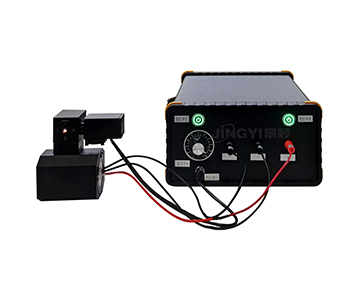
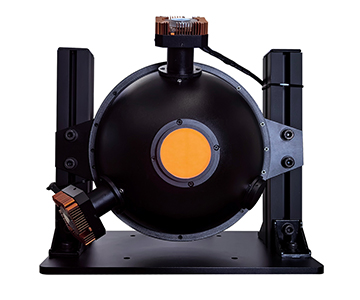
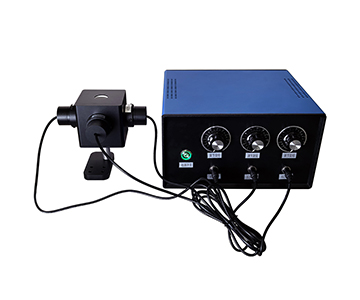
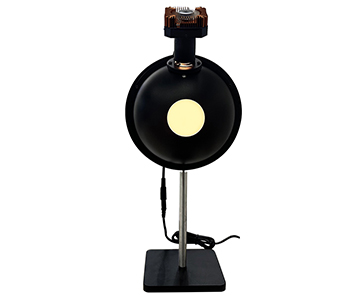
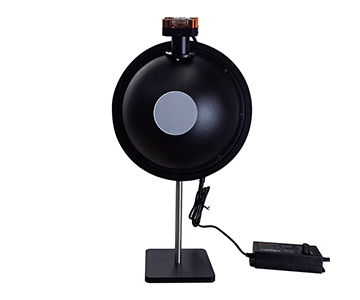
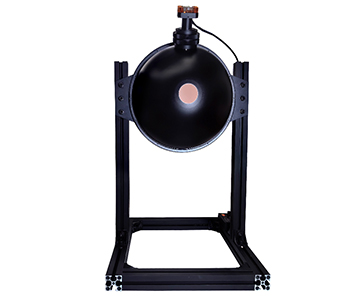
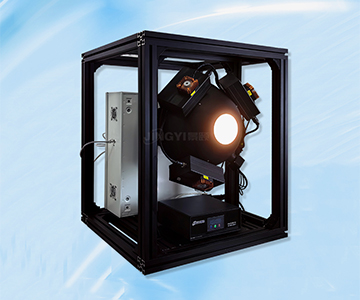
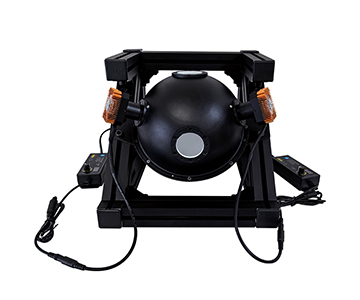
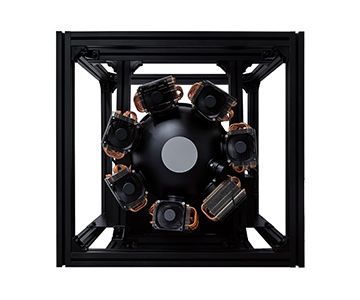
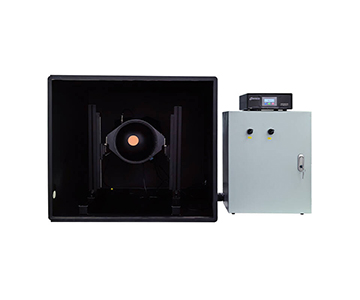
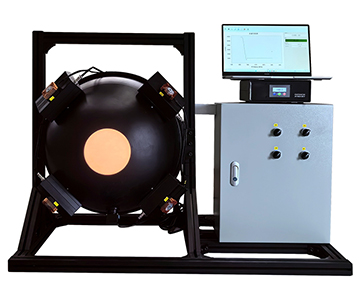
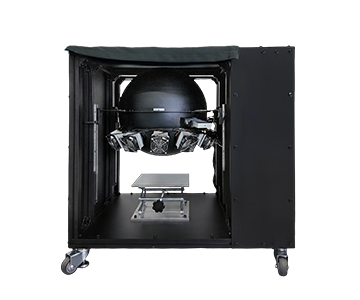
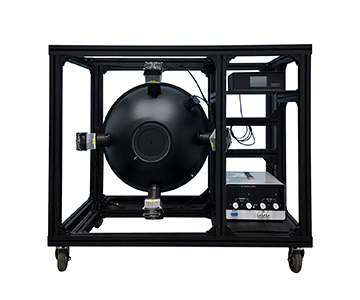
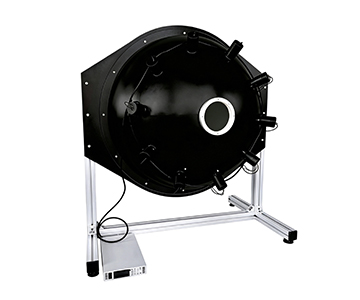
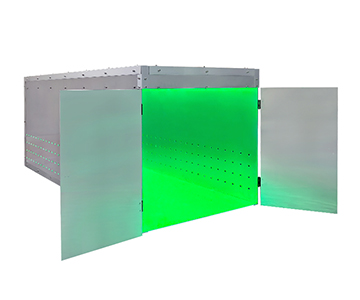
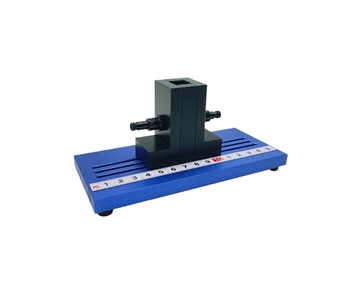
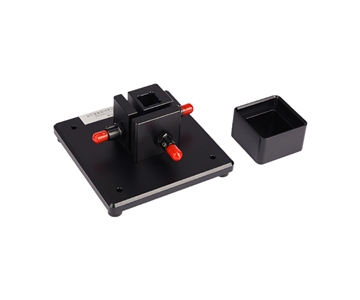
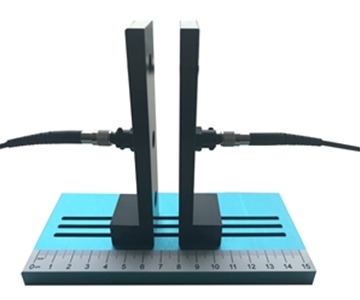
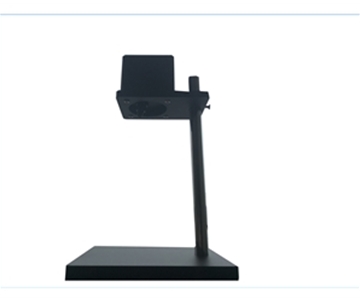
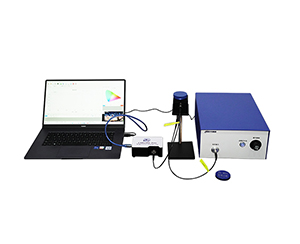
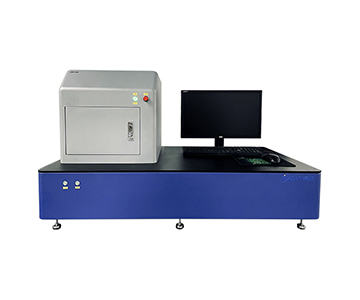
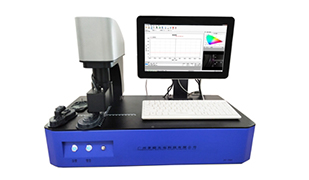
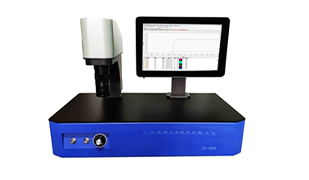
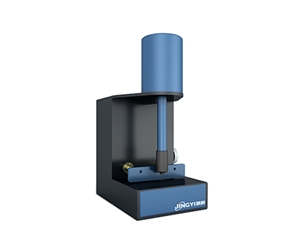
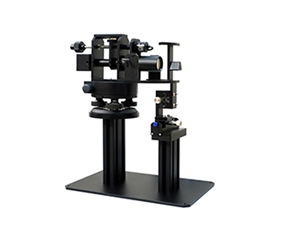
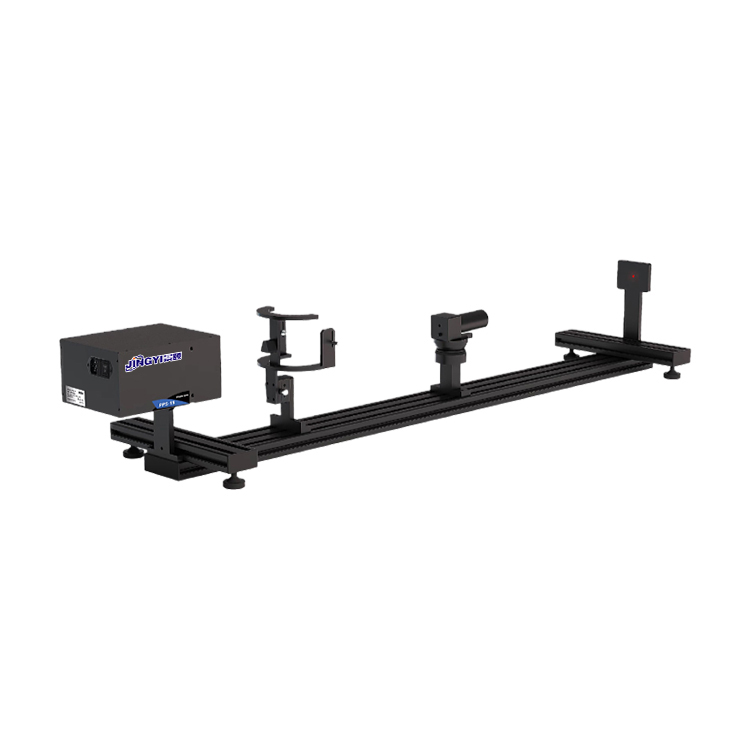
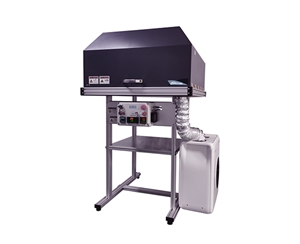
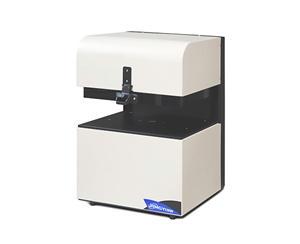
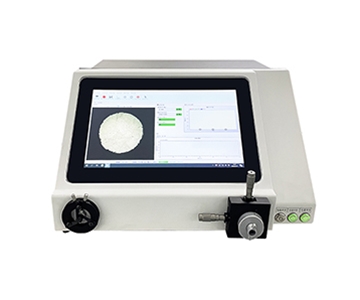
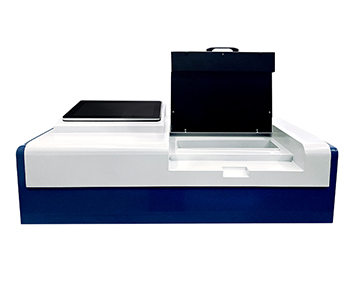
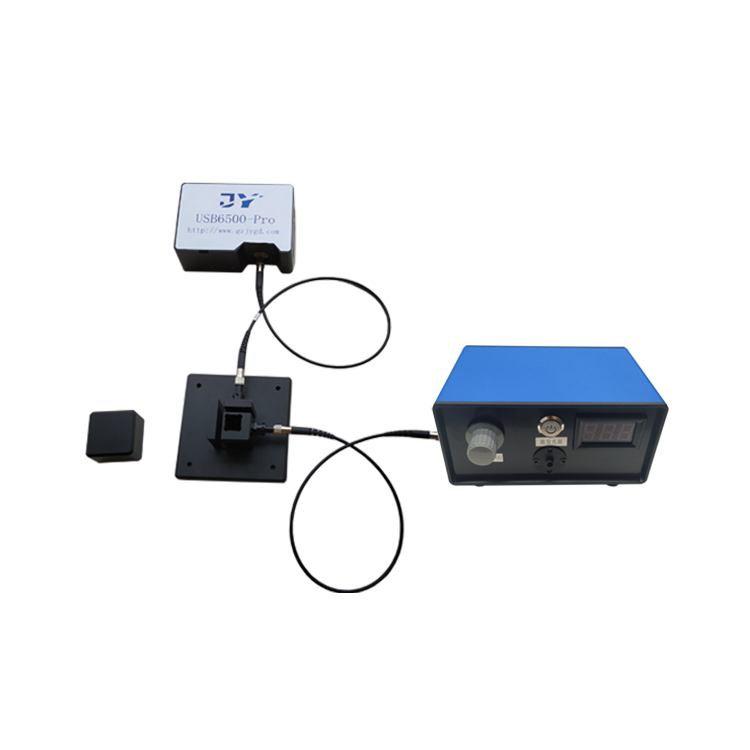
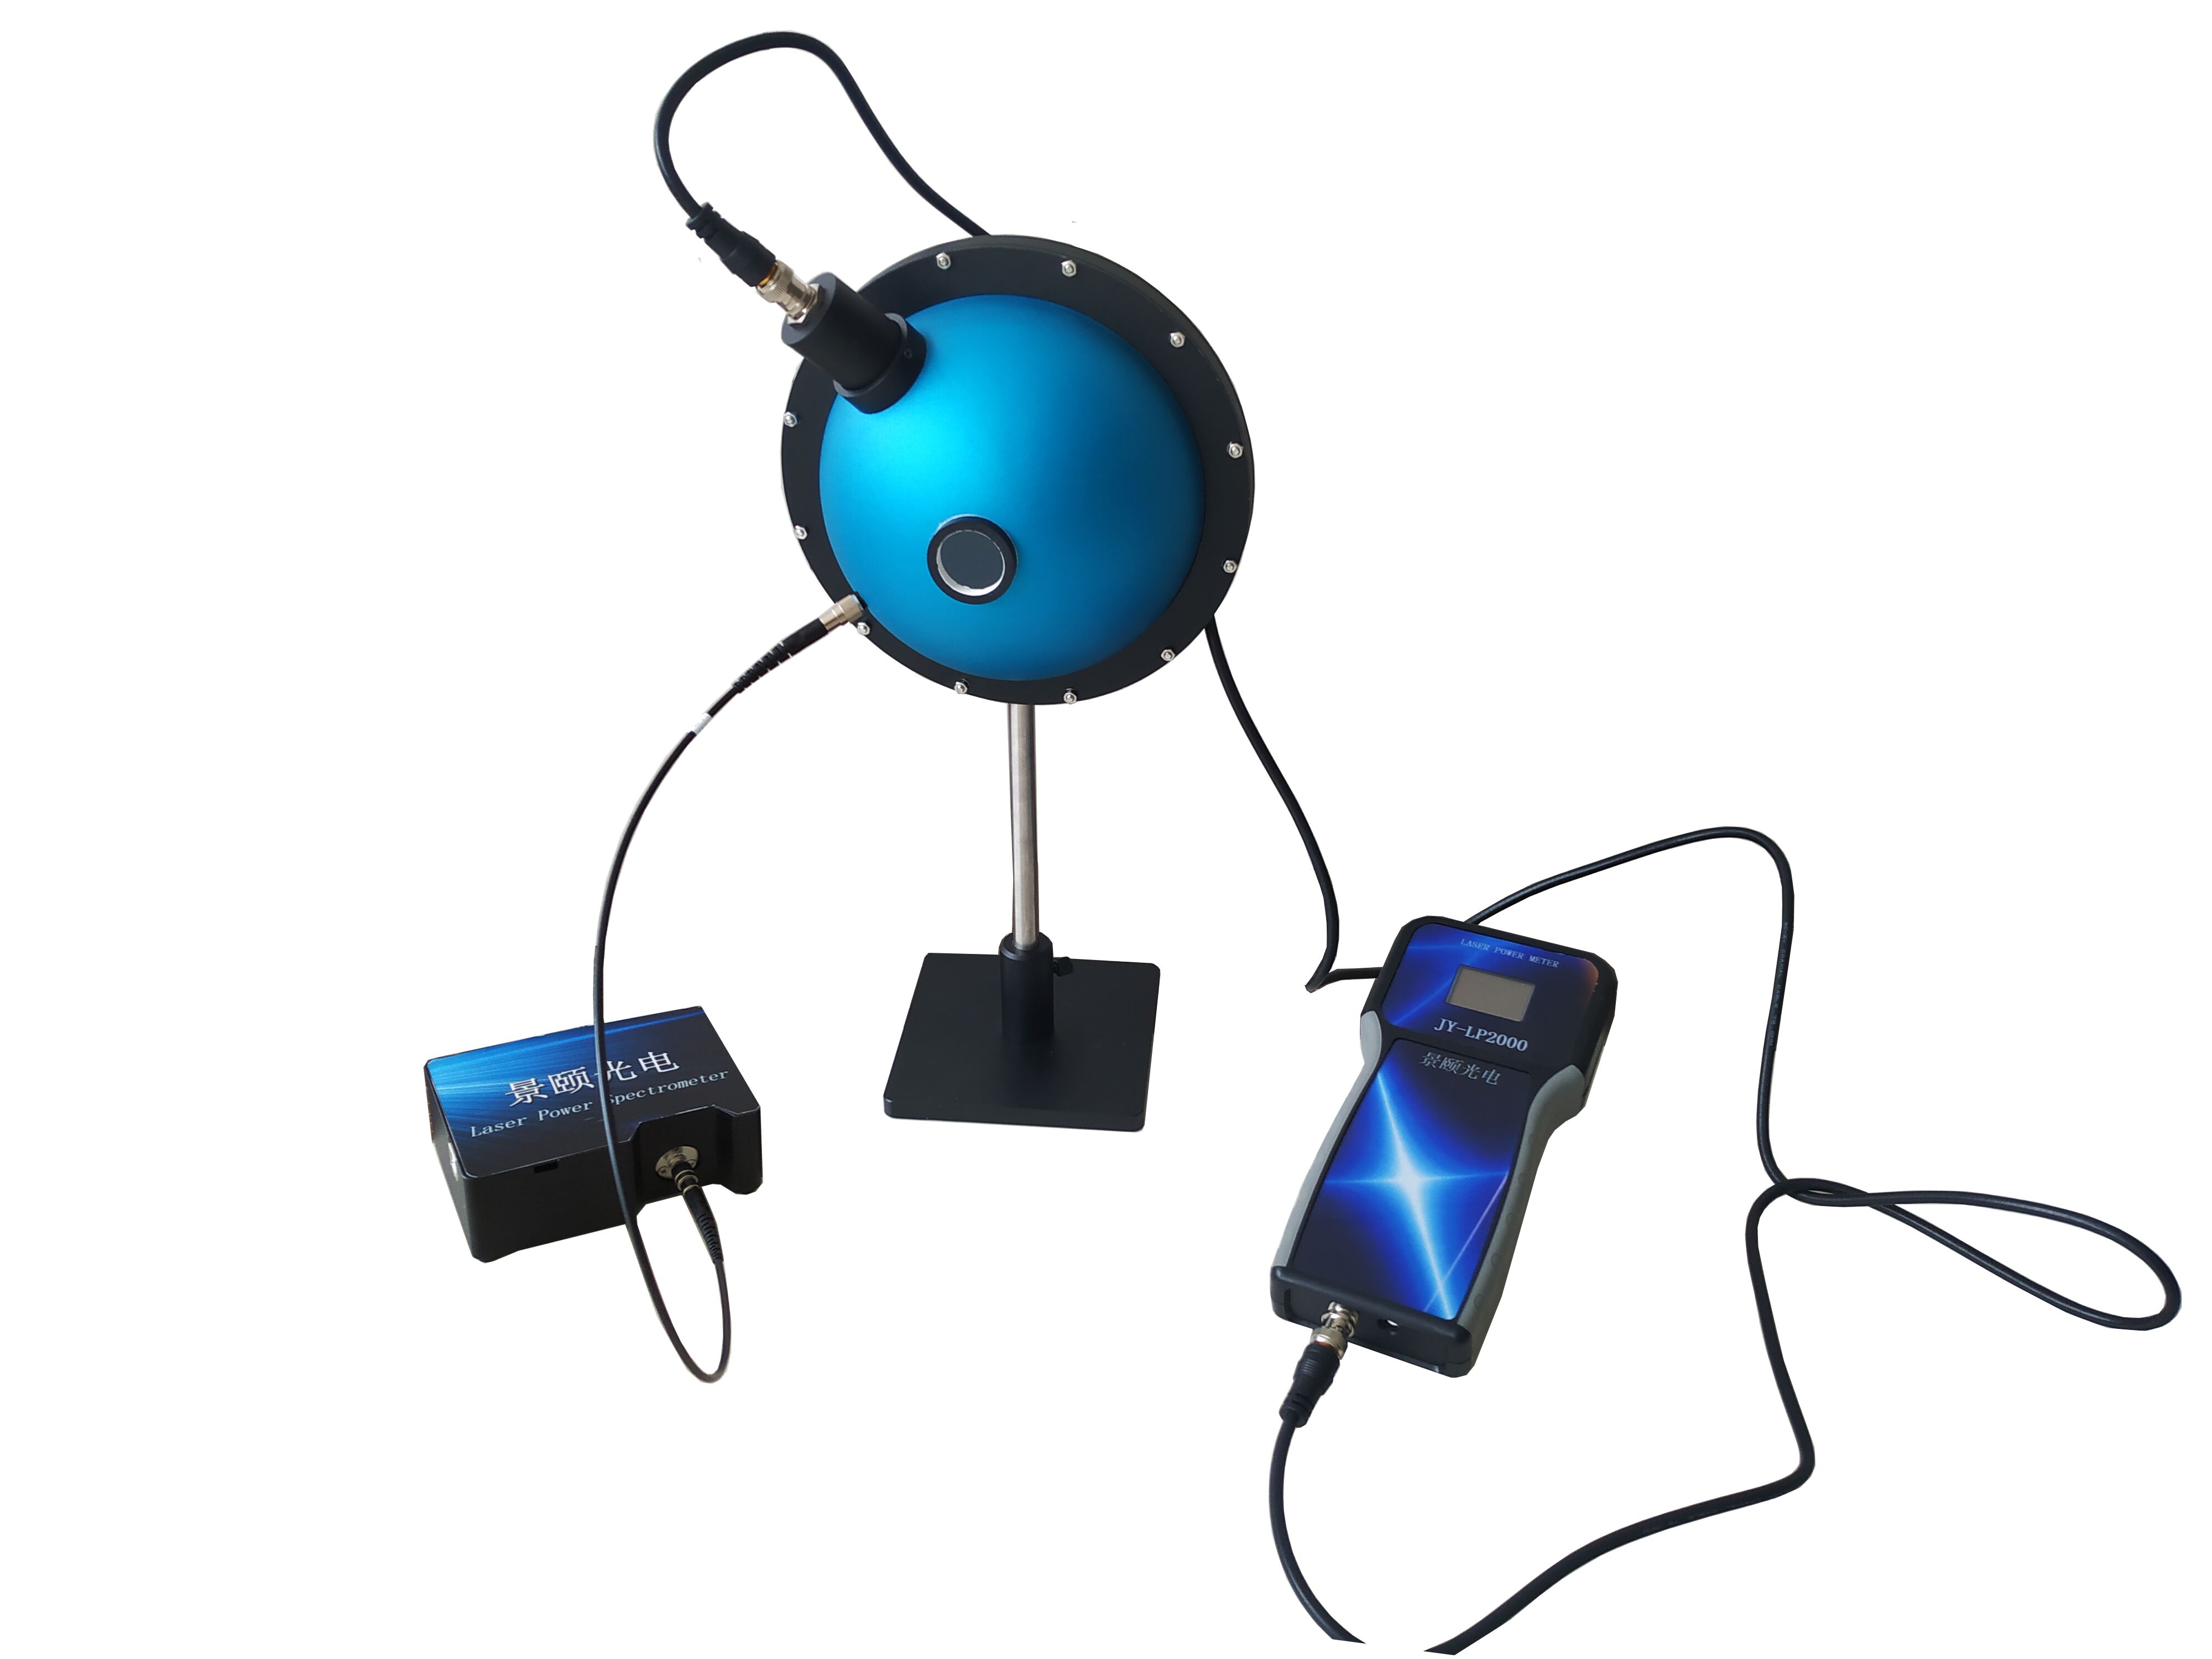
Transmittance and reflectance measurement on optical thin-film and transparency production lines fails most often not at the sensor, but at the sphere: inadequate spectral resolution and repeatability turn marginal lots into false accepts and rejects. This validation study evaluates a general-purpose spectral integrating sphere built around three anchors — a high-diffuse-reflectance coating at 99%, continuous 200–2,500 nm coverage, and near-Lambertian output — across multiple aperture sizes in transmission and reflection modes. The data show that lot-to-lot repeatability is governed directly by cavity diameter and coating uniformity: small-aperture configurations suit micro-area transmittance, while large-aperture configurations suit uniform light sources and radiometric calibration. The tested configurations map to semiconductor coating, aerospace optics, medical laser, and display panel inspection.
Why Resolution Is the Dividing Line in Transmittance Testing
Resolution in transmittance work is set by three things working together: cavity wall reflectance that is both high and uniform, continuous spectral coverage without stitching gaps, and stable incidence/exit geometry. A shortfall in any one of the three buries small differences under noise.
The failure that motivates this test is common enough. During a routine incoming inspection, a batch of cover glass was signed off as within transmittance spec, then showed a visible color shift after assembly. The glass was not the problem. The transmittance curves the same coupon produced on two different fixtures differed by about 0.37 percentage points — and the specification limit sat exactly inside that gap. When the number is that close to the line, "can the system produce a value at all" stops being the useful question. "Does it produce the same value twice" becomes the one that matters.
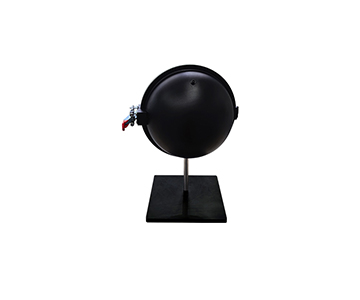
This study puts a mainstream general-purpose spectral integrating sphere at the center and compares transmission-type and reflection-type cavities across three sample classes — solid, pressed powder, and transparent film — to map where resolution holds and where it breaks under real production-line conditions.
Validation Methodology and Control Conditions
Five elements were held fixed so that any observed spread could be traced to aperture and coating rather than procedure:
•Samples: standardized transparent film, pressed powder pellets, and solid coupons.
•Environment: conventional laboratory temperature and humidity (23 ± 1 °C).
•Method: comparative measurement with empty-cavity baseline subtraction to remove system background.
•Instrument settings: integration time and spectral averaging count locked across all runs.
•Error sourcing: focused on coating reflectance drift, interface geometry deviation, and source drift.
Four Industry Case Studies: Where Resolution Actually Shows Up
Semiconductor Coating: Aperture Selection for Micro-Area Transmittance
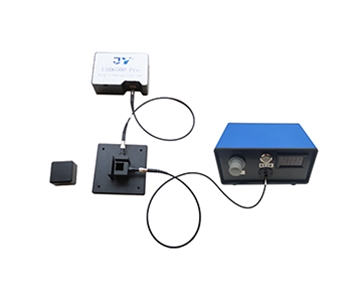
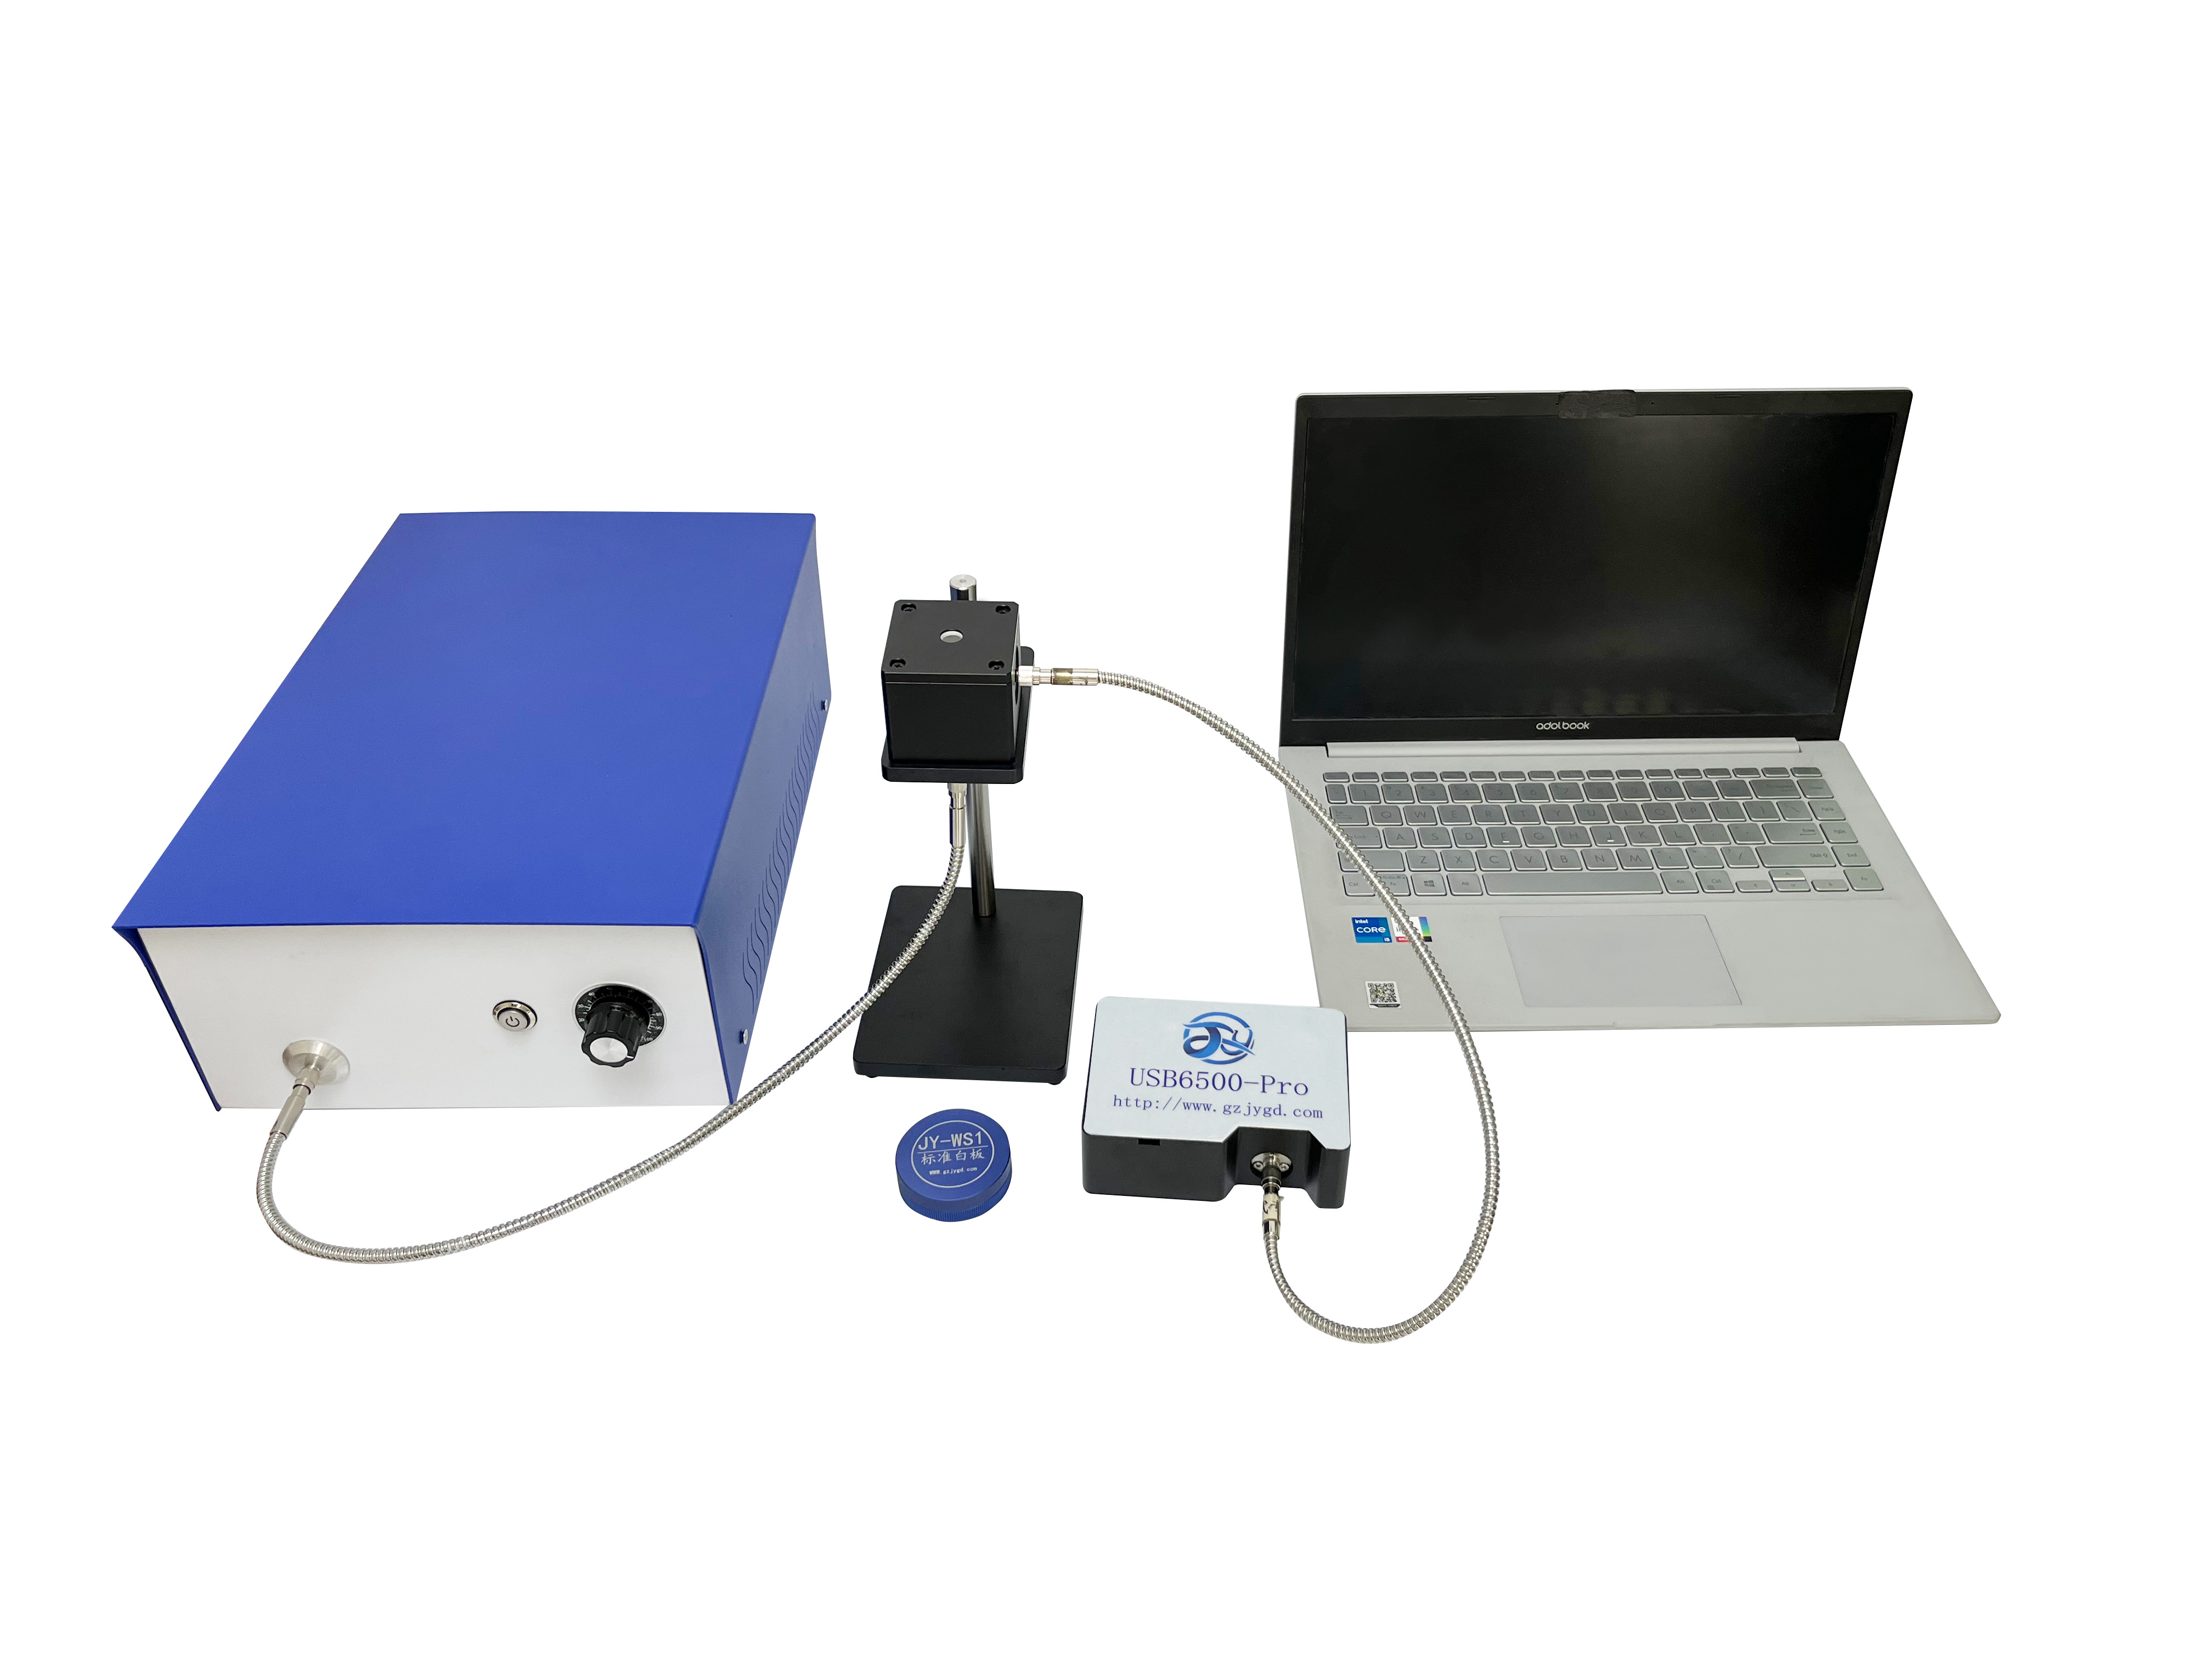
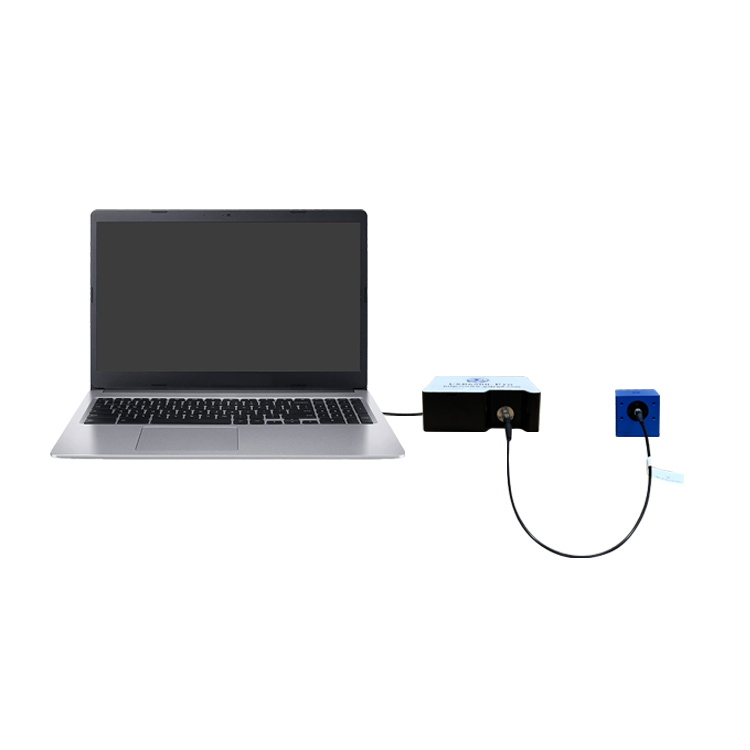
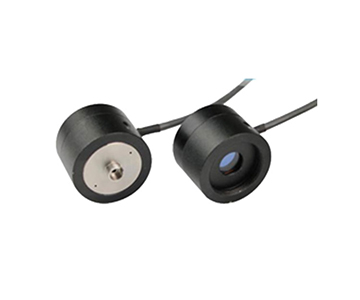
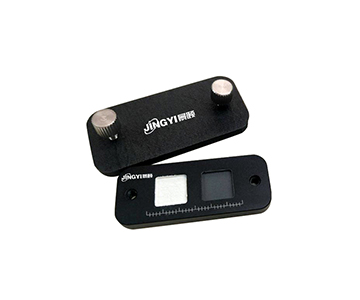
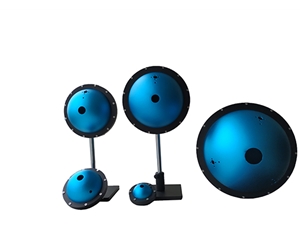
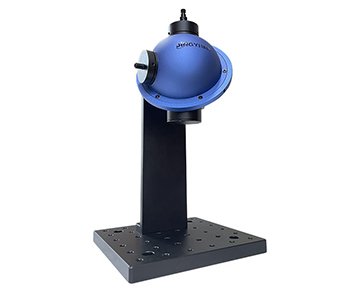
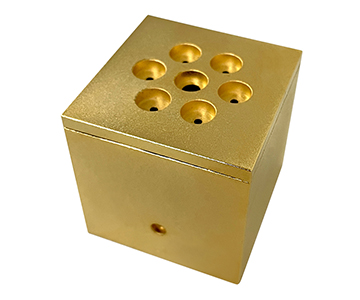
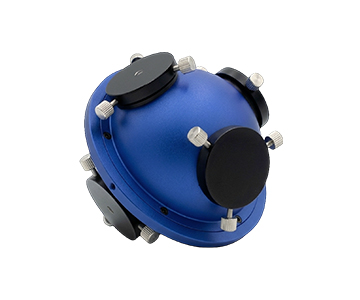
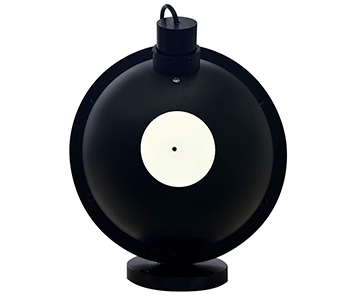
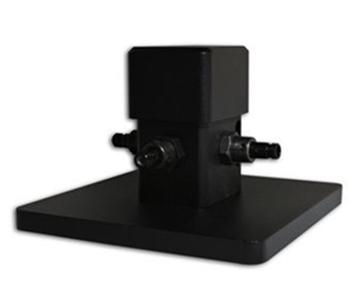
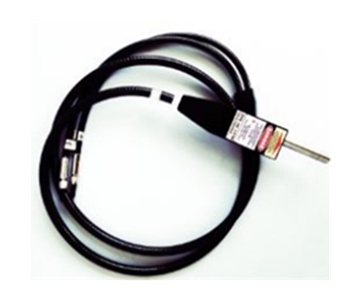
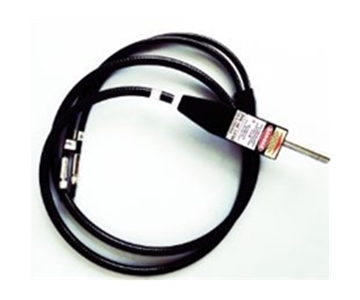
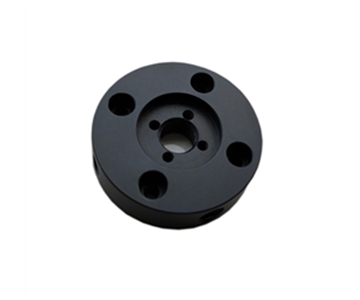
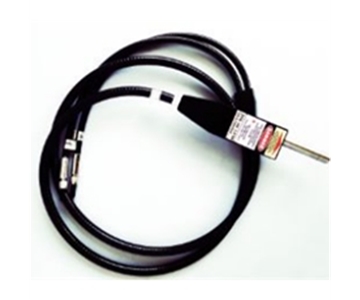
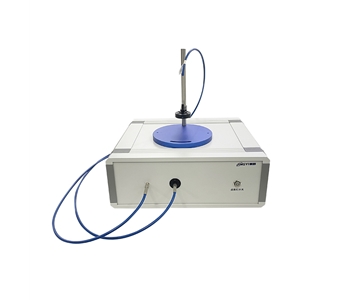
On a 200 mm wafer optical-coating line, coated glass needed rapid vis-to-NIR transmittance sampling with the repeatability band held as tight as possible. The setup paired a small-aperture transmission cavity (base type, 10 mm inner diameter, 1.5 mm entrance port, 0.06 in) with a spectrometer and cross-checked against a benchtop spectroscopic reference.
The small aperture won on sampling flexibility and short-wavelength signal-to-noise; the transmittance curve held up where the reference data thinned out. The tradeoff is throughput — a small cavity passes limited flux, so scan speed trailed the benchtop system.
| Comparison |
Small-aperture transmission cavity |
Benchtop spectroscopic reference |
| Wall reflectance |
99% (expanded PTFE) |
Not disclosed |
| Spectral range |
200–2,500 nm |
Visible–NIR |
| Entrance port |
1.5 mm (0.06 in) |
Not disclosed |
| Net weight |
29 g (1.02 oz) |
Comparatively heavy |
Aerospace Optics: Continuous Full-Range Coverage
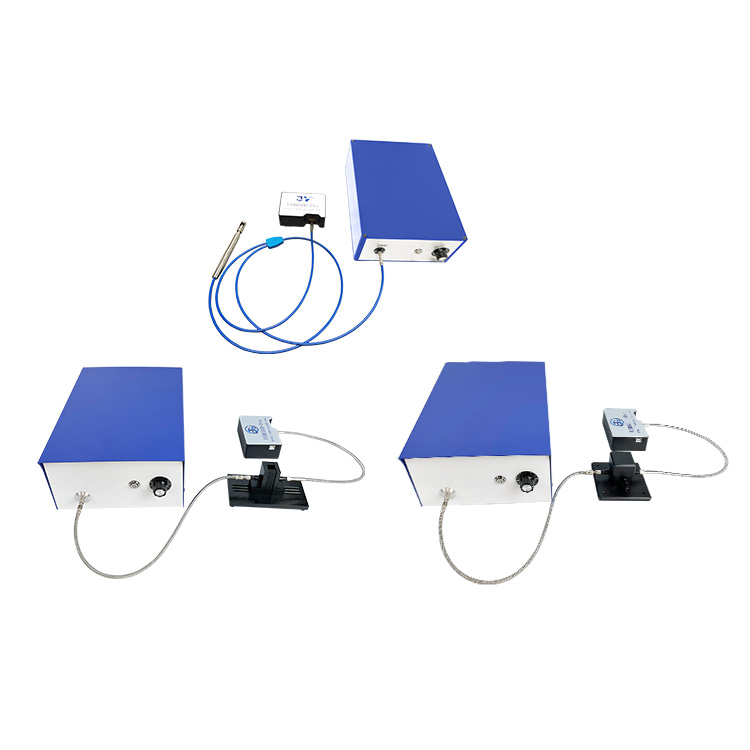
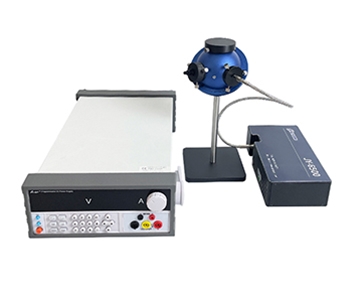
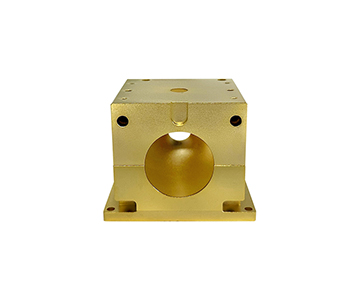
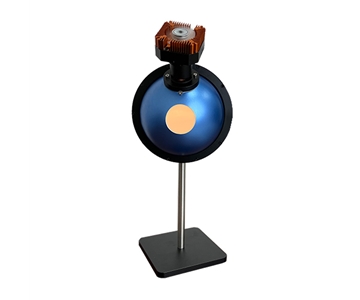
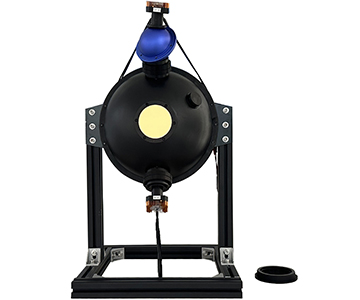
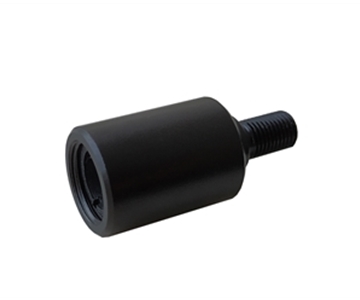
An aerospace optics supplier needed uninterrupted UV-through-NIR transmittance. A large-aperture transmission cavity (36 mm inner diameter, 9.5 mm entrance port, 1.42 in / 0.37 in) delivered continuous 200–2,500 nm coverage, which removed the resolution discontinuities that segment stitching introduces at band boundaries.
Medical Laser: Dual-Parameter Power and Wavelength
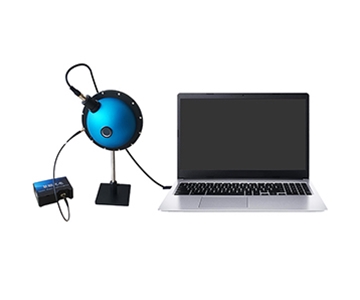
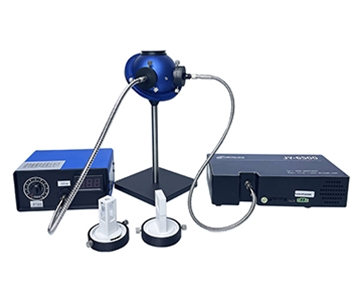
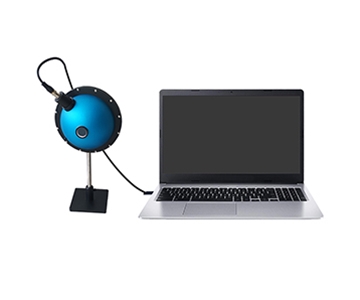
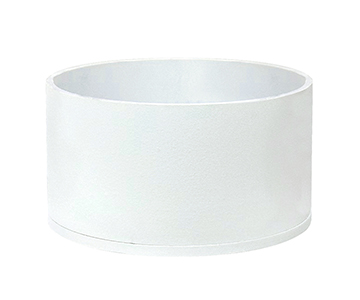
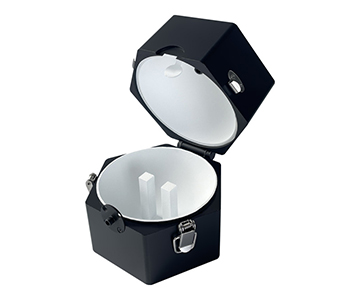
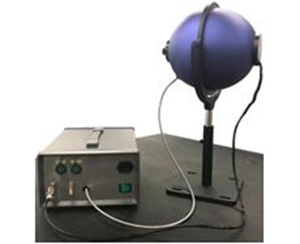
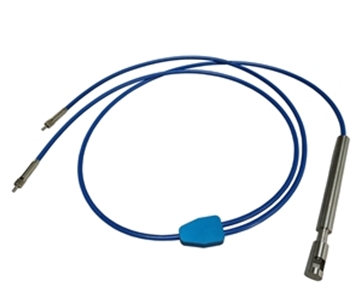
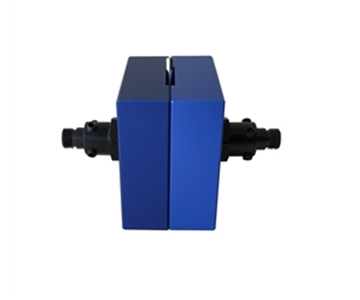
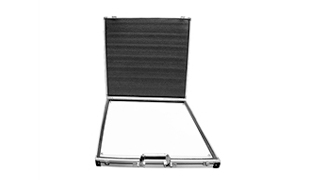
Medical laser module inspection requires transmittance and laser power from one fixture. An open-type large cavity (200 mm / 7.87 in diameter, clamshell latching, 60 × 60 mm sample stage) with an SMA905 interface allowed fast sample exchange, and repeat clamping consistency stayed within the inspection tolerance.
Display Panel: Linked Reflectance and Transmittance
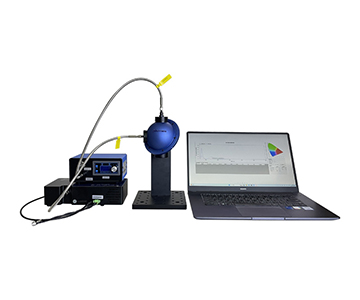
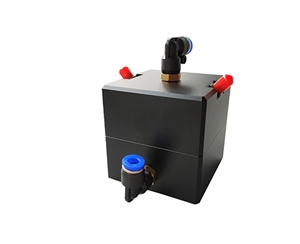
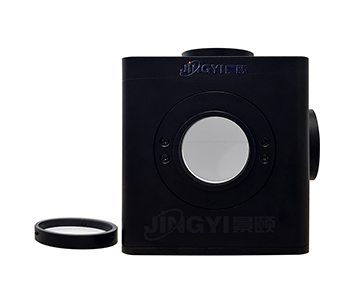
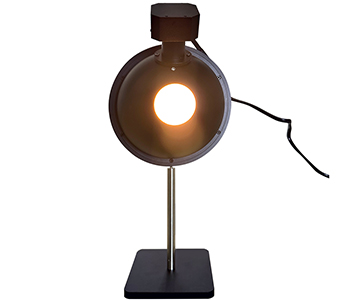
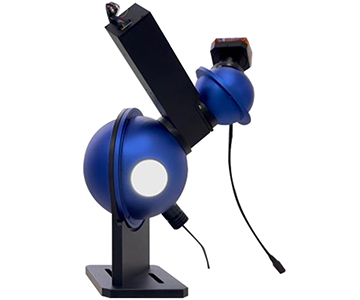
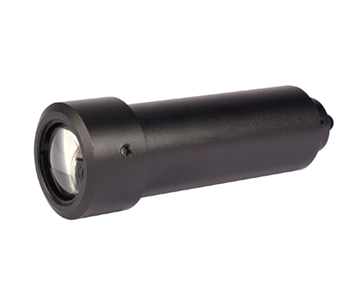
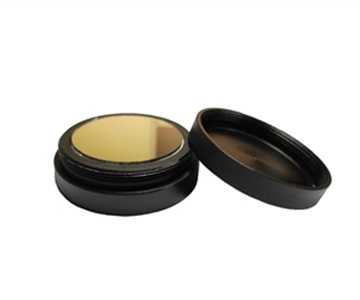
Display cover-glass inspection needs reflectance and transmittance together. A reflection-type cavity (15 mm inner diameter, 5 mm sample port, 0.59 in / 0.20 in, 8° incidence with collimating lens) handled reflectance acquisition and was linked to the transmission cavity, with geometry consistency holding across the pair.
Across all four cases the visible resolution differences concentrate at the short-wavelength end and in curve detail: the larger the aperture and the more uniform the coating, the more stably a weak transmittance difference can be resolved; the smaller the aperture, the better suited it is to micro-area work rather than overall uniformity judgment.
Three-Tier Comparison: Resolution-Relevant Specifications
| Dimension |
Import premium tier |
Domestic mainstream tier |
Domestic economy tier |
| Coating reflectance |
~99% class |
99% (expanded PTFE) |
95–97% (BaSO₄) |
| Spectral range |
200–2,500 nm |
200–2,500 nm |
200–2,500 nm |
| Coating uniformity |
Not disclosed |
Held within ±1% |
Not disclosed |
| Customization flexibility |
Limited |
Aperture/coating customizable |
Limited |
| Delivery cycle |
Long |
~7 days for small batches |
Short |
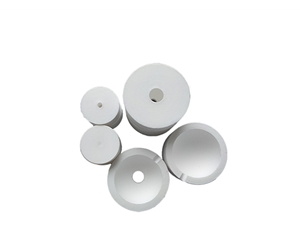
A domestic economy cavity using a BaSO₄ liner measures 95–97% reflectance, clearly below the 99% of expanded PTFE — on weakly absorbing samples it loses resolution first. That is a disadvantage worth confronting at selection time. The domestic mainstream tier already matches imported performance on reflectance and spectral coverage, but its long-horizon traceability chain is still weaker than the mature calibration链路 of the import premium tier.
Jingyi Optoelectronics participated in drafting GB/T 47066-2026, which specifies methods for determining total transmittance and total reflectance of plastics; the 99% coating reflectance and 200–2,500 nm coverage documented under standard conditions are the direct basis for judging whether resolution meets that determination.
Restating the key numbers: coating reflectance across the three tiers falls in a 95–99% band with a narrowest gap of roughly 2–4 percentage points; the domestic mainstream tier holds coating uniformity within ±1% with spectral reflectance above 99%; on delivery, domestic small-batch customization can compress to about 7 days, materially faster than the long import cycle.
Customer Feedback: Where the Data Also Falls Short
A technical lead at a provincial metrology institute, disclosing under authorization and identified here only as a senior engineer, reported the following. After adopting a domestic large-aperture cavity in the radiometric calibration chain, short-term repeatability of the uniform source output performed well and met daily calibration needs. The same feedback noted, however, that the bundled software is slow on batch curve processing, and that baseline drift requires manual re-check during long continuous runs. This comes from authorized customer disclosure and does not paper over the gaps.
Error Sourcing and Practical Recommendations
Resolution problems usually originate not in the cavity itself but in three places: coating reflectance declining with service time, assembly deviation in interface geometry, and short-term source drift. Practical recommendations follow from that:
1.Make empty-cavity baseline subtraction a mandatory step on every measurement.
2.For transparent parts, prefer the large-aperture type to protect flux.
3.Reach for the small-aperture type only for micro-area sampling.
4.On reflectance work, hold collimation consistency at the 8° incidence geometry.
Honest Limitations
Domestic cavity solutions already match imported capability on reflectance and spectral coverage, but two boundaries deserve stating plainly. First, the BaSO₄ coating version measures 95–97% reflectance and resolves weak-absorption and low-contrast samples worse than the PTFE version. Second, the small-aperture transmission cavity passes limited flux and scans slower than a benchtop system, and its long-horizon metrological traceability still depends on an external calibration chain. Neither point is a rejection; both are conditions to match at selection time.
Frequently Asked Questions
Q1: What actually determines resolution in transmittance measurement?
It is set jointly by cavity wall reflectance, coating uniformity, spectral coverage, and the stability of incidence and exit geometry. Higher reflectance and a more uniform coating make weak transmittance differences easier to resolve stably.
Q2: How should I choose between a small- and large-aperture cavity?
Choose the small-aperture type for micro-area sampling or where clamping space is tight; choose the large-aperture type when overall uniformity, flux, and radiometric calibration matter. The two are complementary rather than interchangeable.
Q3: What is the difference between BaSO₄ and PTFE liners?
BaSO₄ reflectance is about 95–97% with temperature resistance near 100 °C; expanded PTFE reaches 99% reflectance and tolerates higher temperatures. Weakly absorbing samples should go to the PTFE version first.
Q4: How do I control cost during selection?
Avoid chasing a fully loaded specification. Set aperture and coating by the actual measurement object, prioritize reflectance for weakly absorbing samples, and use the economy tier for routine QC rather than over-configuring.
Q5: How can I independently verify whether a system meets specification?
Using a standard method such as GB/T 47066-2026, run a repeatability test with a known reference coupon after empty-cavity baseline subtraction, and compare the curve dispersion of one stable sample across multiple apertures to form your own assessment.
Editorial Notes
Research Basis
: Public industry documentation, GB/T 47066-2026 standard data, and authorized customer disclosure (n = 3 sample classes; 200–2,500 nm; 23 ± 1 °C).
Reviewed by
: Cai Xiaodong, Senior Application Engineer at Jingyi Optoelectronics, with 12 years of experience in industrial precision optical measurement.
Sponsorship Disclosure
: Jingyi Optoelectronics manufactures spectral integrating spheres and related optical inspection systems. Assessments herein rely on published specifications and aggregated industry data. No third-party compensation was involved.
Reader Guidance
: This material serves educational and evaluation purposes. Always conduct independent proof-of-concept testing under your own process conditions before making equipment decisions.
Publication Date
: November 2026