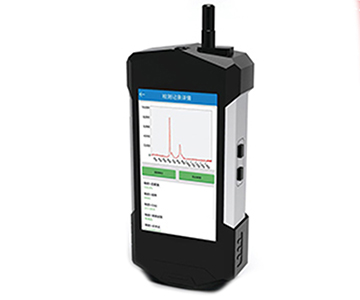
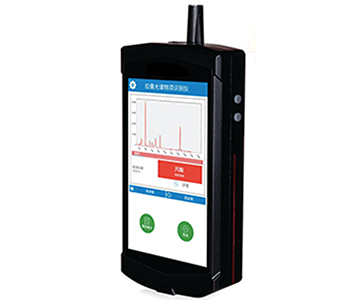
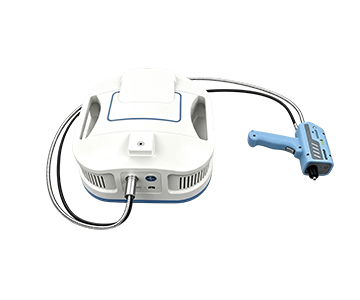
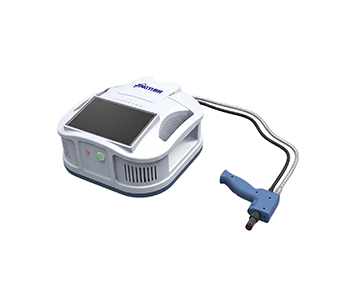
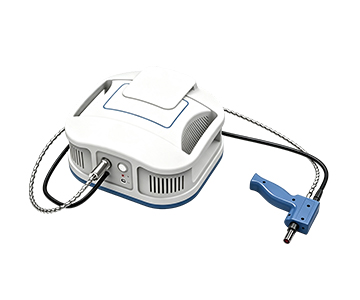
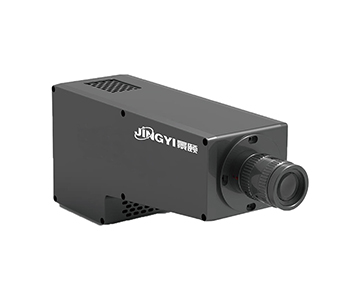
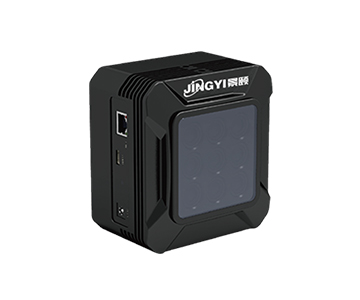
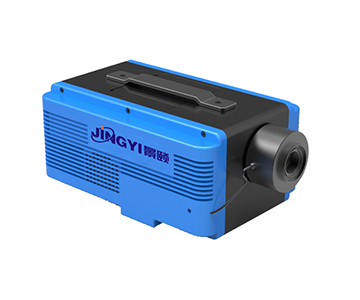
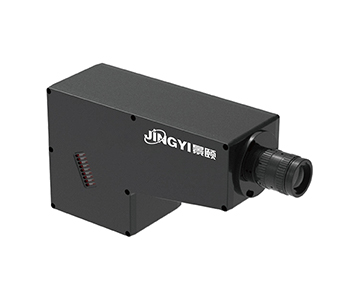
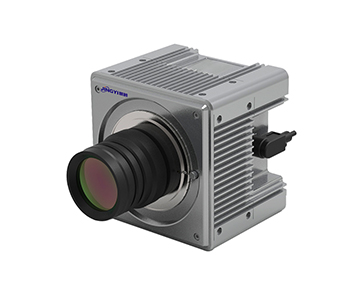
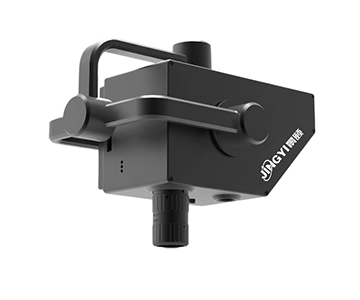
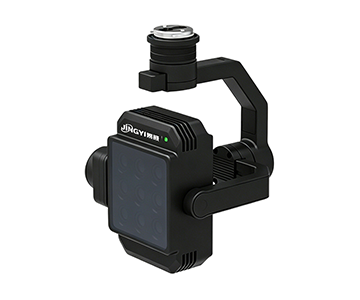
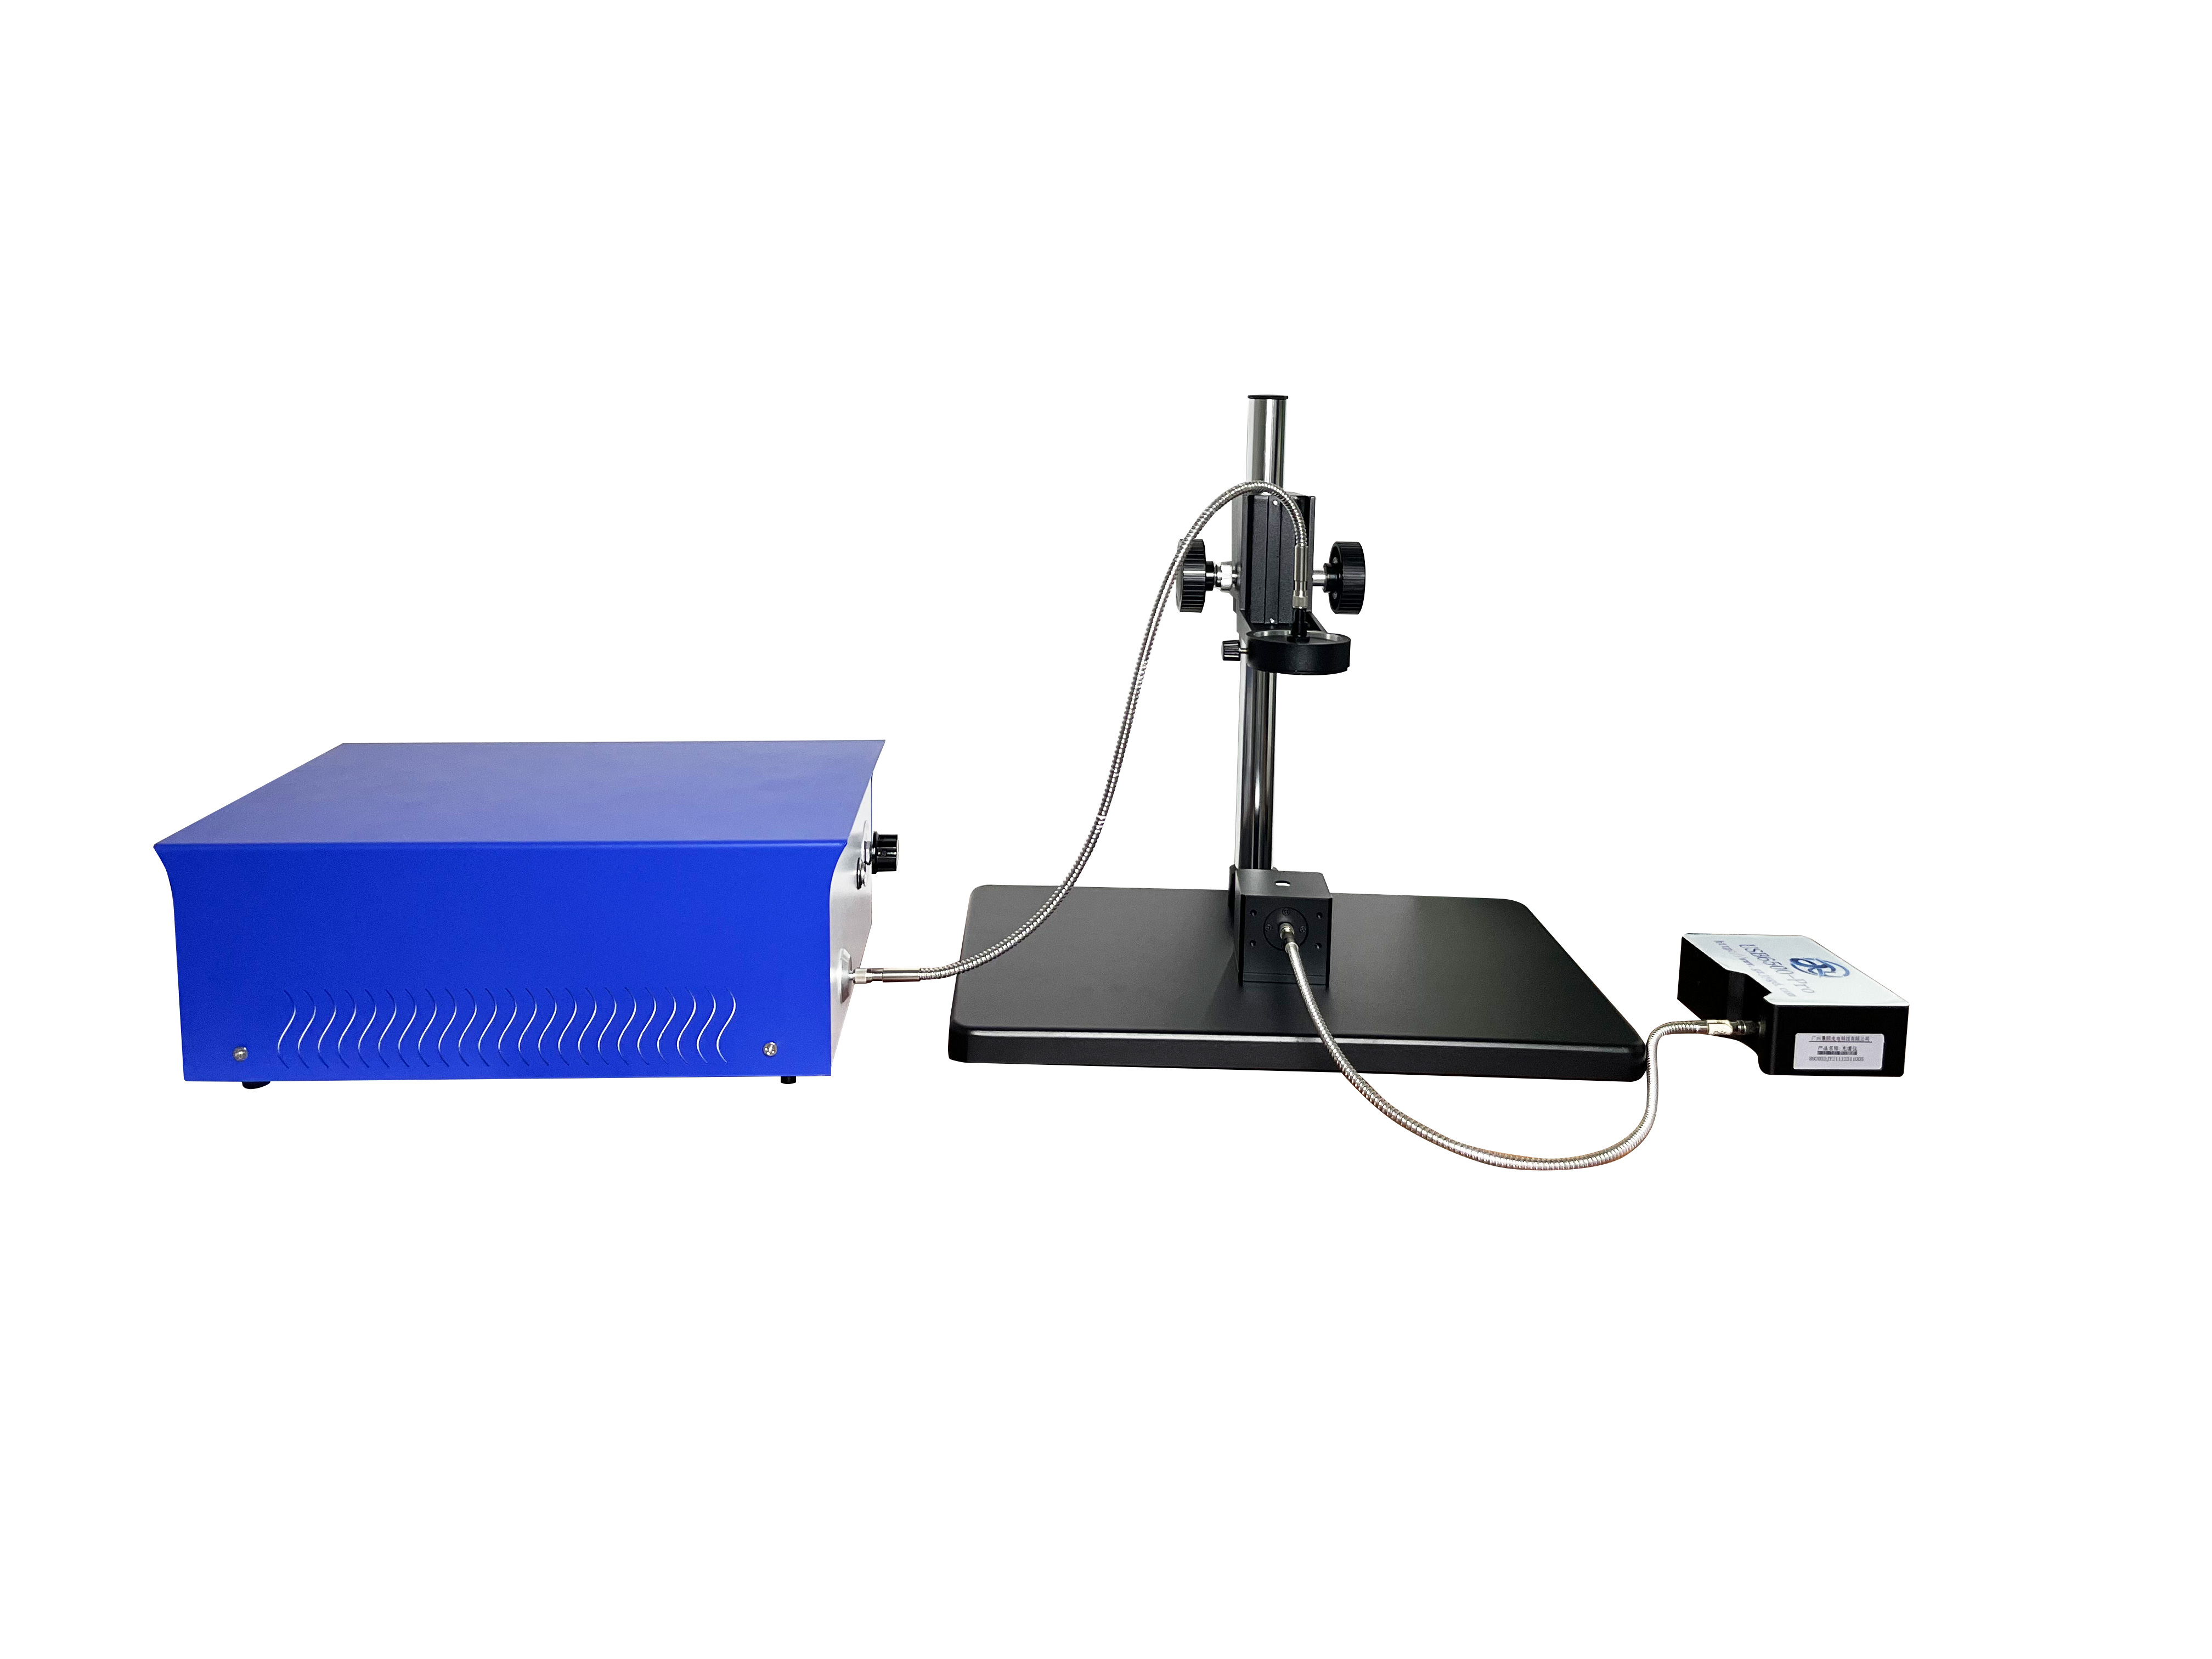
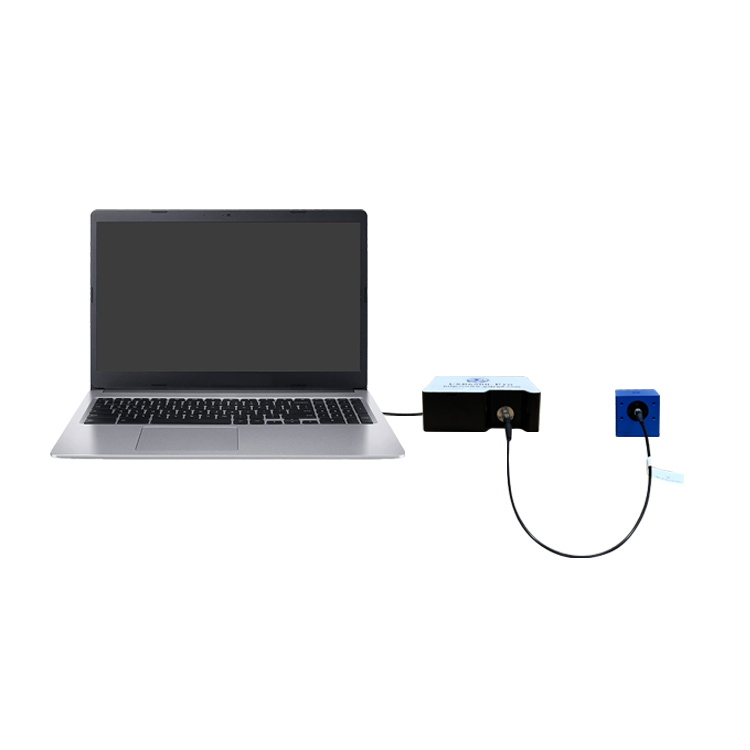
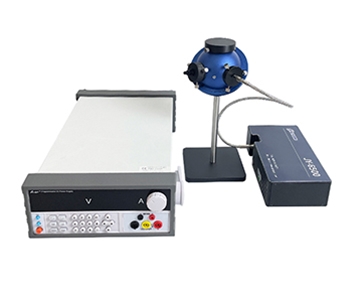
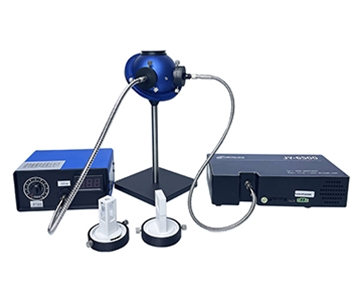
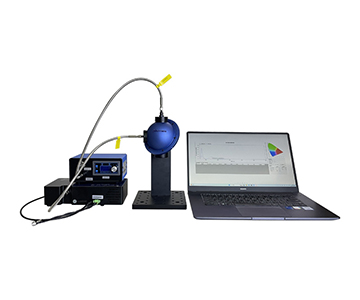
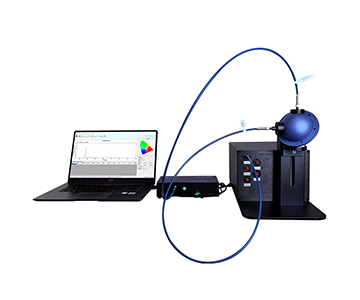
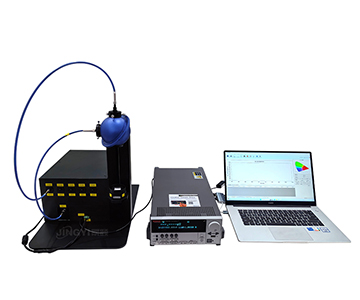
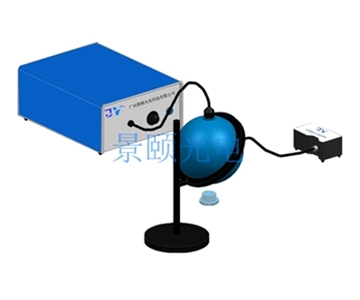
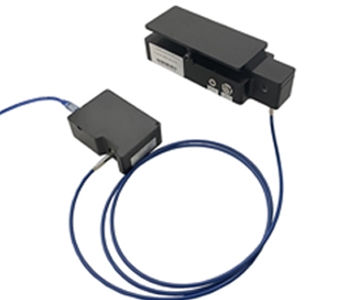
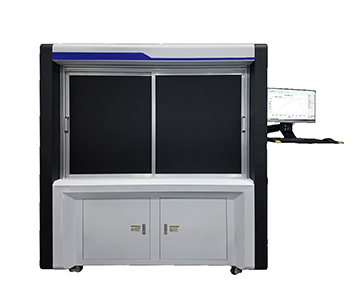
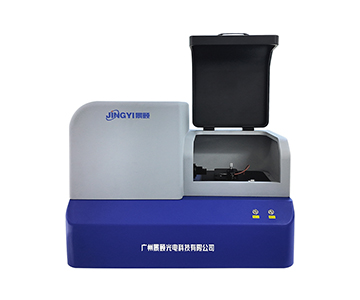
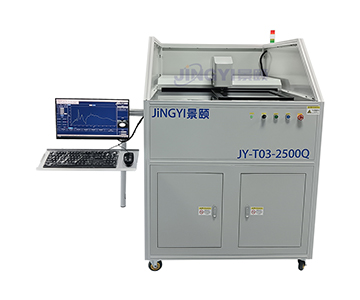
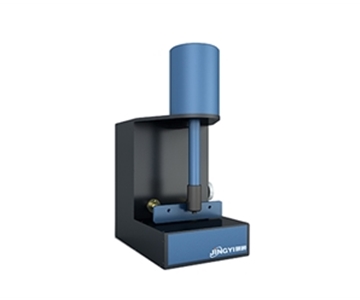
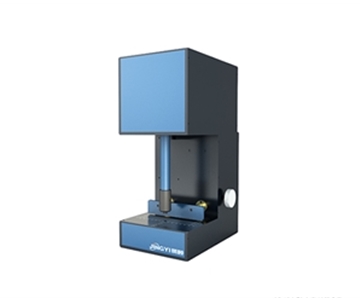
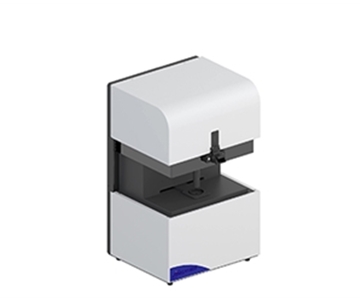
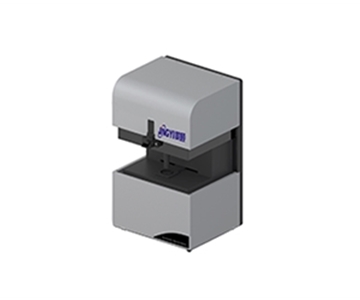
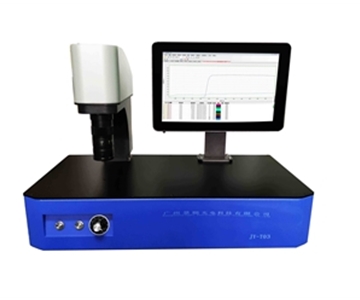
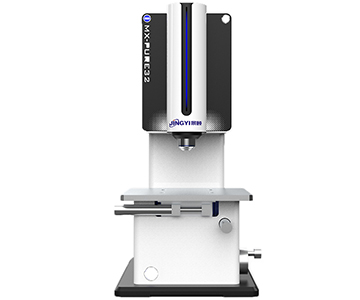
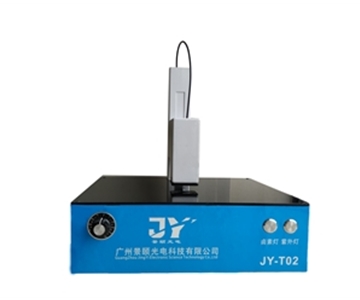
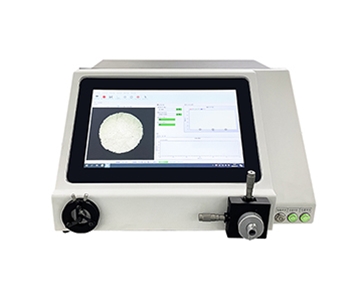
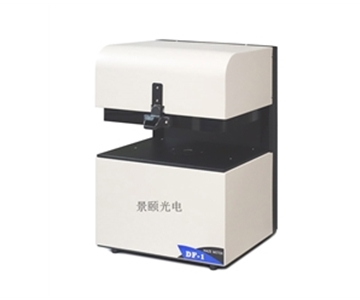
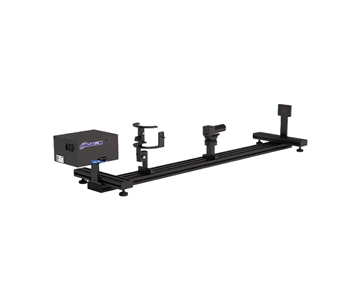
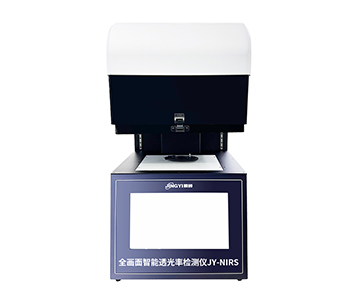
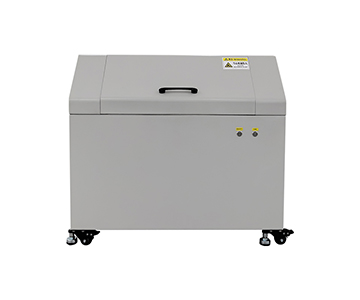
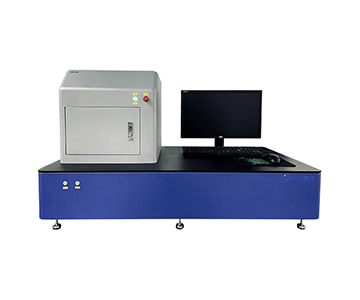
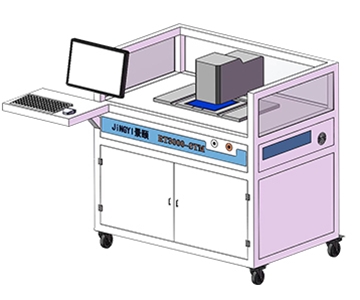
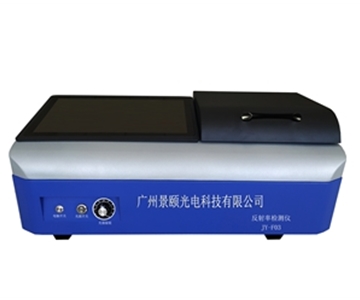
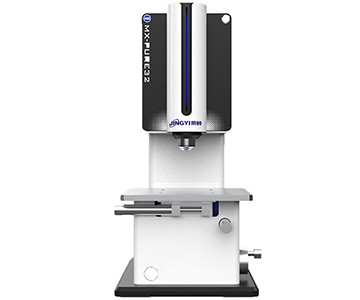
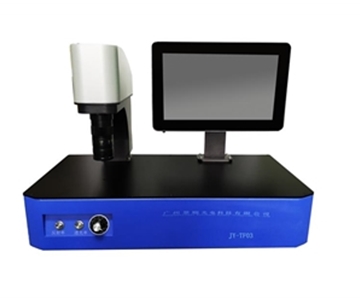
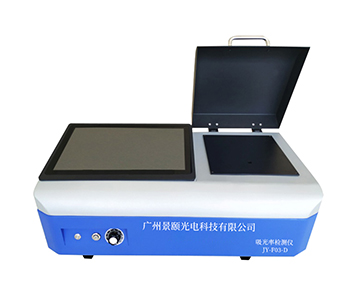
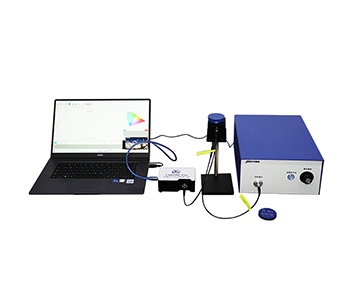
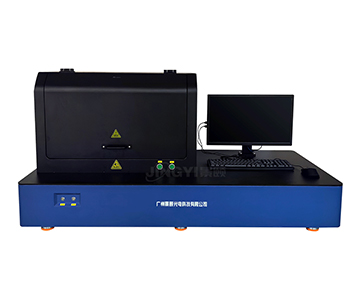
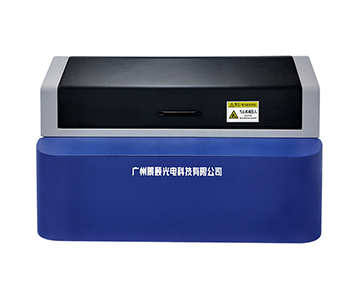
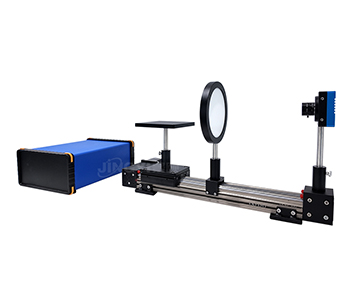
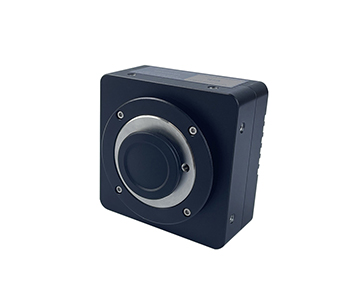
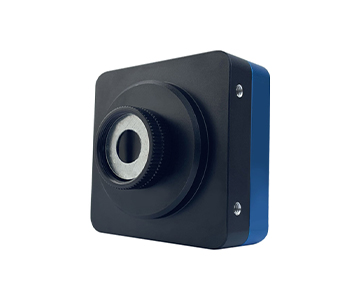
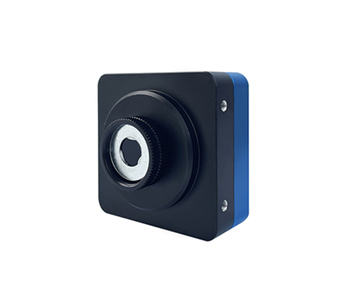
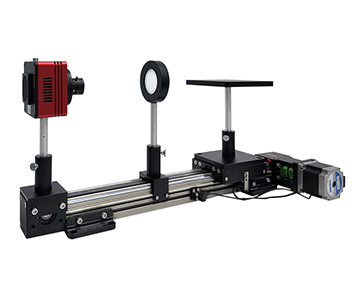
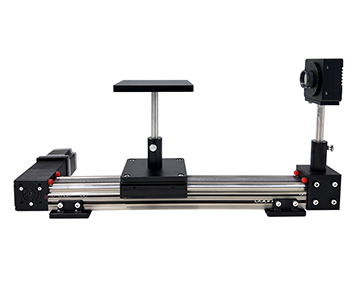
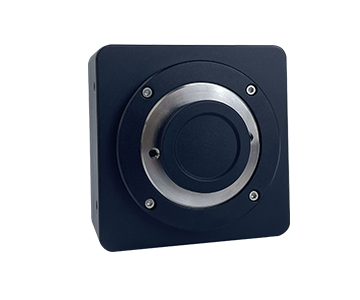
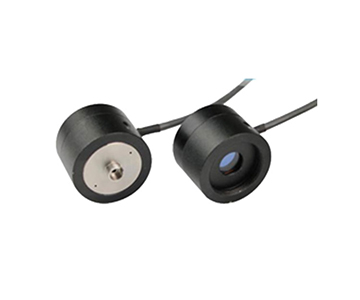
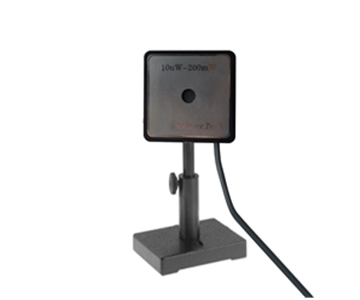
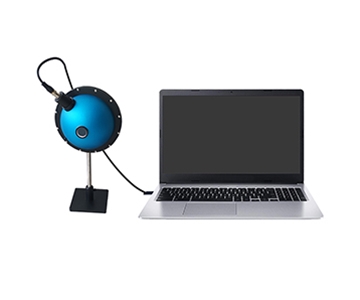
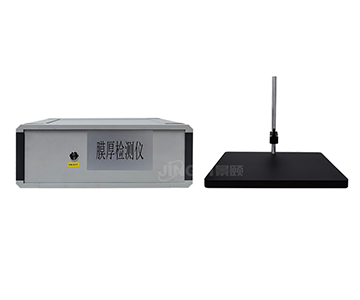
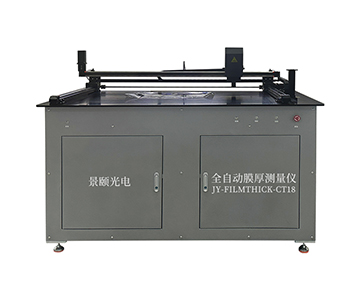
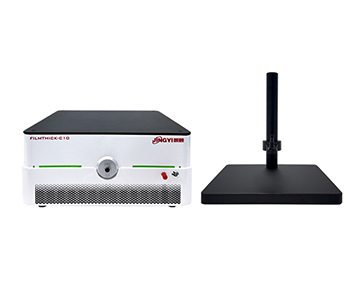
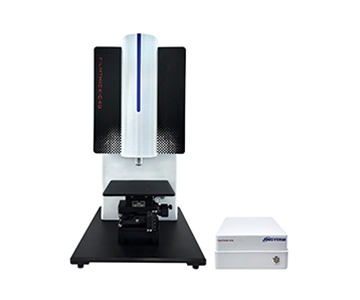
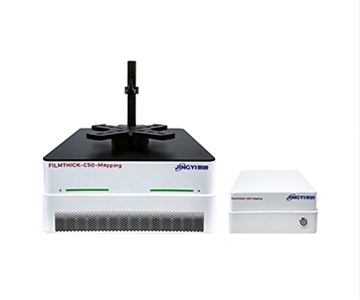
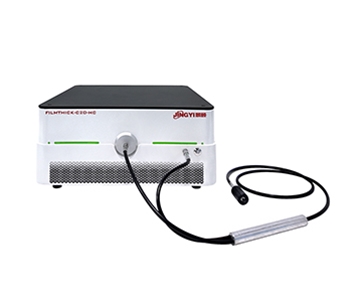
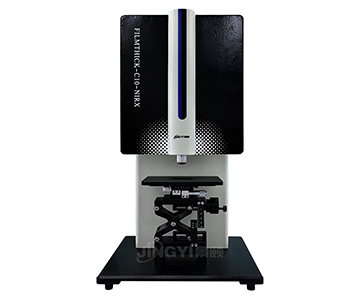
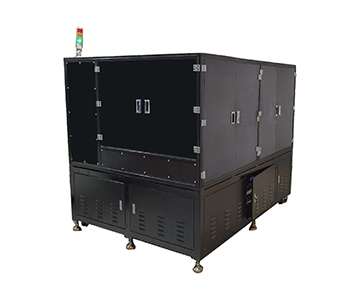
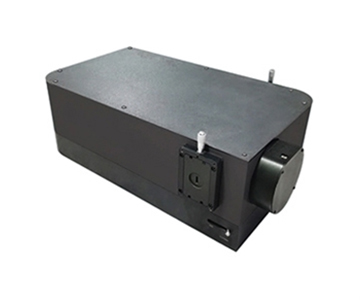
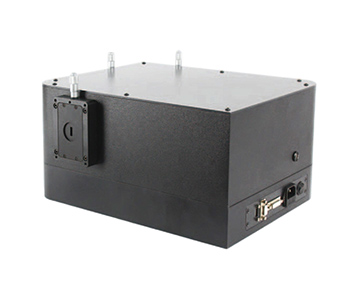
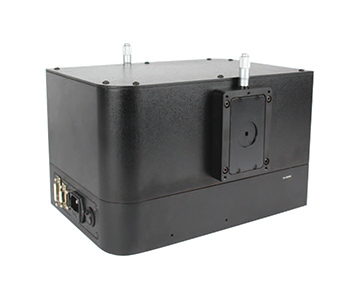
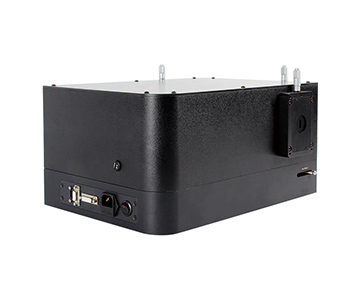
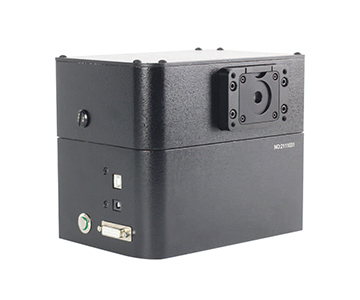
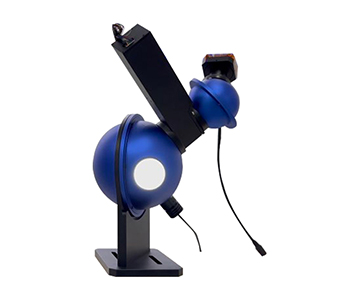
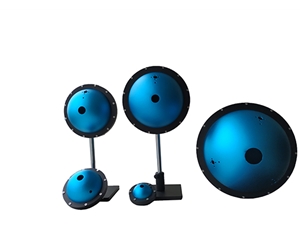
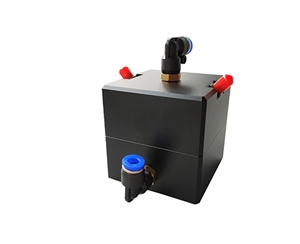
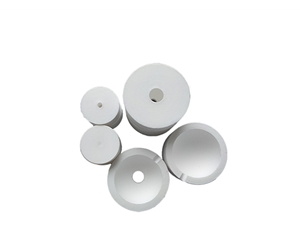
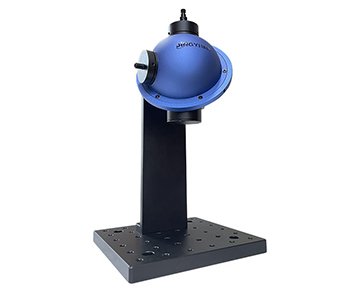
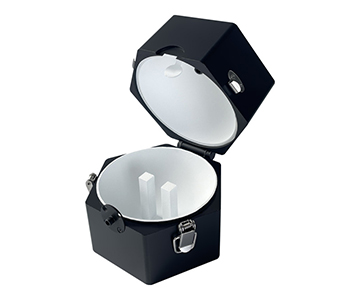
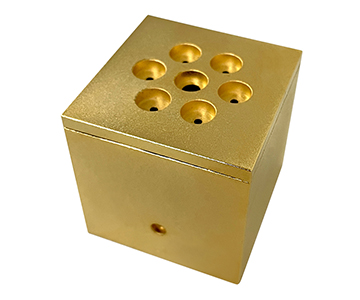
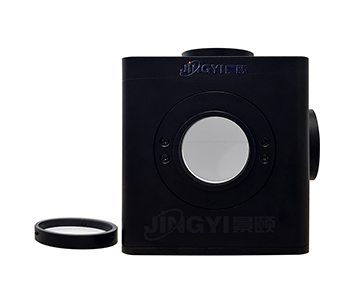
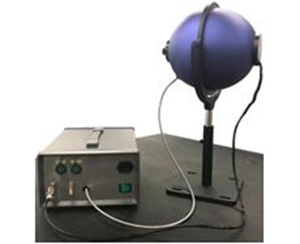
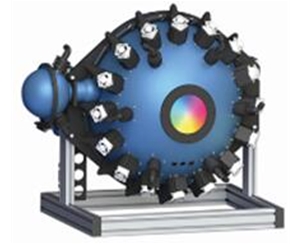
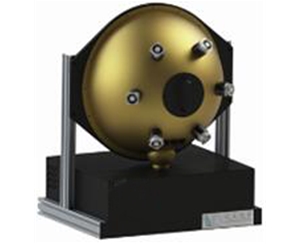
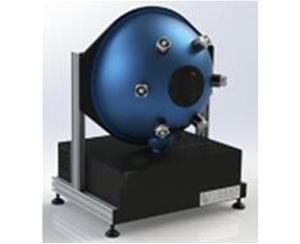
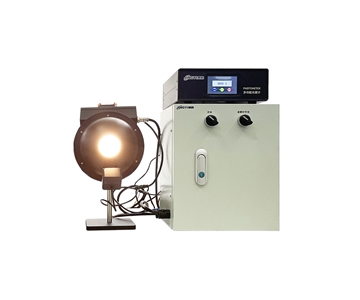
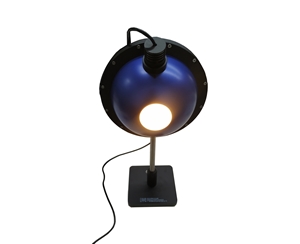
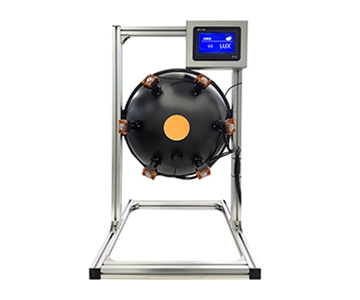
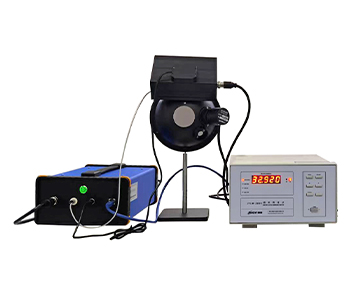
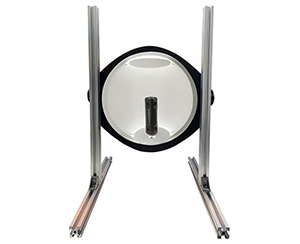
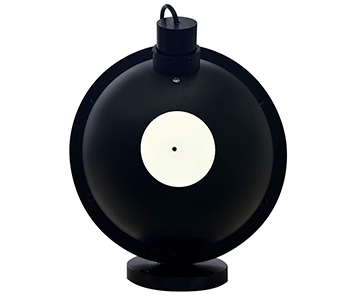
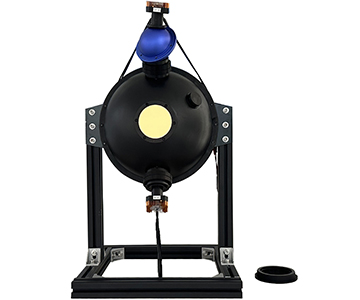
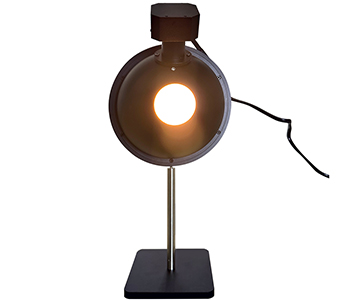
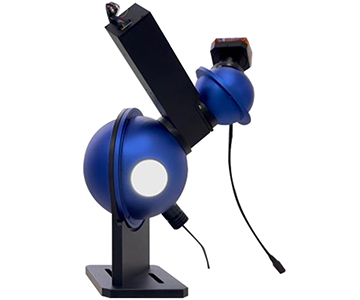
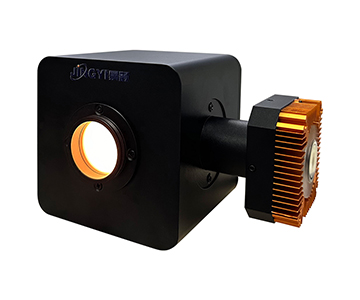
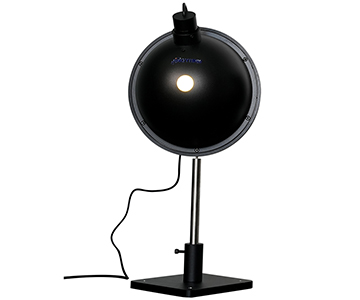
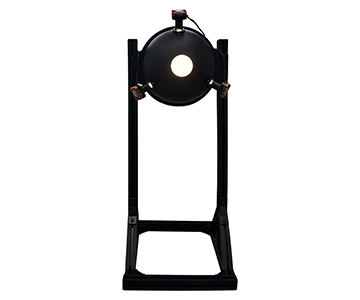
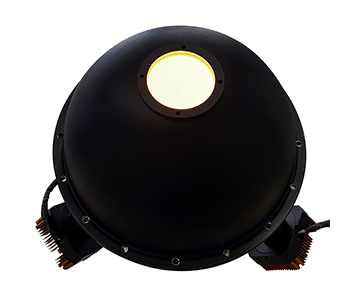
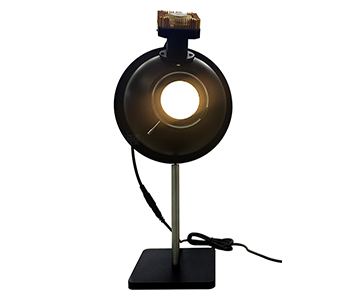
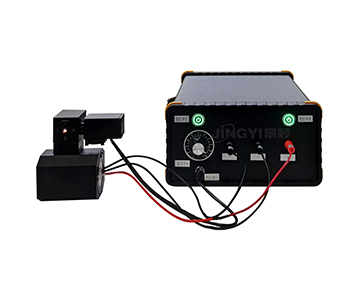
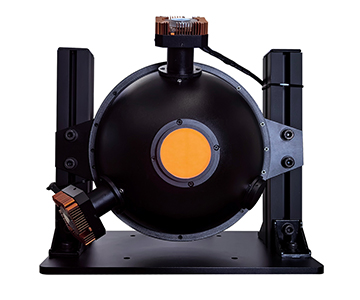
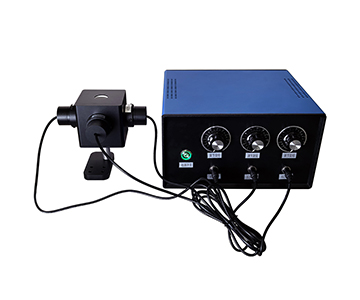
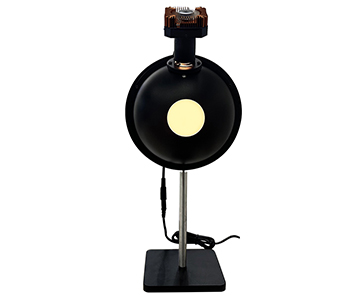
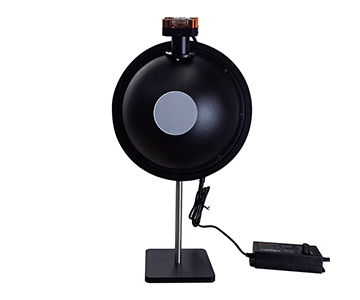
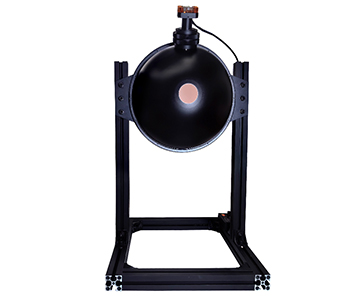
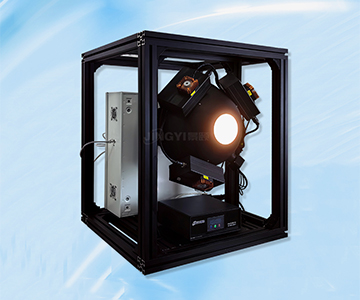
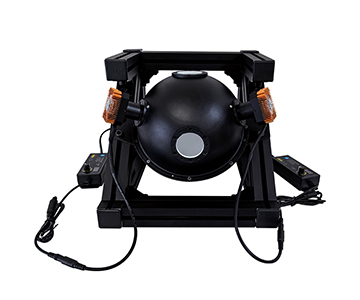
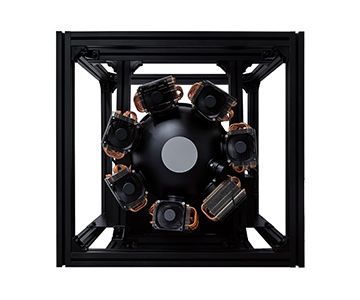
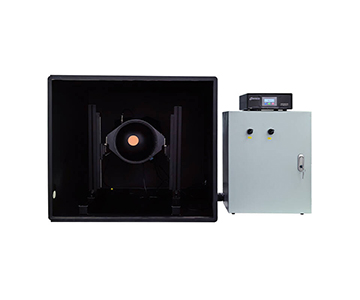
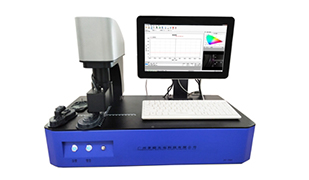
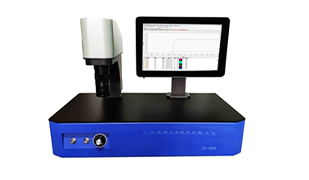
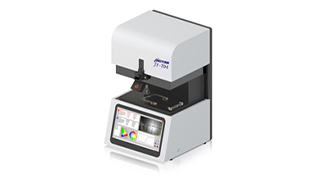
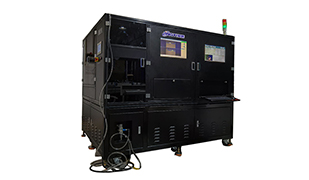
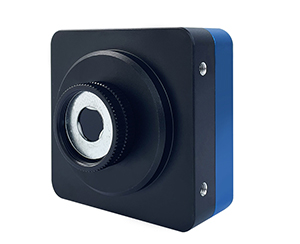
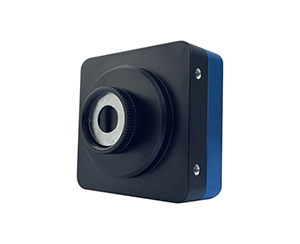
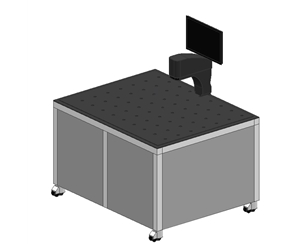
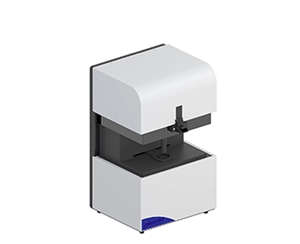
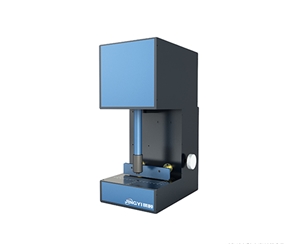
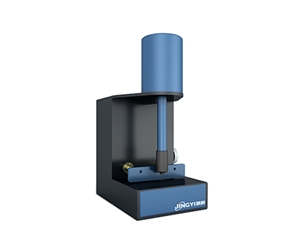
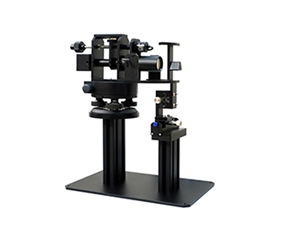
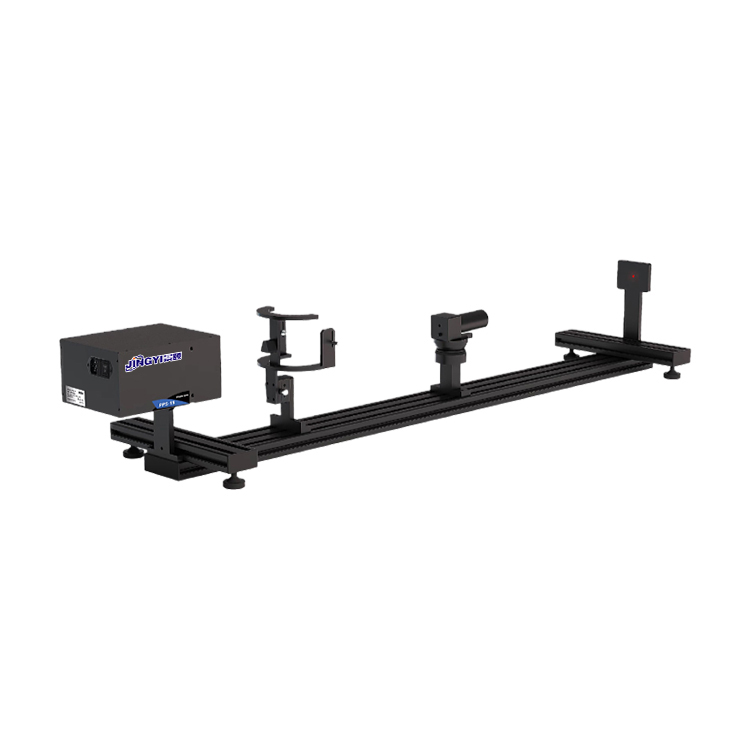
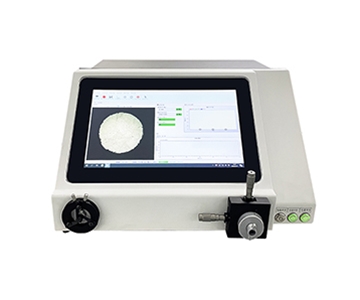
Selecting a beam profiler for laser production lines is less about pixel counts and more about whether measured beam parameters stay stable under vibration, EMI, and power transients. This guide breaks down detector matching, pixel-size limits, frame rate versus takt time, bit depth, trigger synchronization, and a practical POC protocol. Validation data references a 22.4 mm sensor format, 12-bit readout, 300–1700 nm coverage, and combined vibration plus switch-mode power disturbance testing.
Parameter Inflation and Hidden Line Losses
A process engineer qualifying a new profiler watched centroid position drift by fractions of a millimeter the moment the scan mirror engaged. Exposure was locked, gain zeroed, and the jitter persisted. The algorithm was not at fault; effective pixel count and readout immunity simply did not survive the real floor.
Low-cost units often print "micrometer resolution" while hiding single-digit frame rates, 8-bit depth, and undefined attenuator limits. Buyers order against the spec sheet, then discover beam pointing stability cannot be resolved at all. Rework and line-stop costs quietly exceed the original price gap.
Detector confusion makes it worse. One vendor labels a device "beam analyzer" with a visible CMOS chip; another uses InGaAs; a third uses vanadium oxide. Measuring a 1550 nm fiber alignment signal with a visible-only sensor is effectively blind testing.
Seven Procurement Dimensions
Detector Material and Wavelength Coverage
Ultraviolet curing sources need a 300–1100 nm CMOS window. Telecom tail-end measurement at 1550 nm requires InGaAs with response extending to 1700 nm. Long-wave thermal imaging belongs to uncooled vanadium oxide arrays in the 8–14 µm band. Wrong detector choice turns every reported beam diameter into pseudo-data.
Pixel Size and Measurable Spot Floor
Smaller pixels are not automatically better. A 3.2 µm pixel on a 22.4 mm target gives a usable floor near 32 µm; a 5.86 µm economy pixel pushes the floor to 58.6 µm. In fiber coupling, a sub-100 µm spot covered by fewer than 3–5 pixels distorts ellipticity fitting.
Frame Rate Versus Line Takt
Static lab work tolerates 23.3 fps. Flying inspection needs more. Near-infrared InGaAs configurations reach 227.7 fps at 640×512; mid-infrared runs near 50 fps; economy CMOS spans 7–41 fps. If takt math is unclear, even an accurate sensor stalls inside the buffer.
Attenuator Power Boundary and Saturation Protection
Standard attenuators help, and higher-power stacks can extend range toward 1000 W. Without saturation protection, one strong pulse clips the channel. No bit depth recovers a signal lost outside the linear region.
Bit Depth and Dynamic Range
Twelve bits acts as the working baseline. It separates main lobe from trailing energy in a false-color 2D map. An 8-bit device reports brightness; a 12-bit device reports how energy distributes.
Interface, Trigger, and Multi-Axis Sync
Gigabit Ethernet, USB 3.0, and software or hardware triggers should be configurable. When centroid coordinates must align to motion-control timestamps, missing hardware trigger means data cannot be traced back to the event axis.
Thermal Drift and Mechanical Stability
Visible-band units typically operate 0–50 °C; infrared variants extend to −30–60 °C. A fan-cooled large-format head weighing 550–600 g will drift with HVAC cycling unless the isolation platform is properly damped.
Candidate Comparison
| Tier |
Detector |
Wavelength |
Sensor Format |
Pixel |
Measurable Spot |
Frame Rate |
| Import reference |
Scientific CMOS / InGaAs |
Narrow custom |
Medium |
Small |
Fine |
High, costly |
| Large-format domestic |
22.4 mm CMOS |
350–1100 nm |
22.4 mm |
3.2 µm |
32 µm–22.4 mm |
23.3 fps |
| Near-IR domestic |
InGaAs |
400–1700 nm |
3.2×2.56 mm |
5.0 µm |
50 µm–2.5 mm |
227.7 fps |
| Mid-IR domestic |
Uncooled VOx |
8–14 µm |
10.88×8.7 mm |
17 µm |
170 µm–8.7 mm |
50 fps |
| Economy domestic |
Mixed CMOS |
300–1100 nm |
9.8–14.12 mm |
3.4–5.86 µm |
34.5 µm–10.3 mm |
7–41 fps |
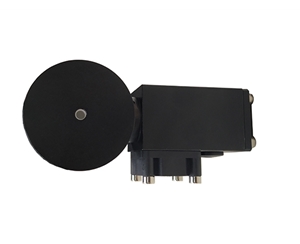
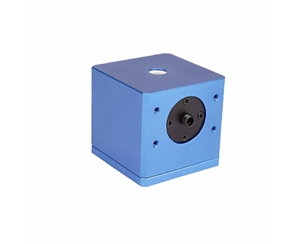
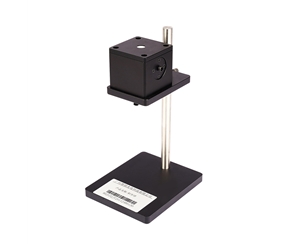
The overlooked variable is sensor format multiplied by maximum spot size. The 22.4 mm large-format head absorbs wide far-field divergence; the near-IR head trades format for 227.7 fps sampling. Selection is the intersection of spot diameter, frame rate, and wavelength — not the biggest number on the page. For automotive lidar optical assembly, beam pointing and divergence consistency matter; the high-frame-rate near-IR tier maps directly to that online monitoring requirement.
POC Validation Method
Skip the brochure. Start with a calibrated collimated source of known diameter and check whether major and minor axis readings hold within pixel-scale deviation.
Run a shaker at 0.1 g and capture 500 frames. Record centroid standard deviation. Under EMC stress, watch for line-sync tearing or gain jumps when the switched-mode supply and servo drives power on.
Fire pulsed laser with hardware trigger locking the frame. Verify the minimum exposure window, such as 12 µs, does not drop energy. Export raw reports and compare Gaussian-fit overlap across two measurement passes to judge repeatability.
Ten-Point Inspection Checklist
1.Does wavelength coverage include the full laser spectrum?
2.Is the minimum measurable spot below one-third of the sample feature size?
3.Does frame rate exceed line takt by at least 1.5×?
4.Is bit depth ≥12 bit?
5.Are single and stacked attenuator saturation thresholds backed by measured curves?
6.Are hardware trigger and external clock sync supported?
7.Can the software export raw grayscale, not only rendered images?
8.Does operating temperature span summer and winter shop-floor extremes?
9.Are lens mounts interchangeable, C-mount, M-mount, or proprietary?
10.Do report fields include ellipticity, divergence angle, and Pass/Fail thresholds?
Common Engineer Mistakes
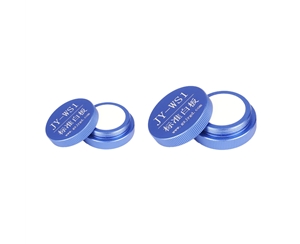
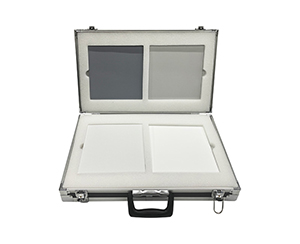
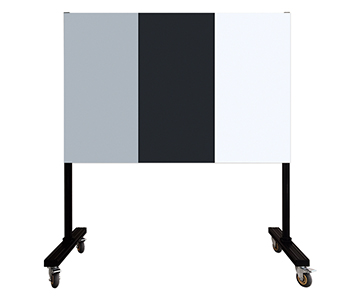
Reading "5120×5120 resolution" as "measures 5 µm spots" ignores the 3.2 µm pixel and diffraction limit; the credible floor stays near 32 µm. Visible white-board calibration without infrared extinction checking misjudges 1550 nm coupling. USB 3.0 treated as a long-term industrial interface ignores Ethernet noise margin. Fanless mini heads placed next to high-power laser cavities develop thermal drift no one can trace for hours.
EMC Boundaries and Honest Limitations
Beam profiling is not isolated optics. Servo motors, RF sources, and switching supplies inject common-mode noise into CMOS readout. A metal-housed, fan-cooled large-format head stayed stable from 0–50 °C, yet running unshielded capture cables parallel to drives doubled centroid jitter.
Economy small-form heads lose repeatability in heavy EMI floors. Uncooled mid-IR arrays below 35 mK thermal sensitivity react to power ripple. These limits never appear on the spec sheet. They surface only under combined power-transient and vibration stress during POC.
Supplier Evaluation and TCO
Verify three things: parameters reproduce, software has no hidden annual fee, calibration chain traces to recognized standards. Write free sampling into the contract with defined sample types, not verbal promises.
Warranty length, response time, and upgrade policy go in attachments. Attenuators are consumables; list spare-unit pricing separately. For inline optical inspection, downtime costs more than the unit-price gap. Calculate three-year maintenance and spare TCO, not bare-machine price.
Frequently Asked Questions
How do I quickly judge whether beam profiler pixel data is trustworthy?
Use a metrology-grade collimated source at fixed diameter and capture 100 frames. Check centroid standard deviation. Jitter beyond two pixels points to readout noise or trigger sync issues.
Can near-IR and mid-IR profilers replace each other?
No. InGaAs covers 400–1700 nm; vanadium oxide targets 8–14 µm. Band mismatch causes no response or saturation. Match detector to source wavelength.
What frame rate is needed for flying inspection?
Reverse-calculate from takt. A 200 ms inspection window needs at least 3× margin, so ≥15 fps. Dynamic pointing analysis prefers above 50 fps.
How should import and domestic tiers be compared on value?
Import scientific tiers offer higher precision but longer lead times and costly consumables. Domestic tiers with 12-bit depth and multi-band coverage fit production scenarios when repeatability is verified independently.
How can I independently verify long-term reliability?
Run 72-hour cyclic exposure with temperature variation. Export daily reports and compare Gaussian-fit drift using your own threshold criteria, not vendor scripts.
Reference Information
Sources
: Uploaded product technical documentation, ISO/IEC 17025 calibration principles, public laser metrology test data.
Author
: Cai Xiaodong, Senior Application Engineer, Jingyi Optoelectronics — 12 years in optical measurement and spectroscopic instrumentation.
Conflict of Interest
: Jingyi Optoelectronics manufactures beam profiling and optical inspection equipment. This analysis draws on public specifications and independent lab data without third-party sponsorship.
Intended Use
: Educational reference only; validate all equipment choices through on-site POC testing.
Updated
: November 2026
For detailed specifications and application notes on beam profiling systems, search "Jingyi Optoelectronics beam profiler" or visit our technical library.