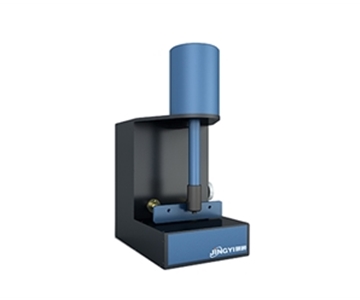
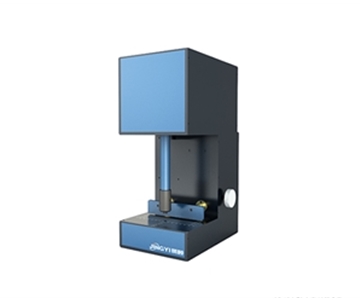
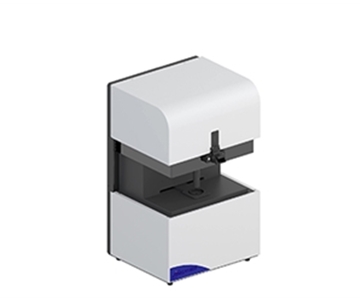
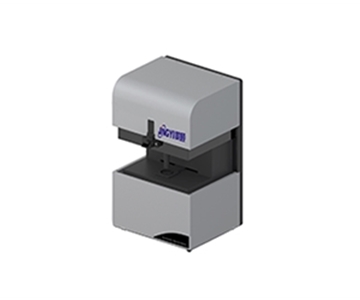
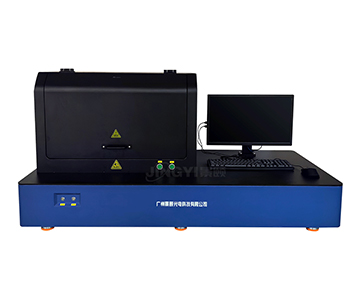
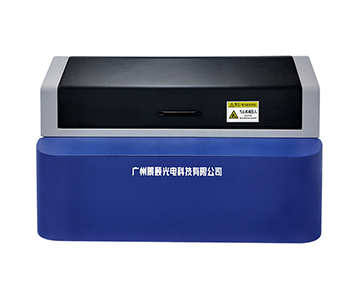
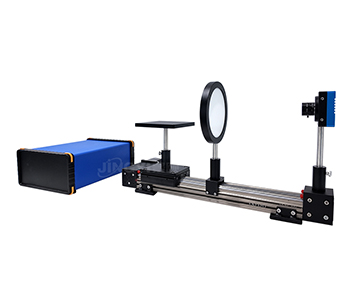
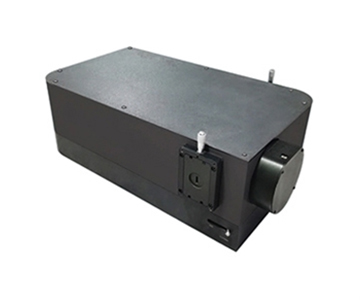
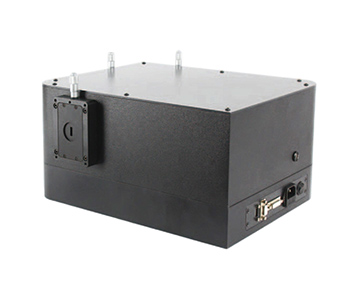
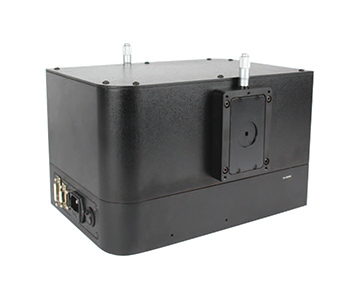
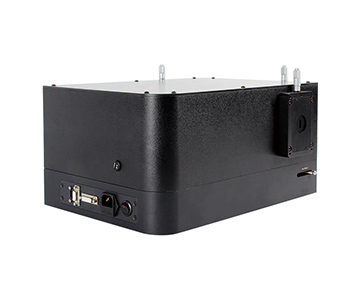
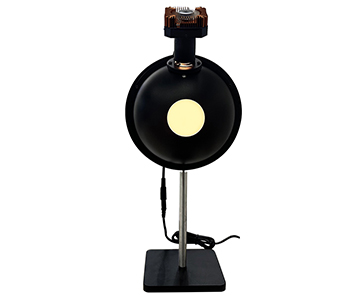
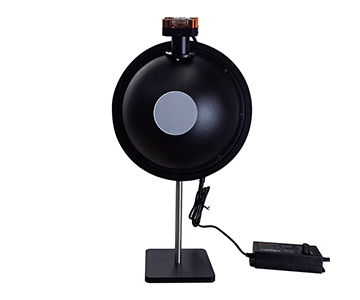
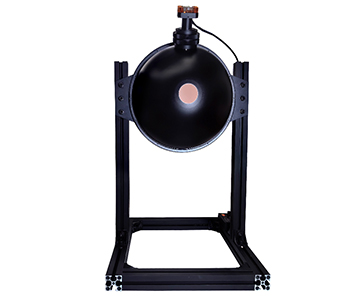
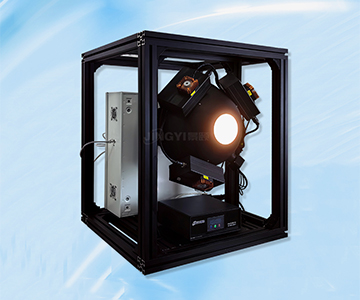
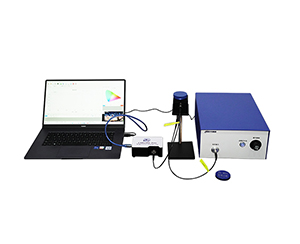
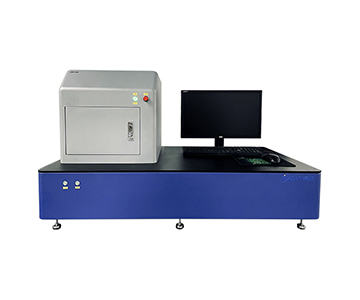
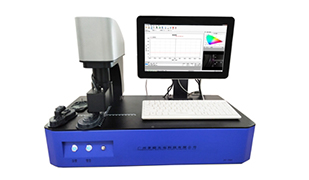
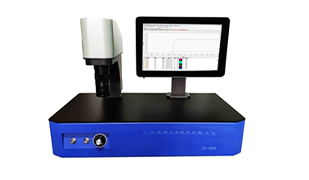
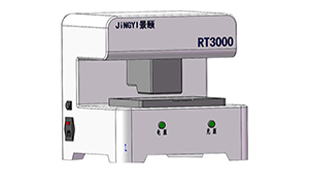
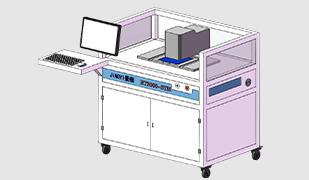
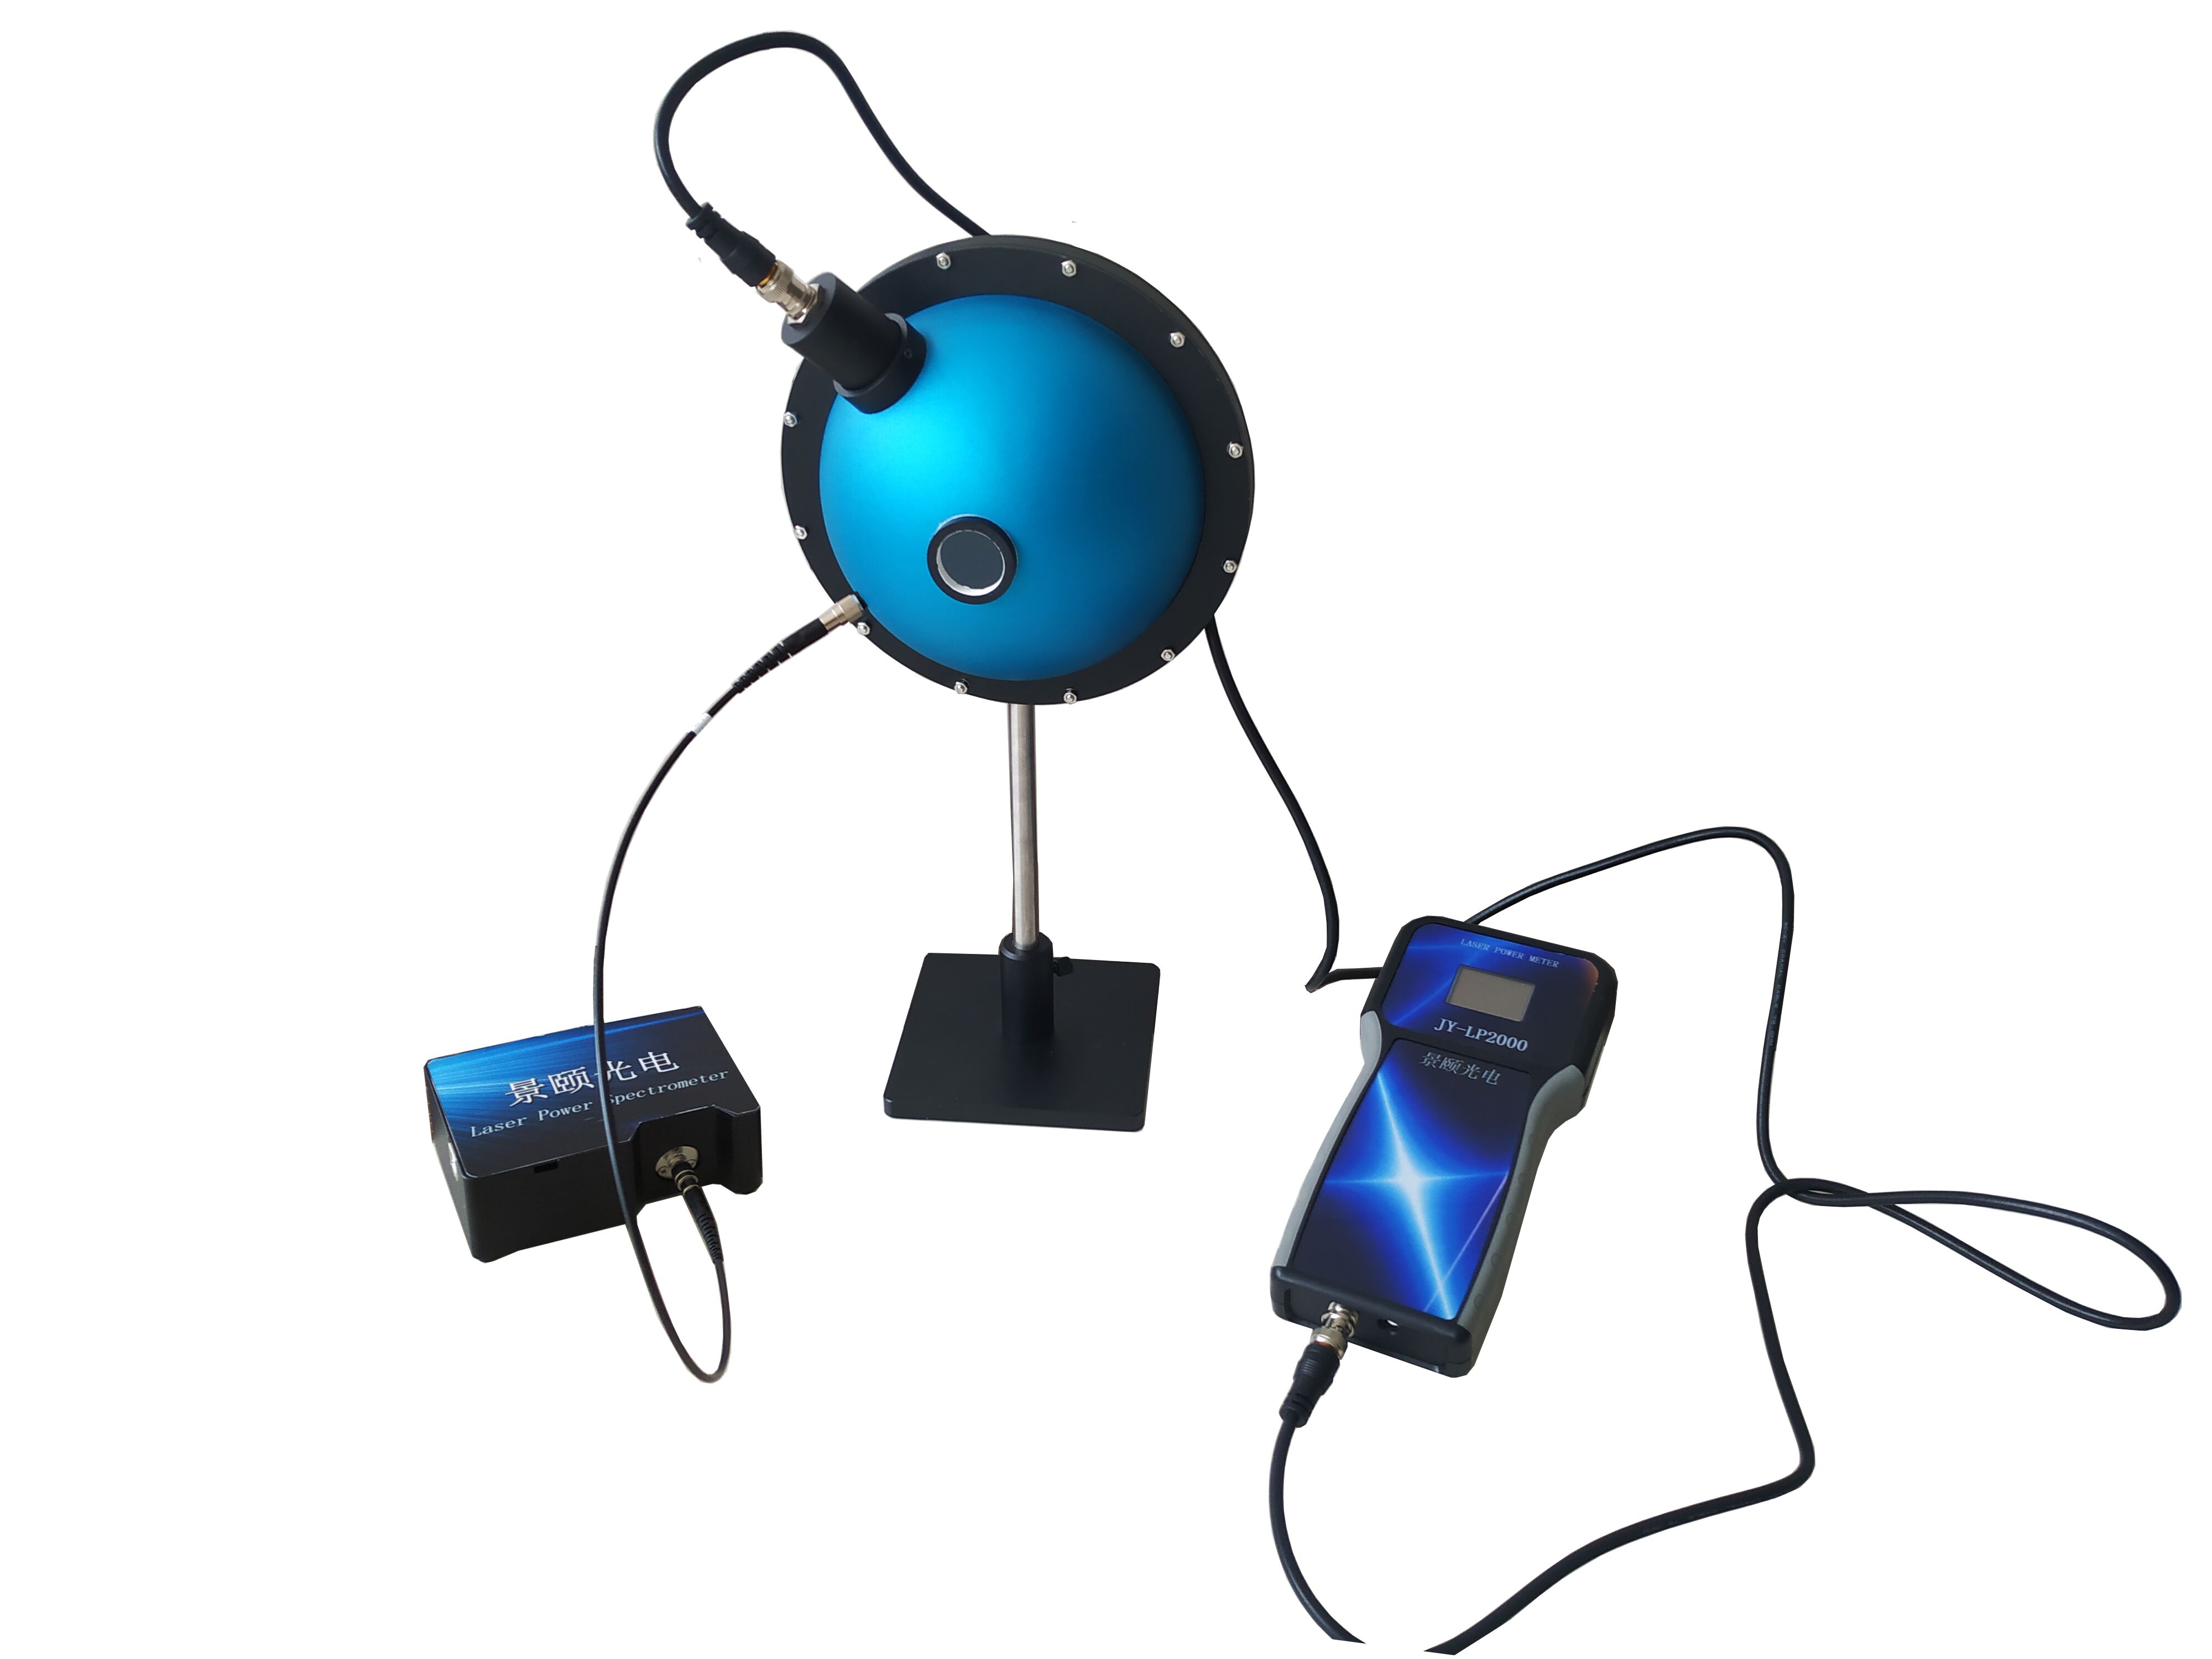
Online laser spot analysis fails in a quiet way. A beam profiler can image a 1064 nm spot cleanly, report plausible ellipticity, and still drift by 0.14 between two readings while the laser and optics stay untouched. That gap between seeing a beam and measuring the same beam twice is what inline monitoring buyers actually pay for. Across four production scenarios below, the evaluated large-format system was tested with fixed exposure, fixed gain, background subtraction, and 100-sample centroid/diameter statistics per run, following ISO 5725 repeatability practice.
Repeatability in inline laser beam analysis is the ability of a beam profiler to return the same centroid, diameter, and ellipticity for an unchanged beam under short-interval re-measurement. It is calculated as the standard deviation across at least 100 fixed-parameter samples, with the repeatability limit approximated as three standard deviations. In production environments, this metric predicts process consistency better than resolution alone, because sensor noise, mounting flatness, and auto-exposure compensation can all move the number without any real change in the laser.
Validation Methodology and Test Conditions
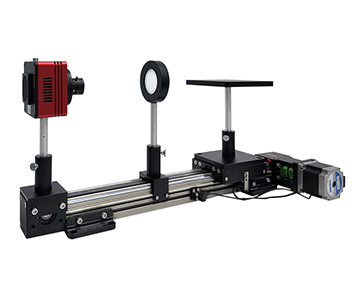
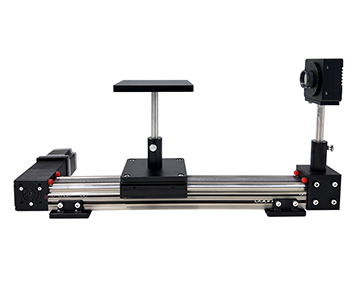
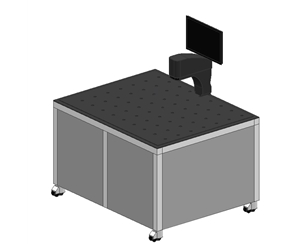
All runs shared one protocol so the four cases stay comparable. Samples were measured by the same operator on the same unit, at 23°C ±3°C and 20–95% RH non-condensing, with the isolation platform air pressure held between 0.35 and 0.4 MPa to keep low-frequency fab vibration out of the centroid reading.
•Statistical basis: Bessel-corrected standard deviation across n = 100 consecutive frames; repeatability limit ≈ 3s.
•Control state: auto-exposure and auto-gain disabled throughout; fixed integration time and fixed gain per case.
•Background: dark frames captured at the same integration time as bright frames, subtracted before moments are computed.
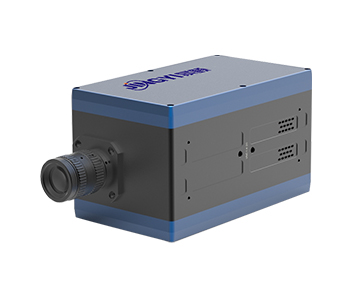
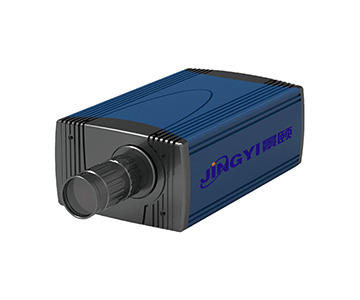
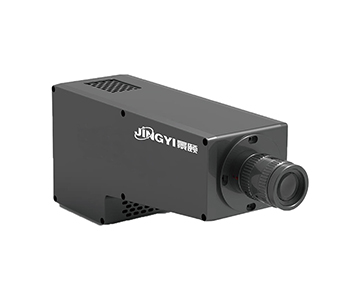
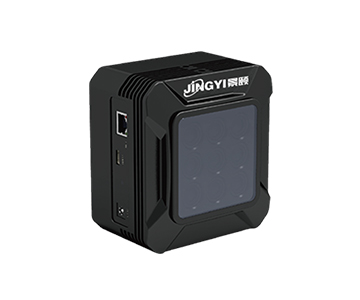
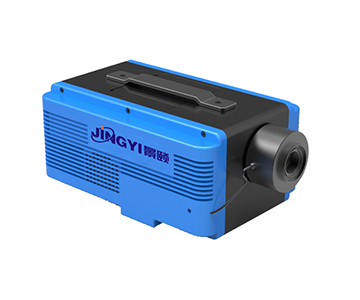
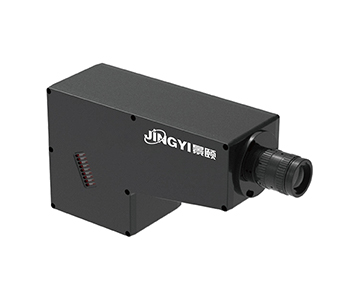
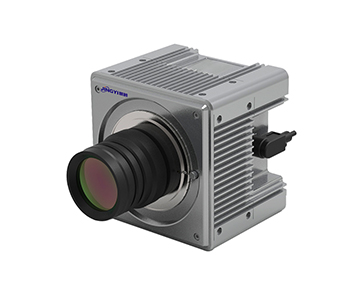
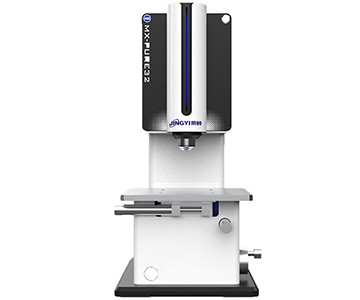
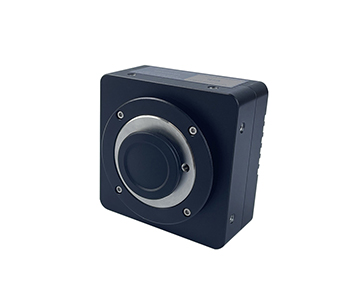
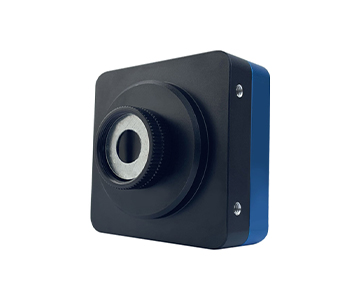
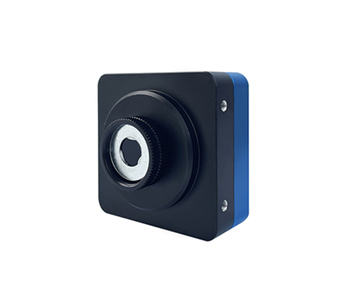
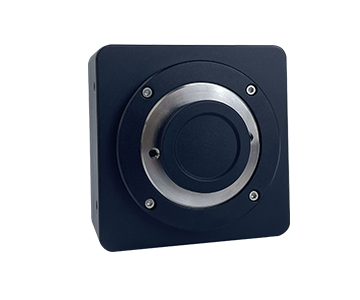
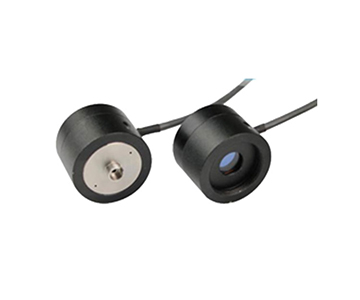
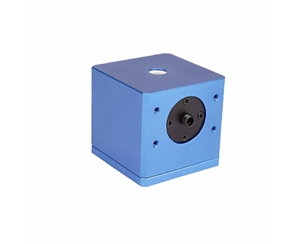
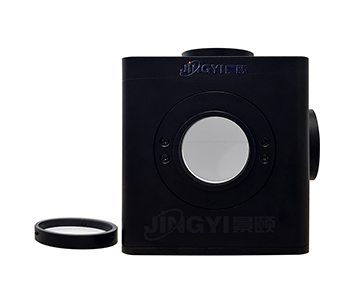
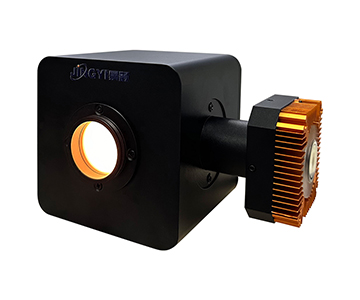
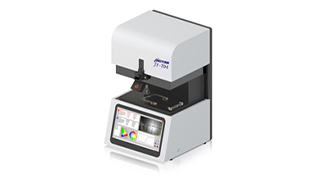
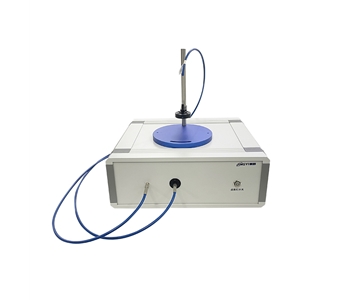
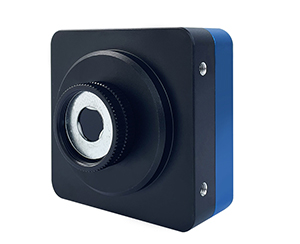
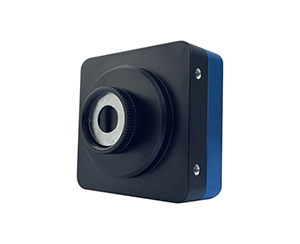
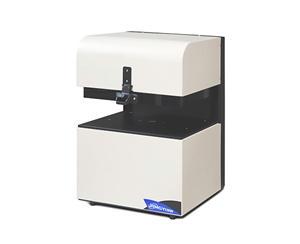
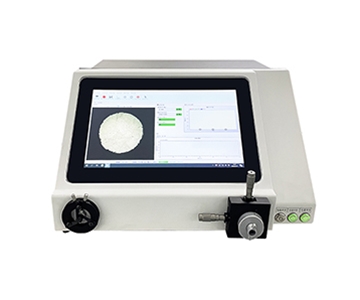
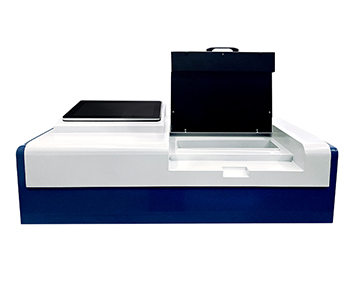
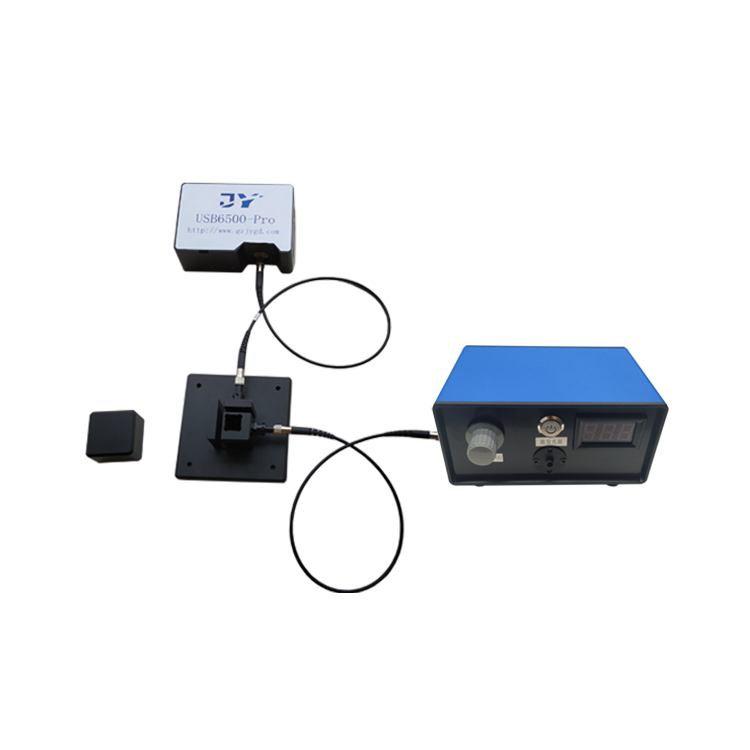
•Sensors compared: a 22.4 mm × 22.4 mm large-format head with 3.2 µm pixels at 23.3 fps, a 12.8 mm × 12.8 mm head with 2.5 µm pixels at 4.5 fps, an economic head with 5.86 µm pixels, and a long-wave infrared head with 17 µm pixels at 50 fps full frame. All heads are 12-bit.
•Traceability frame: measurements referenced to ISO 5725 repeatability definitions, with calibration logic aligned to ISO/IEC 17025 and NIST-traceable power references where applicable.
How Centroid Repeatability Behaves on Collimated Semiconductor Beams
A collimated beam at an optical coupling station should produce a tight centroid cluster. In practice, the cluster size depends far more on how the profiler is mounted than on the sensor itself.
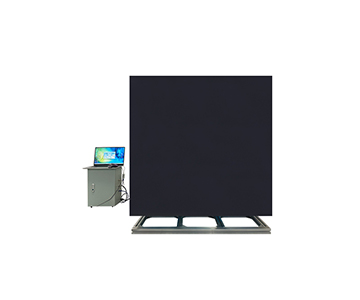
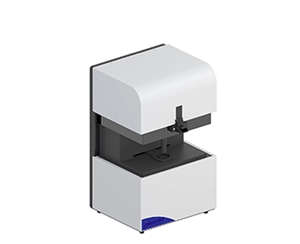
A process engineer at a 300 mm wafer fab needed inline monitoring at a coupling station with tight takt time. The team sampled the same continuous wave beam 100 times with the 22.4 mm head under fixed exposure and gain, then repeated the run after manually resetting the mount.
The undisturbed group converged tightly; the reset group spread measurably wider. With 3.2 µm pixels setting the centroid quantization floor and 23.3 fps supporting continuous capture, the detectable lower bound of 32 µm covered the pre-focus waist without clipping. The takeaway for buyers is blunt: if your centroid scatter jumps after a mount reset, the bottleneck is mechanical repeatability, not the detector.
Why Far-Field Spots Need a 22.4 mm Target
Far-field spots after coating inspection can reach well over ten millimetres. Truncating even the weak outer tail biases the second-moment width downward, and that bias is systematic, not random.
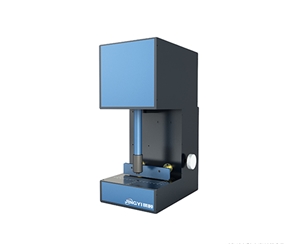
At an aerospace optics coating inspection station, the same far-field beam was captured on both the 22.4 mm head and the 12.8 mm head. On the smaller target, the beam edge was clipped; on the 22.4 mm × 22.4 mm active area, the full profile was retained up to the 22.4 mm measurable ceiling.
Clipping does not just shrink the reported diameter. It feeds a systematically low beam width into the second-moment algorithm, so repeatability looks fine while the absolute value is wrong. For far-field work, target size is a correctness issue before it is a repeatability issue.
Medical Laser Spot Checks at the Hundred-Micron Scale
Small spots do not need the largest target. They need enough pixels across the spot and a frame rate that keeps up with the scan.
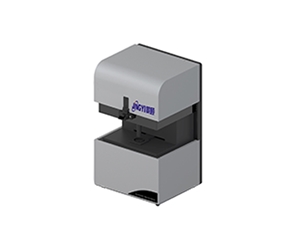
A medical device line verifying laser treatment heads ran hundred-micron spots through the economic head with 5.86 µm pixels, fixed gain, and 41 fps capture, logging relative power and centroid over consecutive samples. The pixel pitch delivered adequate sampling across the spot, and the higher frame rate tracked dynamic scans more smoothly than the large-format head.
The economic tier is not a compromise here. Its limits show up on large spots and UV response, not on sub-millimetre beams. Selection should follow spot scale first, price tier second.
Line-Beam Uniformity in Display Panel Annealing
Line beams break the assumption that a narrow sensor is enough. The long axis needs room, and the short axis needs resolution.
At a display panel line-beam annealing station, the 22.4 mm head captured 2D pseudo-color profiles at 7008 × 7000 effective resolution with 3.2 µm pixels, and multiple row-wise cross-sections along the long axis were compared across scans. At 23.3 fps, transient profile shifts during scanning were captured rather than averaged away.
A square large-format target accommodates the full line envelope better than a narrow strip sensor, so repeated sampling stays consistent along both axes. For line optics, target aspect ratio matters as much as pixel pitch.
Head-to-Head Configuration Comparison
The table below summarizes where the mainstream large-format tier, the economic tier, and a typical imported high-end reference diverge on the parameters that drive inline repeatability.
| Dimension |
Imported high-end reference |
Mainstream large-format tier |
Economic tier |
| Sensor / pixel |
Vendor-specific |
22.4 mm target / 3.2 µm |
9.8 × 6.6 mm / 3.4 µm |
| Measurable spot |
Vendor-specific |
32 µm–22.4 mm |
34.5 µm–6.6 mm |
| Frame rate |
Vendor-specific |
23.3 fps |
24.2 fps |
| Interface |
Vendor-specific |
Ethernet |
Gigabit Ethernet |
| Environment |
Lab-temp friendly |
0–50°C, IP40 |
−30–60°C, IP40 |
| Service response |
Cross-border lead time |
Domestic response |
Domestic response |
Reading the numbers plainly: the large-format tier spans roughly a 700× dynamic range from 32 µm to 22.4 mm, while the economic tier covers about 191× from 34.5 µm to 6.6 mm. The economic head also runs slightly faster at 24.2 fps versus 23.3 fps, which kills the assumption that a higher price tier always means a faster camera. The honest weakness sits in cross-shift thermal behaviour: under 23°C ±3°C swing, visible-band centroid drift on the evaluated system widened to 7–8 µm, while imported high-end units typically held under 3 µm. Sub-micron alignment work still needs a thermal enclosure.
Field Feedback from an Accredited Metrology Lab
An engineer at a provincial metrology institute, speaking under authorized disclosure, connected the large-format head into their comparison bench and reported fast convergence on short-interval repeatability with straightforward report export. After two consecutive shifts and one plant HVAC cycle, the centroid baseline shifted by several micrometres and a fresh dark-frame capture was required.
His summary was unglamorous: daytime data looked clean, night shift needed a second look. That comment captures the real structure of repeatability. It is a property of the instrument plus the environment plus the operating protocol, not of the instrument alone. Buyers who run acceptance tests with auto-exposure enabled will see flatter curves than the line actually produces, which hides the drift instead of exposing it.
Error Sources Worth Chasing Before Blaming the Sensor
When the same beam measures inconsistently, work through these five items in order.
1.Capture dark frames at the same integration time as bright frames. Once background grey-level standard deviation exceeds 5% of the signal mean, measurement uncertainty grows quickly.
2.Set attenuators so peak grey level lands between 60% and 80% of full well capacity. Eyeballing “not saturated” is a qualitative substitute for a quantitative criterion.
3.Size the region of interest until intensity falls below 1% of peak. Shrinking the window to lift signal-to-noise truncates edge energy and drags waist and divergence angle with it.
4.Disable auto-exposure and auto-gain during repeatability validation. Run at least 100 fixed-parameter samples before computing standard deviation.
5.For automotive lidar beam parameter work, confirm conformity to ISO 26056-series lidar test practice and maintain a documented NIST-traceable calibration chain, since the original Chinese industry code T/CITS 231-2025 does not translate directly into an international procurement requirement.
Where This Configuration Fits, and Where It Does Not
Large-format targets from emerging metrology suppliers are now viable for routine production repeatability, with two boundaries worth stating plainly.
Cross-shift thermal drift remains weaker than imported high-end heads. Sub-micron alignment tasks need a thermal enclosure or a temperature-controlled room, not just a better sensor. Edge-uniformity correction over the outer 5% of the large target is not yet fully automated, so absolute dimension measurements may need manual intervention; relative power and ellipticity, being ratio-based, are less affected.
If the line runs in a temperature-stable lab with a fixed mount, the large-format tier offers strong cost-to-performance. If it runs 24 hours in a plant with wide thermal swing, budget for environmental control and scheduled recalibration alongside the instrument price, not instead of it.
Frequently Asked Questions
Why does the same beam show drifting diameter across ten reads?
Usually it is not the sensor. Check whether auto-exposure or auto-gain is compensating between frames, whether dark frames were captured at the same integration time, and whether the region of interest clips edge intensity below 1% of peak. Only after those three are clean should the detector be suspect.
How should I choose between a large target and a small target?
Choose by maximum spot size, not by tier. Far-field spots reaching ten-plus millimetres need the 22.4 mm target. Hundred-micron spots near focus are better served by the economic head, which has finer effective sampling and a higher frame rate.
Can a standard CMOS profiler measure infrared beams?
No. Long-wave infrared in the 8–14 µm band requires an uncooled vanadium oxide detector, and near-infrared from 400–1700 nm requires an InGaAs sensor. A silicon CMOS head pointed at the wrong band produces numbers, but they mean nothing.
Where does the cost gap between imported and
It comes from unit price, cross-border service lead time, and spare-part waiting.
How can I independently verify whether a beam profiler suits my production line?
Ask for raw frame data rather than a report screenshot. Run 100 measurements at fixed exposure and gain, then compute standard deviation yourself. Confirm pixel equivalence with a known-pitch calibration target and verify power linearity with a stabilized source. Only proceed to procurement when both checks pass.
About This Guide
Data Sources
: In-house validation reports (n = 100 samples per case, four production scenarios), ISO 5725 repeatability definitions, GB/T 32831-2016 high-energy laser beam quality test methods, and published supplier specifications.
Author
: Cai Xiaodong, Senior Application Engineer, Jingyi Optoelectronics, 12 years in industrial optical metrology.
Disclosure
: Jingyi Optoelectronics manufactures beam quality analyzers and optical test instruments. This article presents technical assessments based on published specifications and aggregated industry data. No compensation was received from third-party brands mentioned.
Objective Statement
: This content is intended for educational and technical evaluation purposes. Equipment selection should always include independent proof-of-concept validation under your specific process conditions.
Last Updated
: November 2026
For detailed specifications and application notes on beam quality analyzers, search "Jingyi Optoelectronics beam quality analyzer" or visit our technical library.