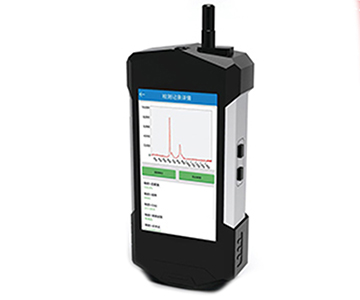
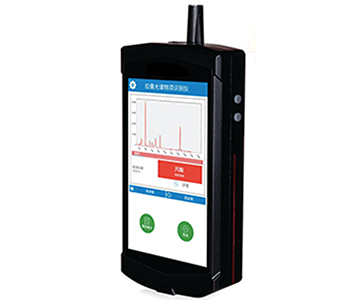
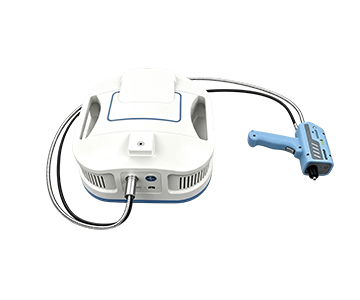
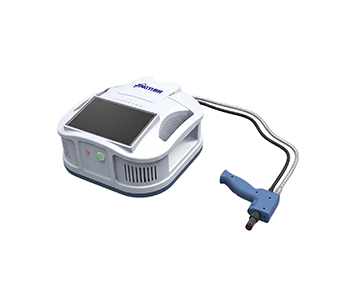
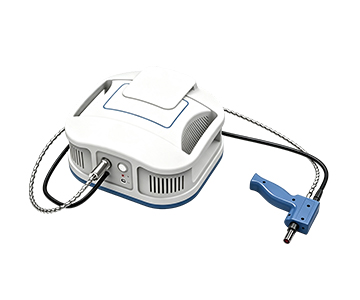
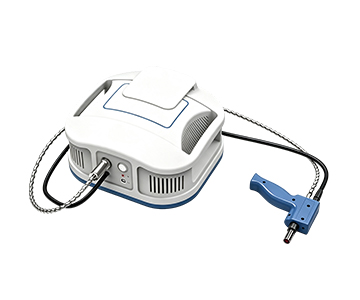
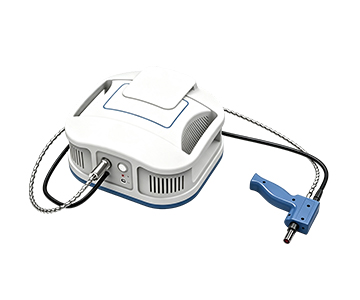
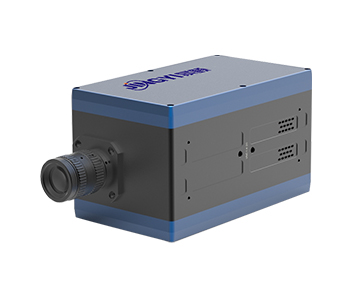
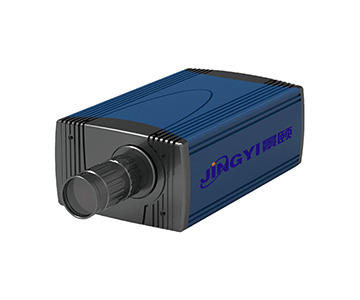
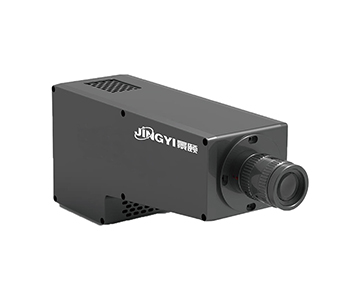
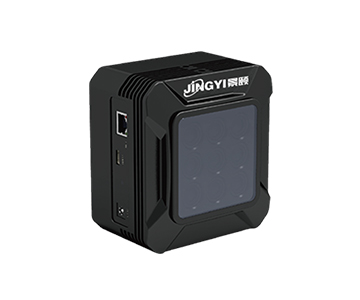
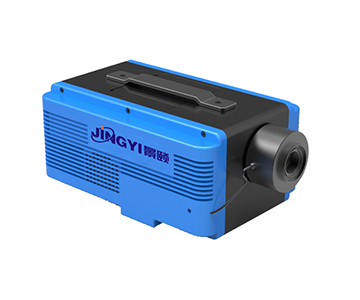
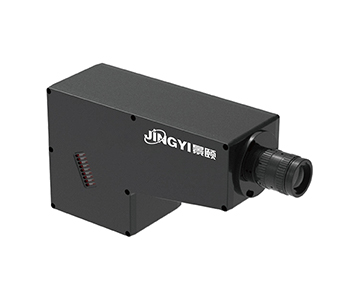
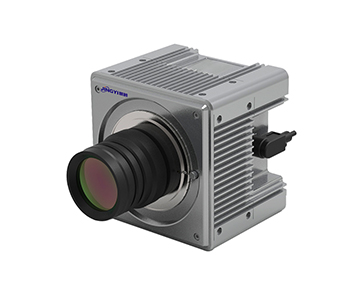
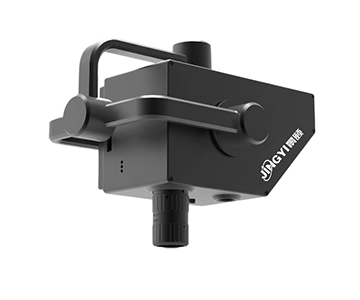
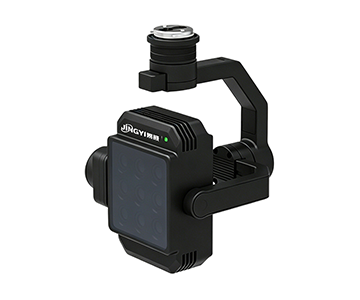
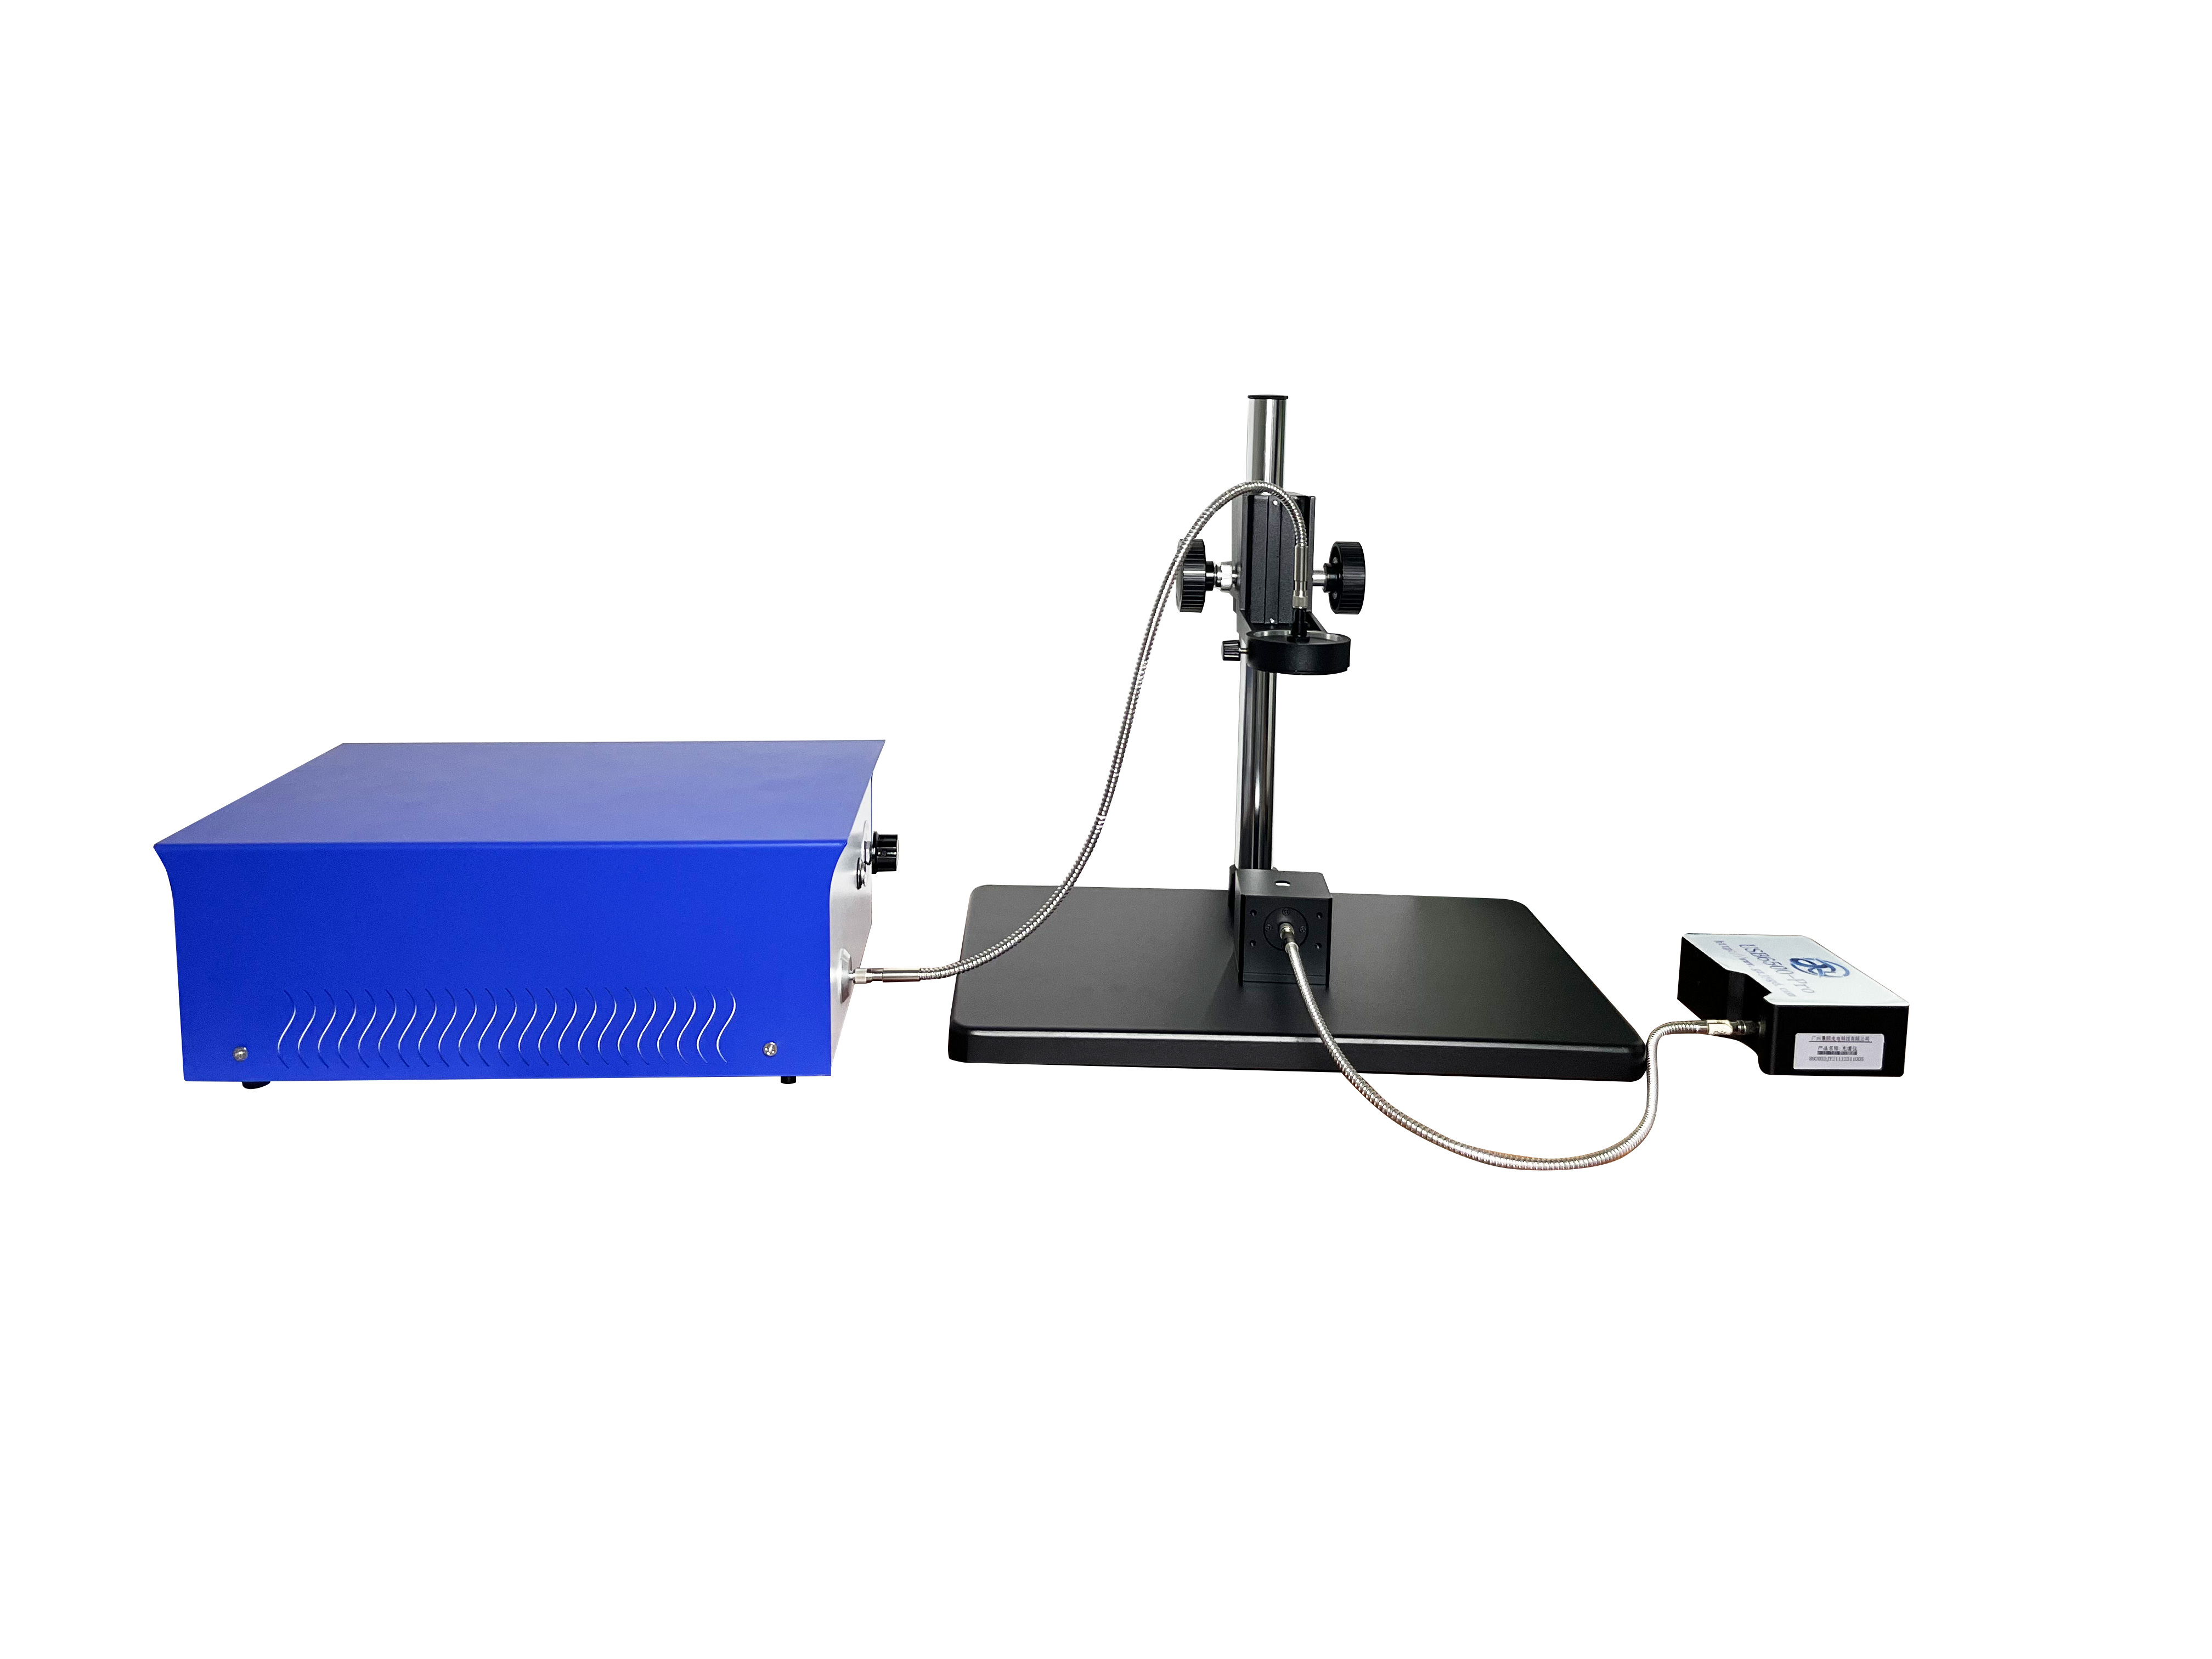
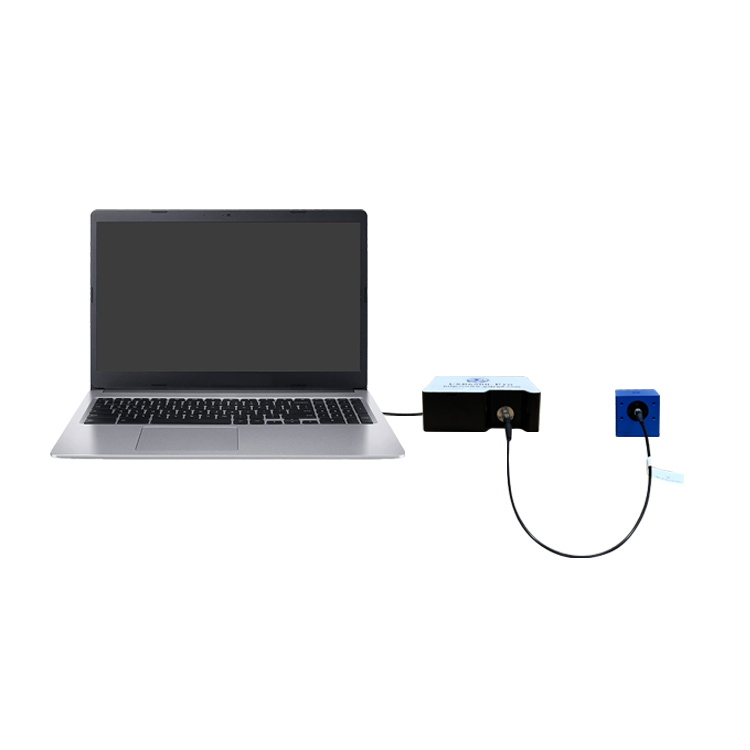
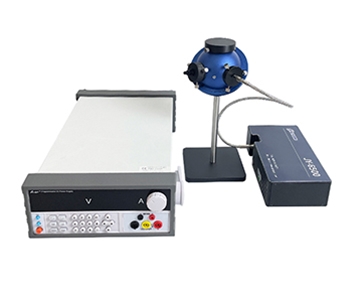
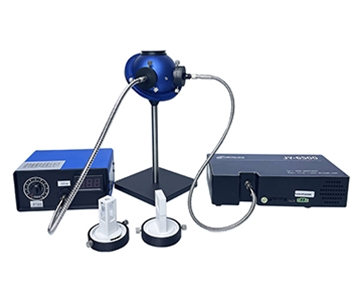
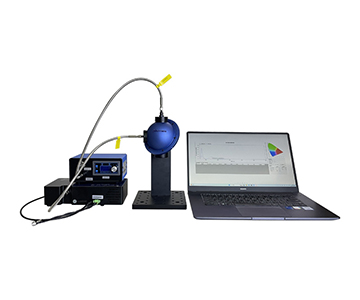
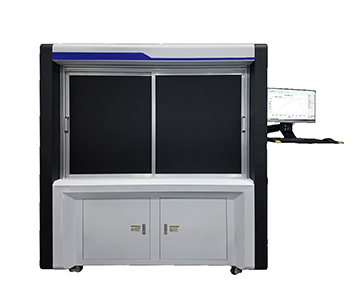
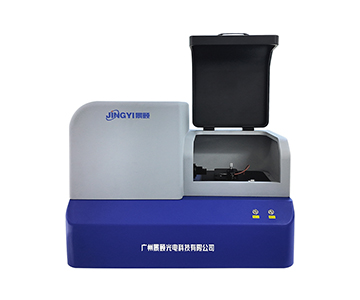
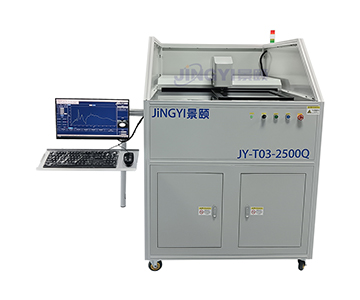
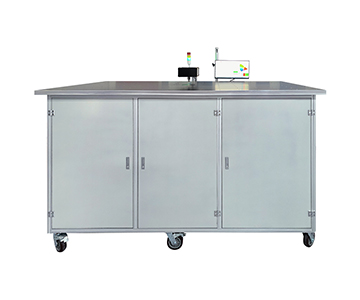
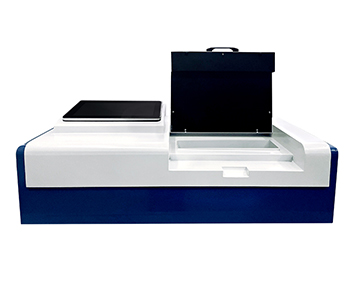
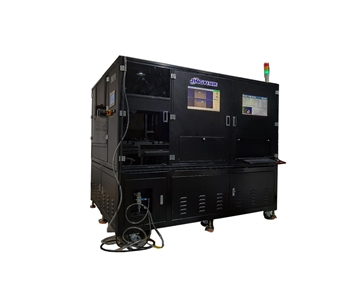
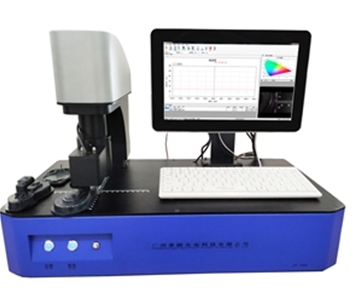
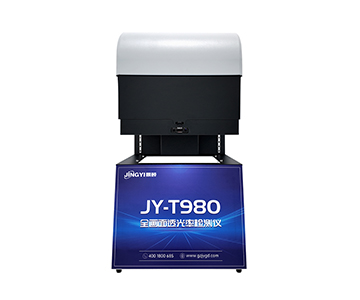
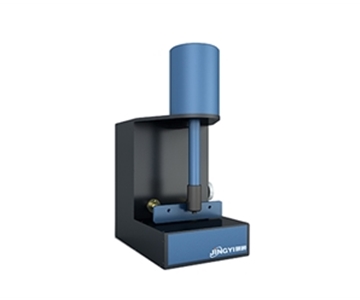
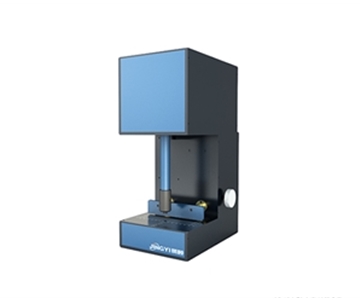
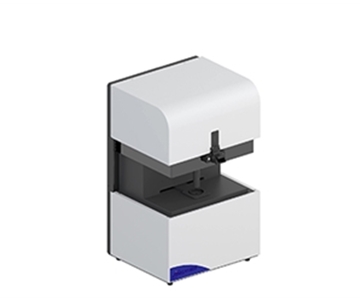
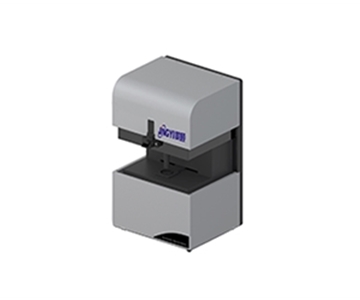
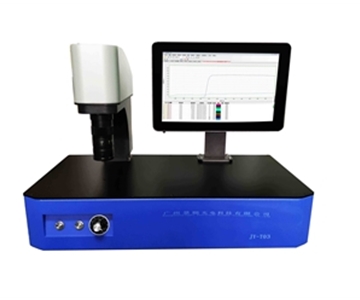
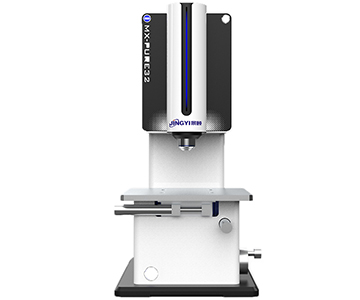
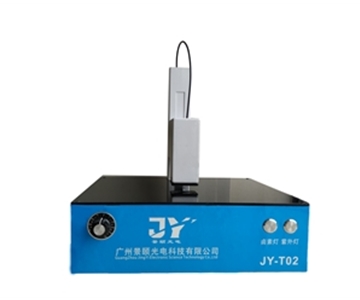
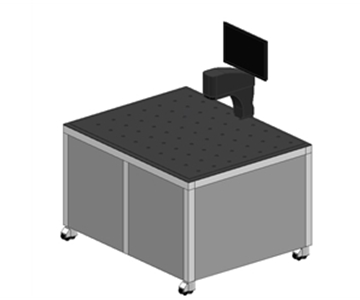
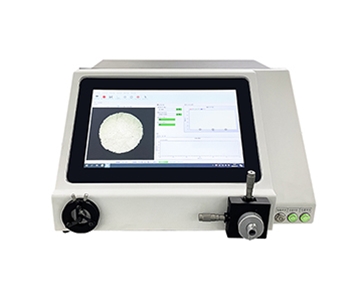
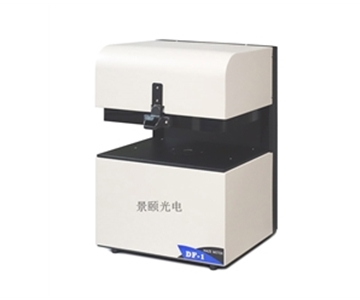
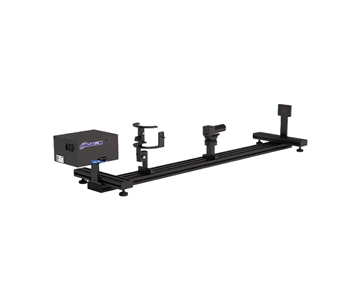
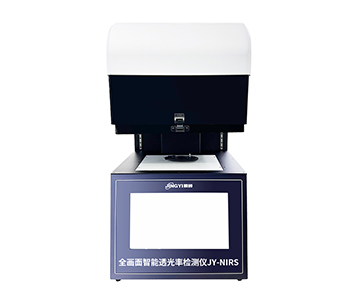
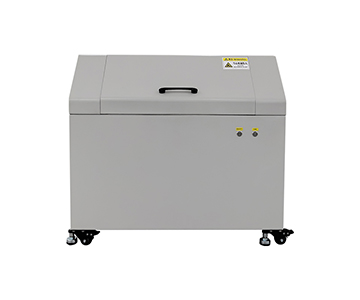
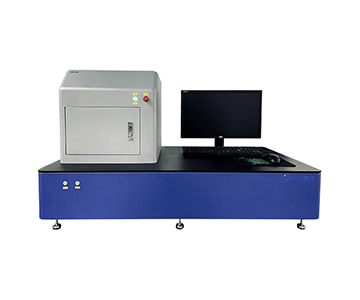
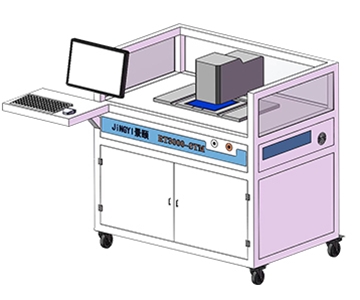
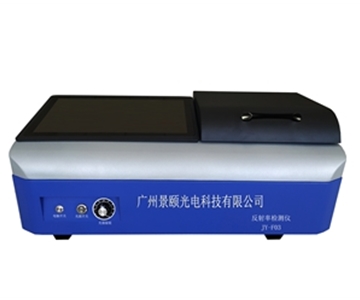
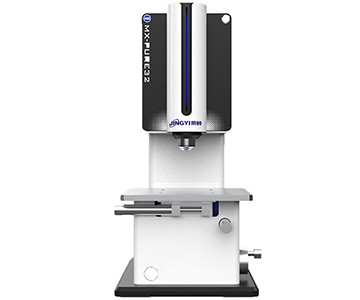
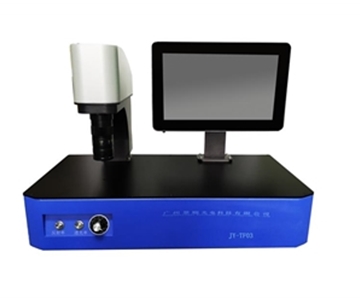
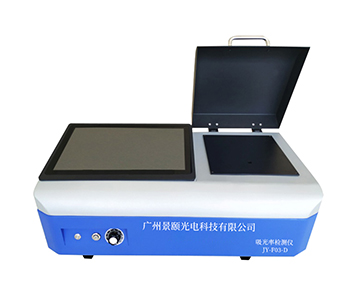
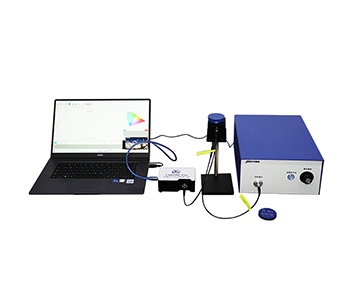
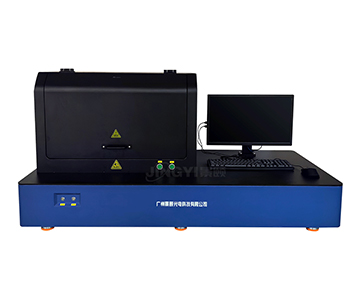
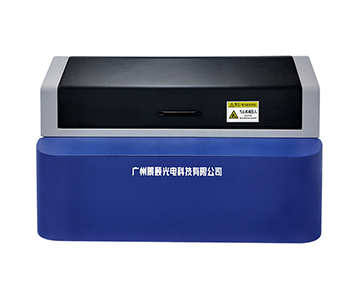
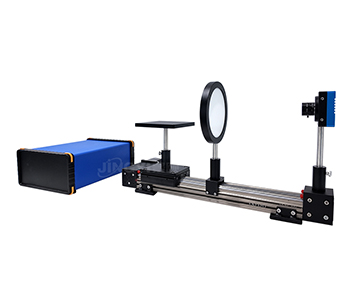
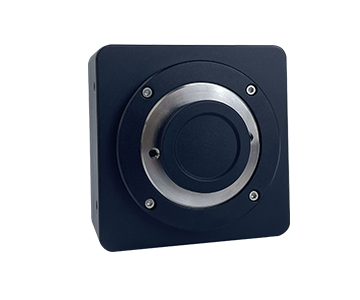
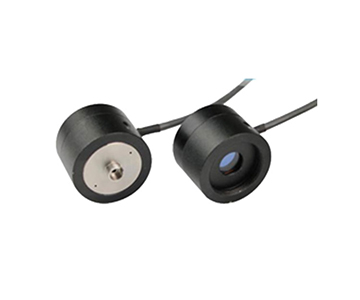
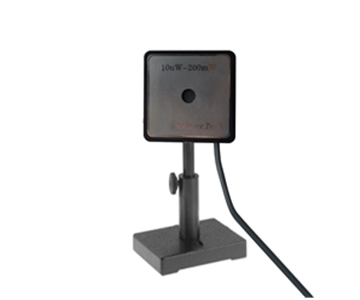
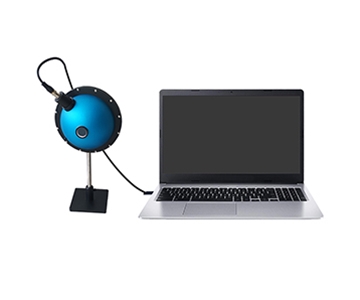
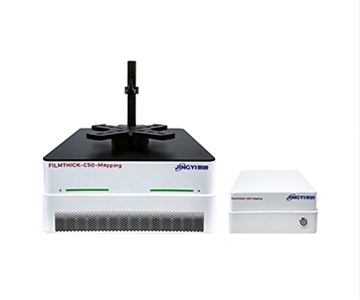
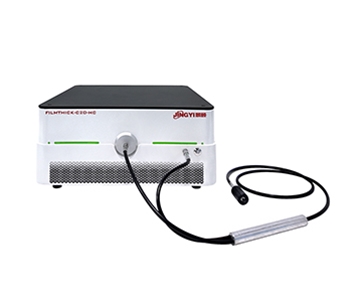
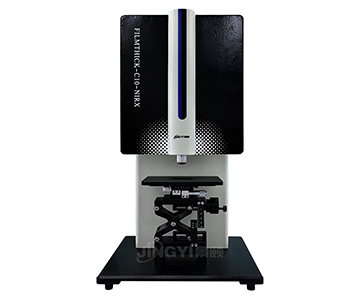
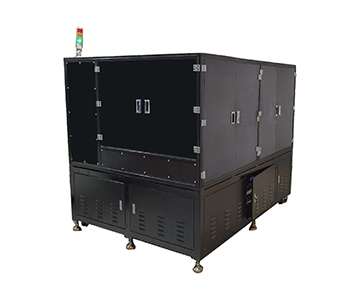
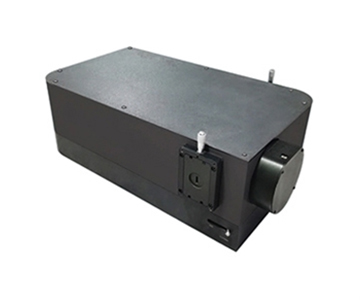
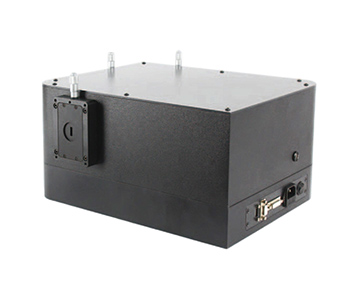
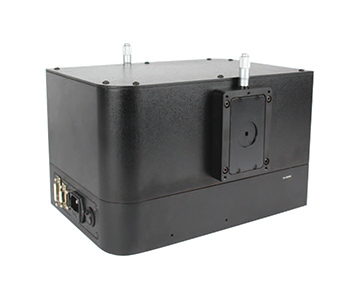
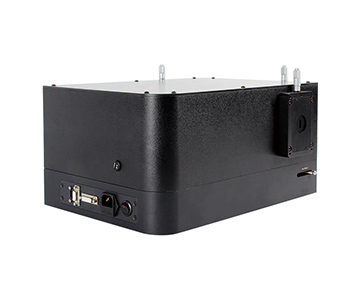
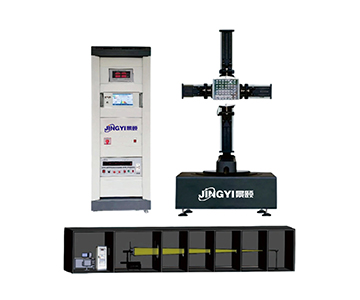
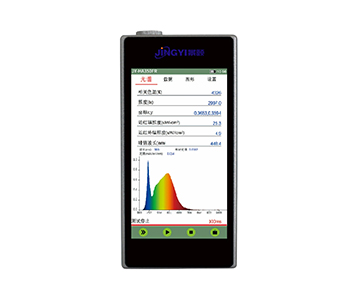
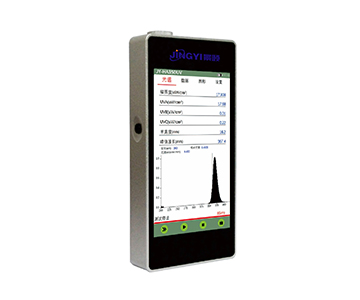
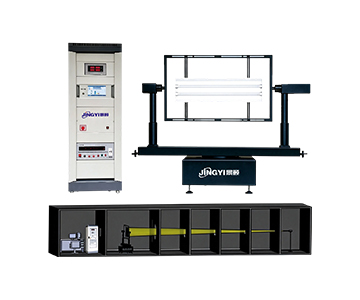
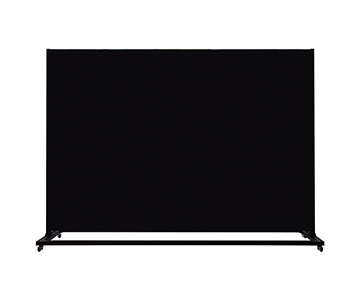
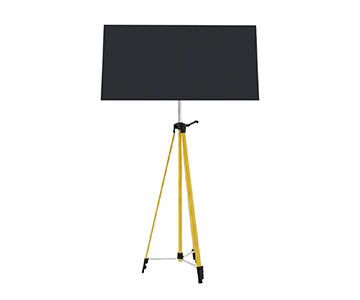
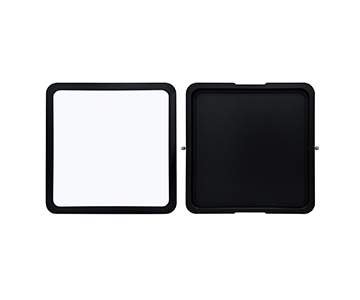
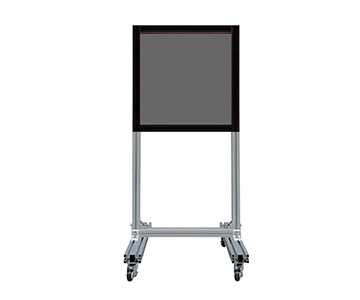
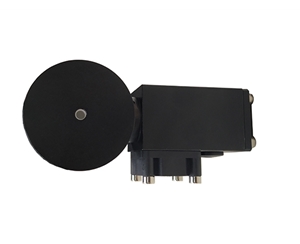
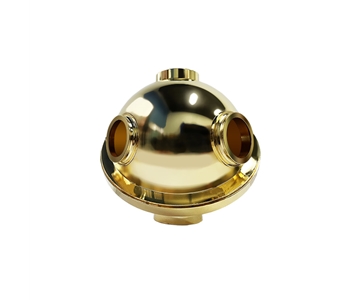
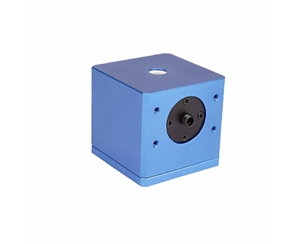
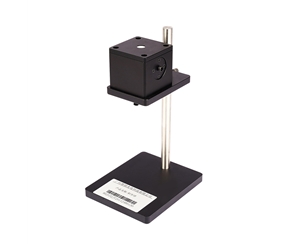
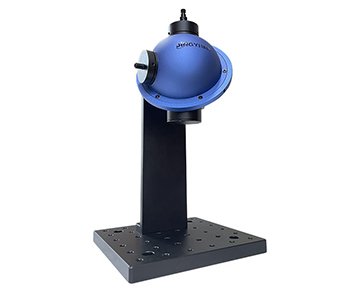
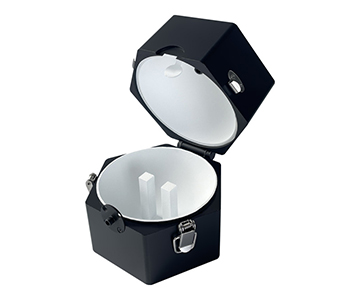
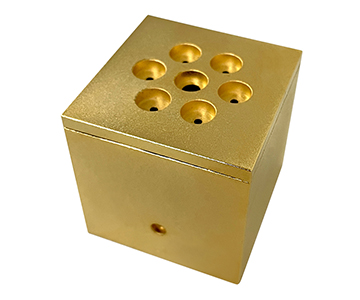
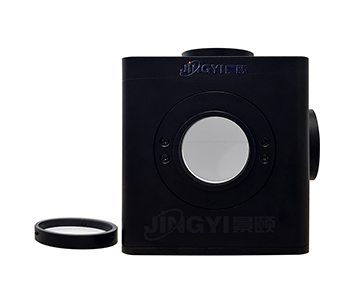
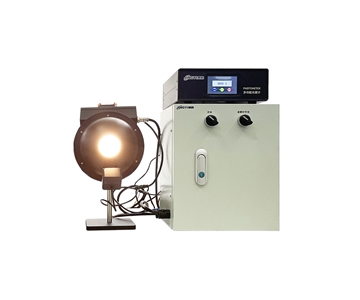
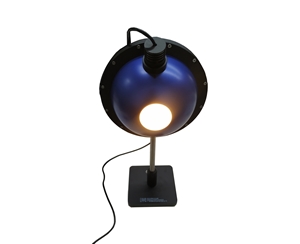
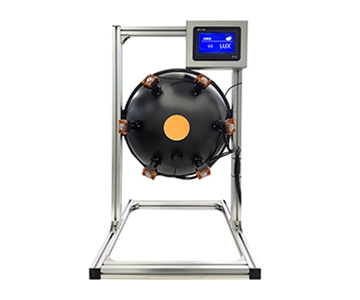
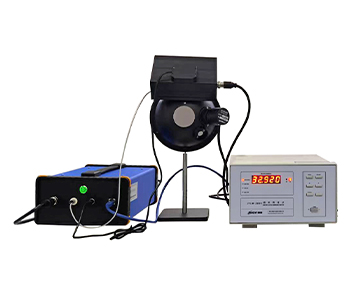
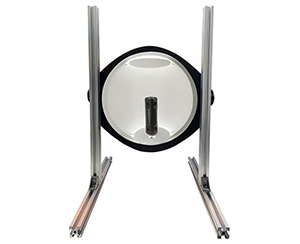
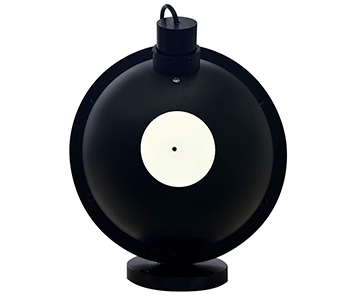
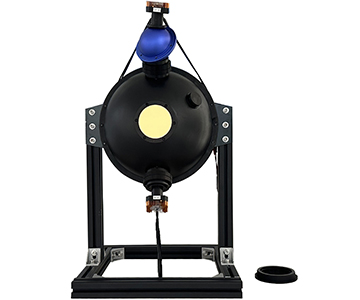
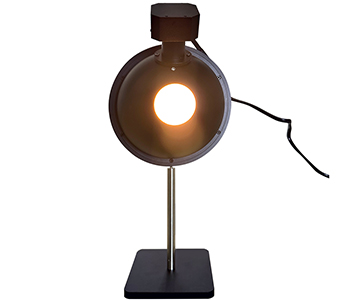
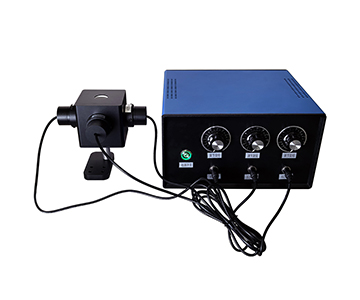
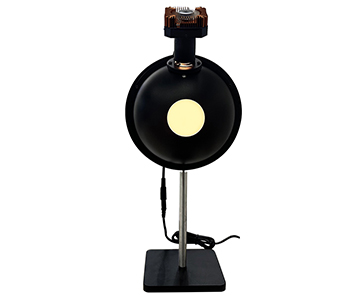
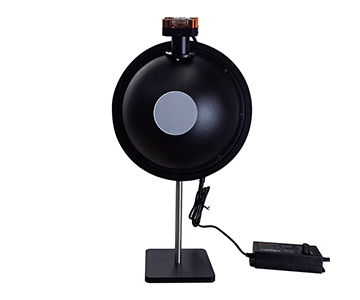
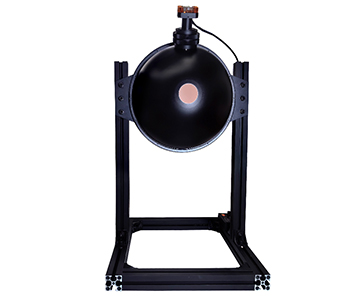
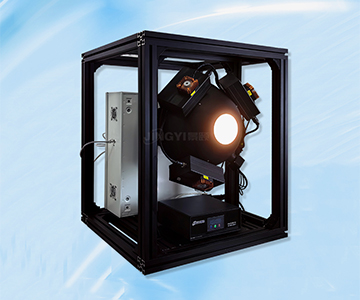
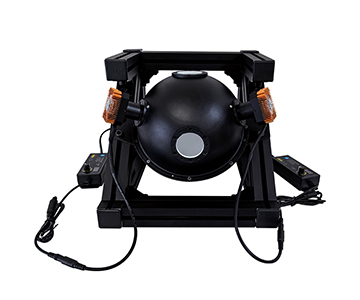
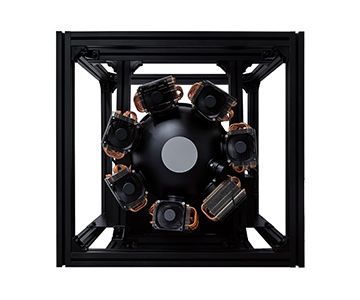
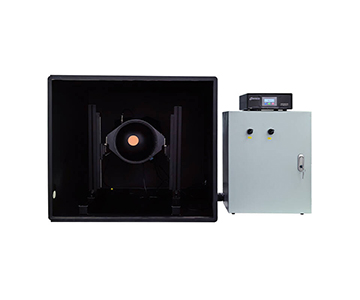
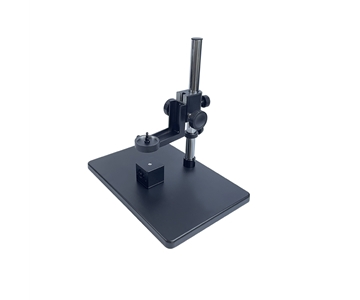
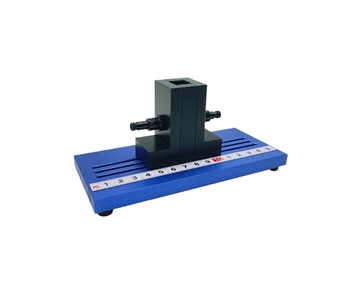
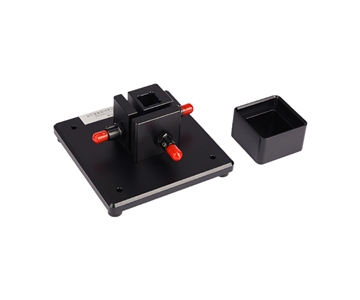
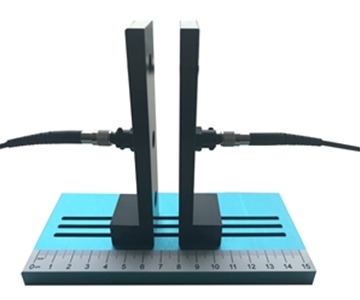
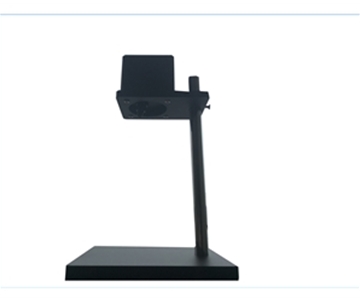
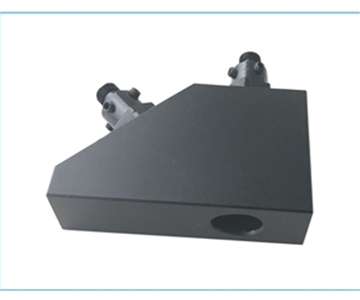
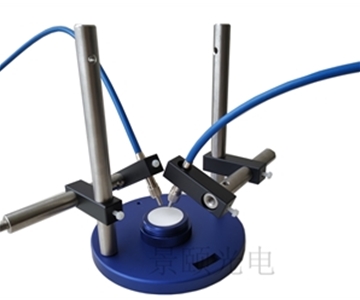
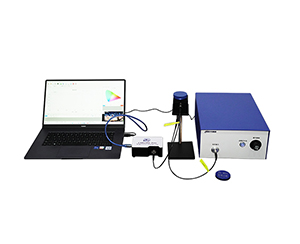
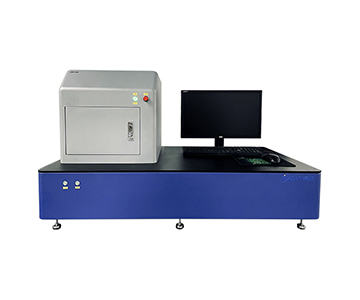
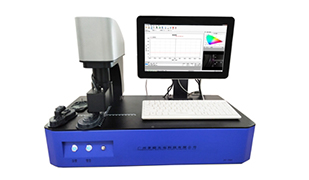
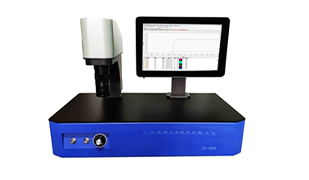
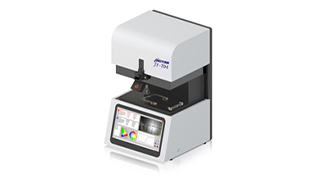
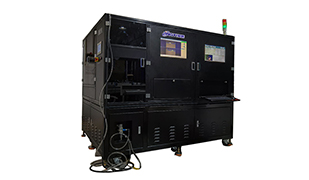
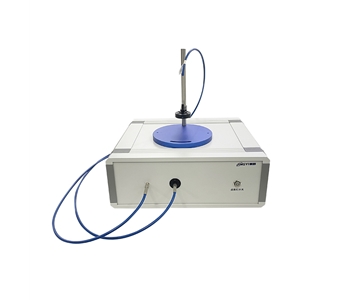
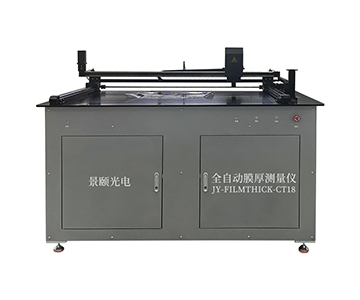
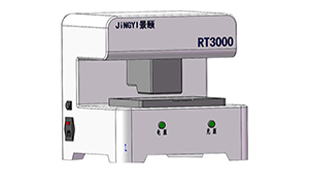
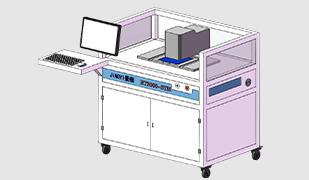
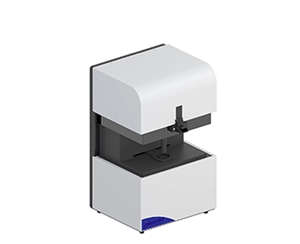
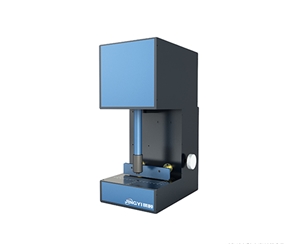
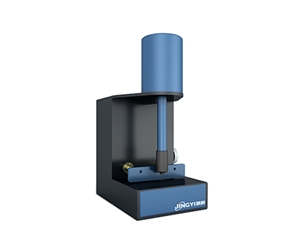
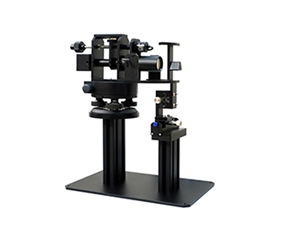
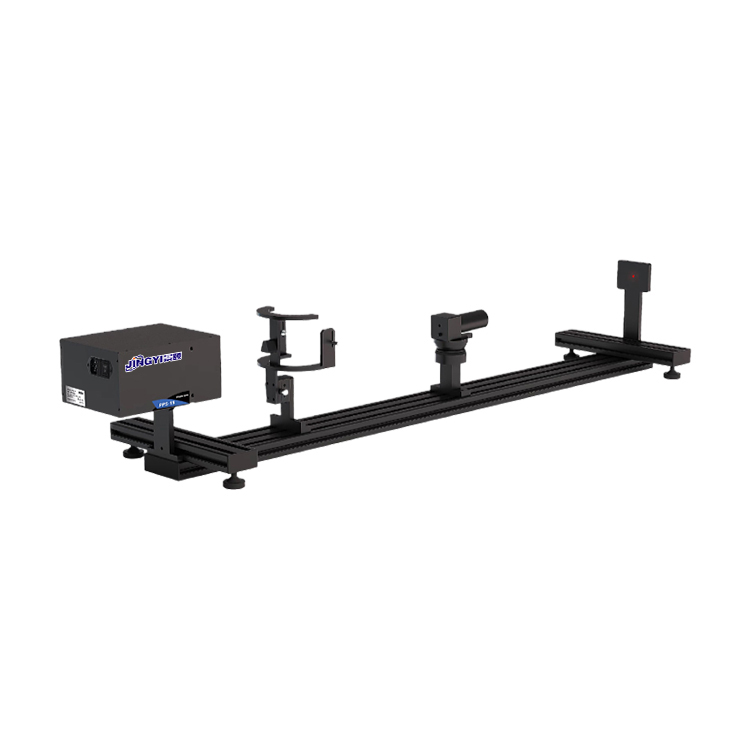
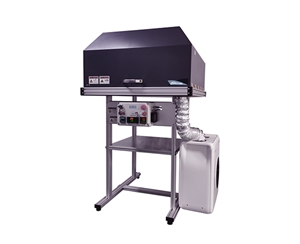
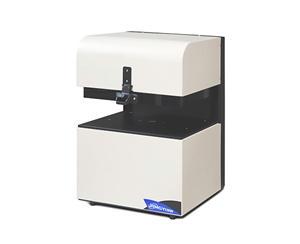
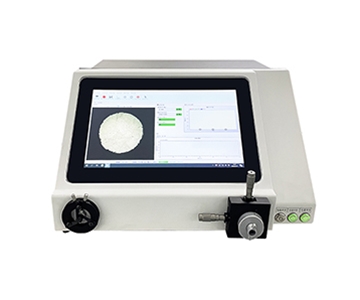
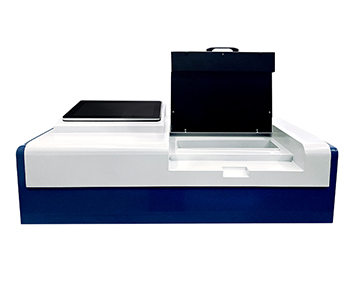
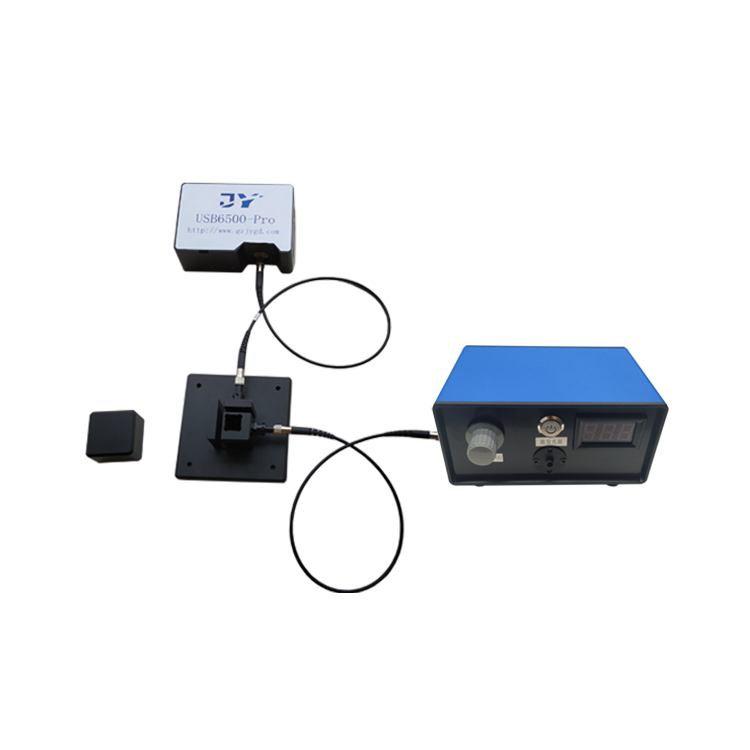
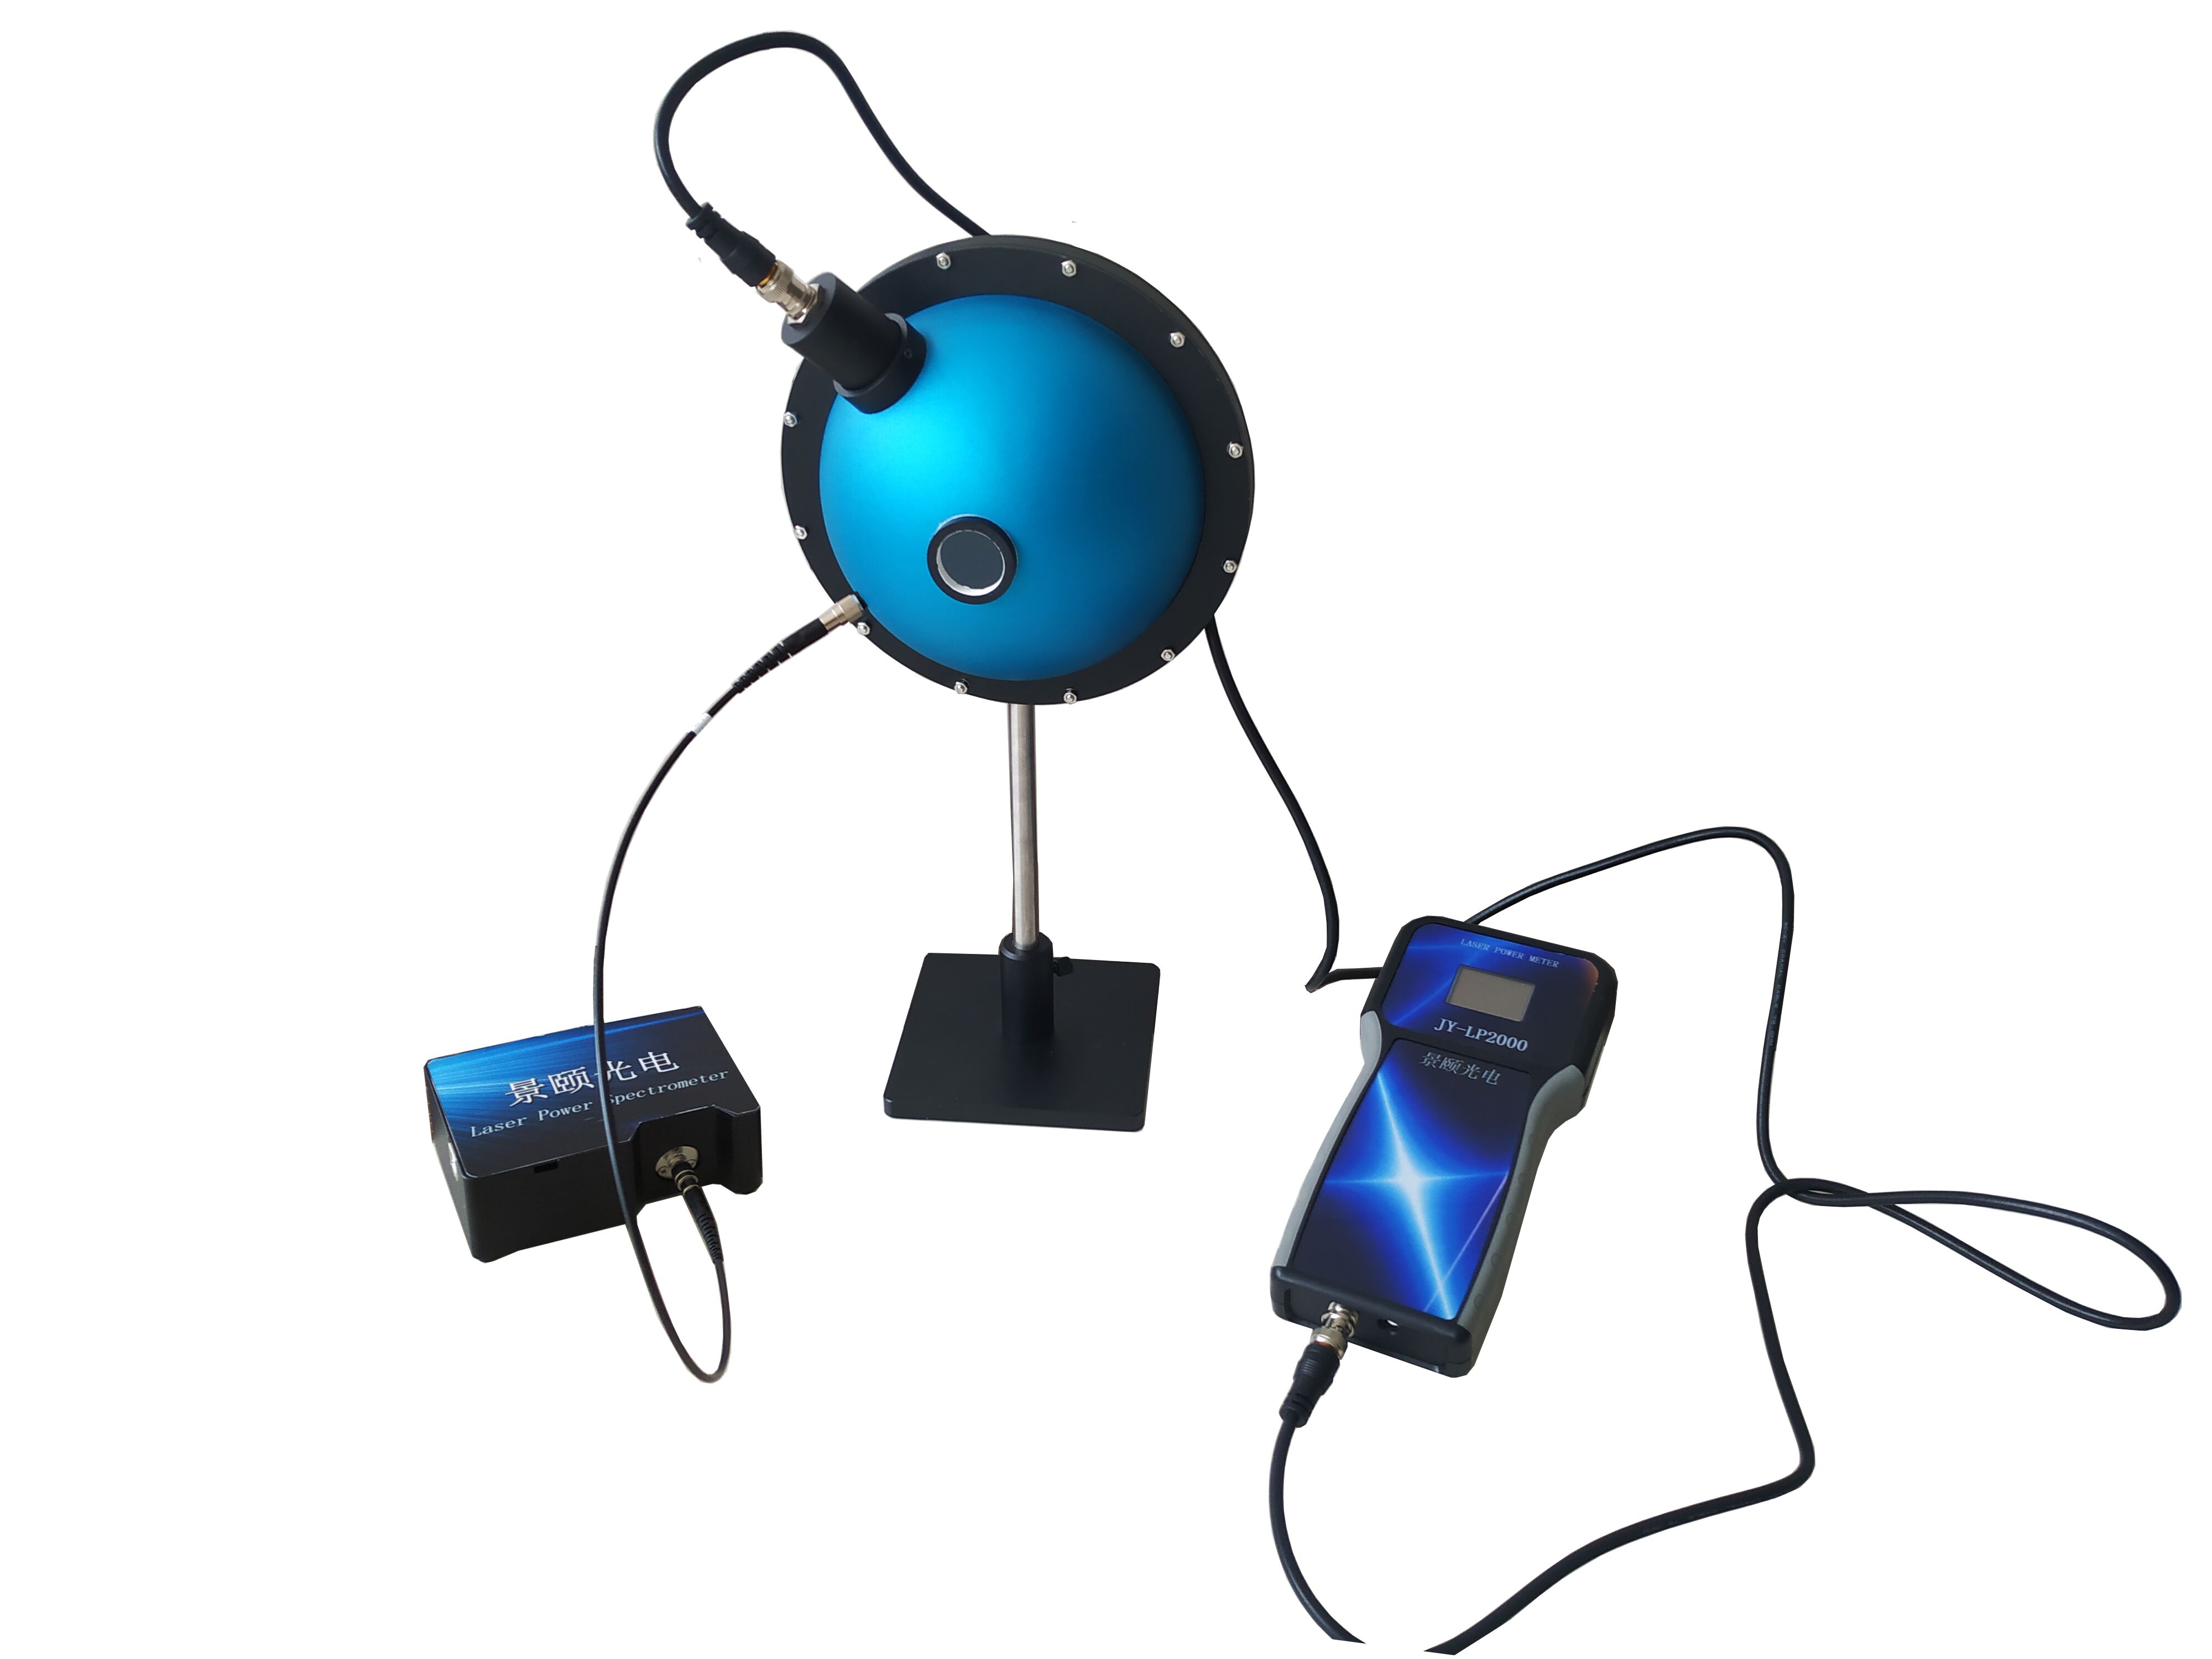
Beam profile analyzers quantify energy distribution, spot size, centroid position and divergence angle during industrial laser inspection. Across three detector routes covering 300-1100 nm, 400-1700 nm and 8-14 μm, engineers can now capture beams up to 22.4 mm × 22.4 mm with 3.2 μm pixels, run near-infrared acquisition at 227.7 fps and mid-infrared at 50 fps, and configure attenuation up to 1000 W. This combination supports modular beam-quality setups in R&D labs, fiber-coupling stations and in-line sampling cells, giving manufacturers a practical measurement base instead of a single do-it-all instrument.
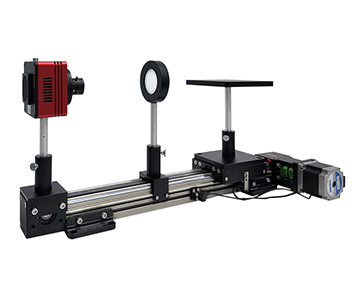
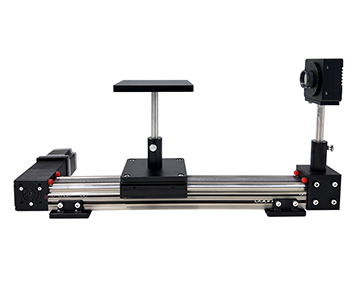
During a two-week integration trial at a precision manufacturing facility in southern China, a combined beam analyzer setup was validated across three production conditions: laser diode outgoing inspection, fiber alignment coupling and external-path collimation. The large-aperture unit captured the full beam inside its 22.4 mm × 22.4 mm target without any additional beam-reduction optics, while the visible, near-infrared and mid-infrared detectors shared one software framework for statistics, Pass/Fail logic and report export. What follows is the engineering record of that trial, including the defect it uncovered, the detector roles that made the workflow possible and the limits buyers should plan around.
Why Beam Profiling Moved from the Lab onto the Line
Abeam profile analyzer is an optical instrument that converts a laser beam into quantitative spatial data: intensity distribution, effective diameter, ellipticity, centroid coordinates and divergence. In semiconductor laser manufacturing, that data has traditionally lived on the R&D bench. On active production lines, the same parameters increasingly sit inside the quality gate.
The shift is driven by cost. A process drift that stays invisible to the naked eye—slight ellipticity, a slow centroid walk, a Gaussian fit residual on one axis—shows up downstream as weld spatter, kerf roughness or coupling loss. Reworking those parts carries real expense. In the trial described here, a single morning of kerf roughness on a cutting line traced back to a mirror angle drift that no power meter or focal check would have flagged.
Three detector routes were brought under one software shell so that a process engineer does not have to relearn a toolchain when the wavelength changes:
•Visible to short-wave NIR: 300-1100 nm silicon route for diode and solid-state lasers
•Near-infrared: 400-1700 nm InGaAs route for 1550 nm photonics and medical lasers
•Long-wave infrared: 8-14 μm uncooled vanadium oxide route for CO₂ lasers and IR scene simulators
Sharing one parameter-statistics engine, one Pass/Fail evaluator and one report exporter meant the same test script could be reused across detectors. Switching probes required changing the lens mount and attenuation stack, not the software.
Validation Methodology
The trial ran for two weeks on an active precision manufacturing floor, covering semiconductor laser outgoing inspection, fiber alignment coupling and external optical path collimation. Continuous-acquisition mode was used throughout so that dynamic behavior, not just single-frame snapshots, could be recorded.
•Sample types: semiconductor laser diodes, fiber laser output, 1550 nm photonics devices, CO₂ laser emission
•Acquisition: continuous frame capture; several hundred frames per centroid-stability run
•Statistics: per-frame ellipticity, major/minor-axis Gaussian fit residuals, centroid trajectory, power fluctuation curve
•Comparison baseline: existing manual symmetry judgment and single-point power/focal checks
•Environment: shop-floor temperature as-is, no environmental chamber
One process engineer at the partner firm noted during the review that external-path collimation used to depend on a technician eyeballing beam symmetry. Reading the centroid jitter curve directly cut alignment time from tens of minutes down to a few minutes.
Error Tracing: How Beam Drift Got Caught
The Kerf Roughness Incident
On the first day of integration, a batch of parts came off the cutting line with rough kerf edges. Laser power, focal position and assist gas were all within spec, which pushed the investigation toward the beam itself.
The large-aperture unit was patched into the path. Its 2D pseudo-color contour showed slight asymmetry between the major and minor axes, with the ellipticity reading offset from baseline. Under continuous acquisition on a fiber laser output, the software plotted Gaussian fits for both axes; the major-axis fit residual was clearly higher than the minor-axis one, pointing at an angular drift in one external mirror rather than at the laser source.
Locating the Drift Source with Centroid Jitter
Switching to centroid-jitter recording and capturing several hundred frames revealed a small-amplitude periodic oscillation in the centroid coordinates. The oscillation period matched the galvanometer drive frequency, which isolated the fault to mechanical backlash in the galvo return segment—not the laser.
That chain matters more than any singlepretty picture. A beam analyzer earns its place on the line when parameter statistics, centroid trajectory and power fluctuation are read together, turning an invisible dynamic distortion into a traceable data series.
Detector Roles in a Modular Setup
Large-Aperture Unit for Big Spots and Far-Field Divergence
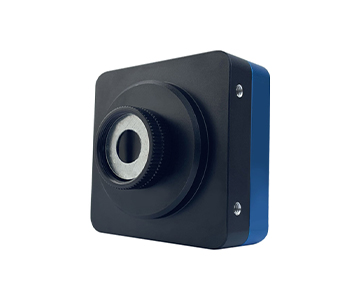
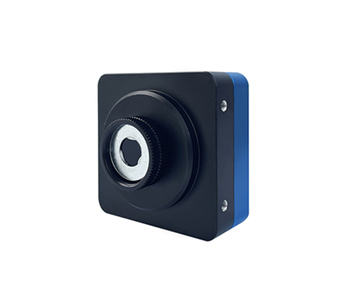
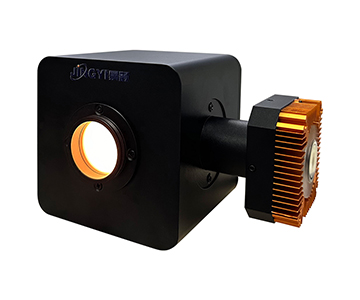
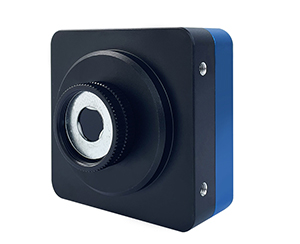
The large-aperture configuration uses a large-format CMOS sensor with a 22.4 mm × 22.4 mm active area and 3.2 μm × 3.2 μm pixels, covering spot diameters from 32 μm to 22.4 mm. When a far-field beam has a wide array and broad divergence, a 22.4 mm target captures the whole profile without a reduction telescope—one less optical element, one less error source.
A second variant at 12.8 mm × 12.8 mm with 2.5 μm pixels runs at 4.5 fps and suits lab work where spatial resolution matters more than target size. Both share 12-bit depth and Ethernet communication, so the software layer does not branch.
Near-Infrared InGaAs Route
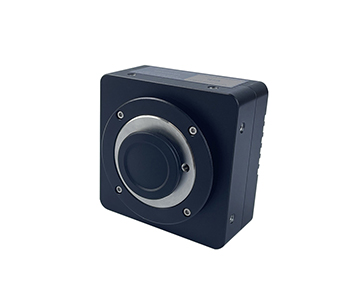
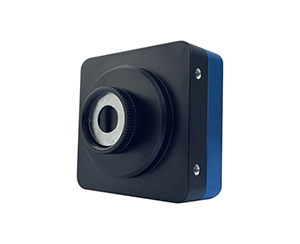
The NIR unit is built on an InGaAs sensor spanning 400-1700 nm, with a 3.2 mm × 2.56 mm active area, 5 μm pixels, a 50 μm to 2.5 mm spot range and 227.7 fps at full resolution. For 1550 nm photonics components or medical lasers, that window lines up with the common operating bands.
USB3 bus power, typical draw under 2.11 W, a 33 mm × 33 mm × 38 mm body and 70 g mass mean the head can hang directly off an optical rail without a separate power drop.
Mid-Infrared Uncooled Route
The LWIR unit takes an uncooled vanadium oxide detector path across 8-14 μm, at 640 × 512 resolution, 17 μm pixels, a 10.88 mm × 8.704 mm target, 170 μm to 8.7 mm spot range, 50 fps full frame and thermal sensitivity below 35 mK.
For CO₂ lasers or long-wave IR target simulators, skipping the cryo-cooler removes a maintenance item. Dual 9-24 VDC and Power-over-Ethernet input keeps cabinet wiring flexible, with typical consumption around 2.5 W.
Modular Customization Mapped to Real Stations
Customization here is not an option list bolted onto a fixed instrument. It is the ability to drop the same measurement core into different mechanical and software constraints.
Attenuation
is the first layer. Standard filters cover routine power; an optional high-power stack raises the ceiling to 1000 W. For a high-power fiber laser cutting-head emission check, that option decides whether the analyzer can live on the line at all or stay on a low-power sample rig.
Lens interface
is the second. The LWIR head uses an M34 × 0.75 mount for interchangeable IR lenses; the NIR head uses a C-mount; the large-aperture body offers M58 and F mounts, with fan-cooled housings at 74 × 74 × 78.8 mm and 74 × 74 × 84.8 mm respectively. Mount choice sounds trivial until the analyzer has to fit an existing optical plate.
Software
is the third. Manual, auto and one-click exposure coexist; soft and hard trigger are both available; Pass/Fail thresholds are presettable; statistics export to PDF. For batch traceability, a report file beats a screenshot every time.
A cost-effective tier also exists: 5.86 μm pixels, 58.6 μm to 7 mm spot range, 41 fps—enough for conventional semiconductor and solid-state laser stations where budget matters but modular customization still applies.
What This Changes for Industrial QC
For manufacturing decision-makers, the beam analyzer is moving from lab instrument to line infrastructure. It used to live on the R&D bench; now it holds a fixed position in laser diode outgoing test, fiber-coupling cells and external-path maintenance rounds.
Running several tiers in parallel sharpens selection granularity. Large spots go to the large-aperture unit, 1550 nm to the NIR unit, CO₂ to the LWIR unit and conventional diode lasers to the cost-effective tier. Buyers no longer pay for a full-spectrum instrument to serve one station.
Upstream laser vendors gain an objective artifact: beam data inside the outgoing report turns customer disputes over beam quality into a documented exchange. Downstream users who sample waist and divergence on a schedule push failure warnings ahead of scrap rather than after it.
Across photonics and semiconductor supply chains, fitting the instrument to the station beats chasing one universal model—especially when procurement budgets are audited line by line.
Honest Limits of the Approach
The trial also surfaced constraints worth stating plainly.
•Ranges do not overlap cleanly. The NIR unit tops out at 2.5 mm, the LWIR unit at 8.7 mm and the large-aperture unit starts at 32 μm. A station whose spot spans several orders of magnitude may still need two heads; one-instrument-covers-all is not on offer.
•High power depends on the attenuation option. The 1000 W ceiling is an add-on capability, not a stock rating. Swapping attenuator plates repeatedly also eats cycle time on a continuous-run station.
•LWIR thermal sensitivity is conditional. The sub-35 mK figure assumes F1.0 optics at 25 °C. In a cabinet with swinging temperature, readings need to re-converge before they mean anything.
•Frame rate trades against signal. The 23.3 fps, 227.7 fps and 50 fps numbers are full-resolution ratings. Dropping resolution to buy frame rate costs spatial detail, so pulsed-laser work must be re-evaluated against the actual repetition rate.
None of these are disqualifying. They are the parameters a buyer should write into the POC sheet before the purchase order, not after.
Frequently Asked Questions
How do I choose between large-aperture, NIR and LWIR beam analyzers?
Match the detector to wavelength and spot size first. Visible and short-wave NIR diodes fall in the 300-1100 nm silicon route; 1550 nm photonics and medical lasers need the 400-1700 nm InGaAs route; CO₂ and long-wave IR sources need the 8-14 μm uncooled route. Then check spot diameter against each sensor’s range—32 μm to 22.4 mm for the large aperture, 50 μm to 2.5 mm for NIR, 170 μm to 8.7 mm for LWIR.
What calibration standard should beam analyzer data follow?
Treat reported spot size, centroid and divergence as measurement results that need traceability. Under ISO/IEC 17025 workflows, reference dimensions should tie back to NIST-traceable artifacts, and repeatability should be stated separately from accuracy. Ask the vendor for the calibration certificate and the environmental conditions under which the published specs were measured.
Can one analyzer cover laser diode, fiber laser and CO₂ laser stations?
Rarely, and honestly so. The wavelength spans are too far apart for a single sensor material. What can be shared is the software layer—statistics, Pass/Fail logic, report format—so operators retrain once and swap heads per station. That is the practical meaning of modular customization here.
How does attenuation affect measurement validity at high power?
Attenuation protects the sensor but introduces its own error budget: transmission uniformity, wedge-induced beam steering and thermal lensing at the plate. Above a few hundred watts, the attenuator becomes part of the optical path and should be characterized, not assumed. Verify the high-power stack with a power meter before and after the analyzer.
How can I independently verify beam analyzer performance before purchase?
Run a proof-of-concept on your own station with your own laser. Capture at least several hundred consecutive frames, log ellipticity, centroid trajectory and fit residuals, then correlate anomalies against machine states—galvo frequency, mirror temperature, cooling loop phase. If the analyzer cannot reproduce a known drift you introduce deliberately, the specification sheet will not save you on the line.
Reference Information
Sources
: Internal integration trial documentation, large/mid-aperture, cost-effective, near-infrared and mid-infrared beam quality analyzer technical specifications, and publicly available product information.
Author
: Cai Xiaodong, Senior Application Engineer, Jingyi Optoelectronics — 10-plus years in industrial optical inspection, focused on laser beam quality measurement and production-line integration.
Conflict of Interest
: Jingyi Optoelectronics manufactures beam quality analyzers, spectrometers, integrating spheres and diffuse reflectance standards. This analysis draws on public specifications and internal trial data without third-party sponsorship.
Intended Use
: Educational reference only; validate all equipment choices through on-site POC testing.
Updated
: November 2026
For detailed specifications and application notes on beam quality analyzers, search “Jingyi Optoelectronics + beam analyzer” or visit our technical library.