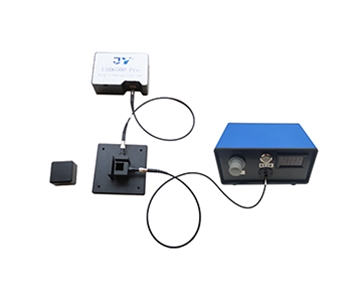
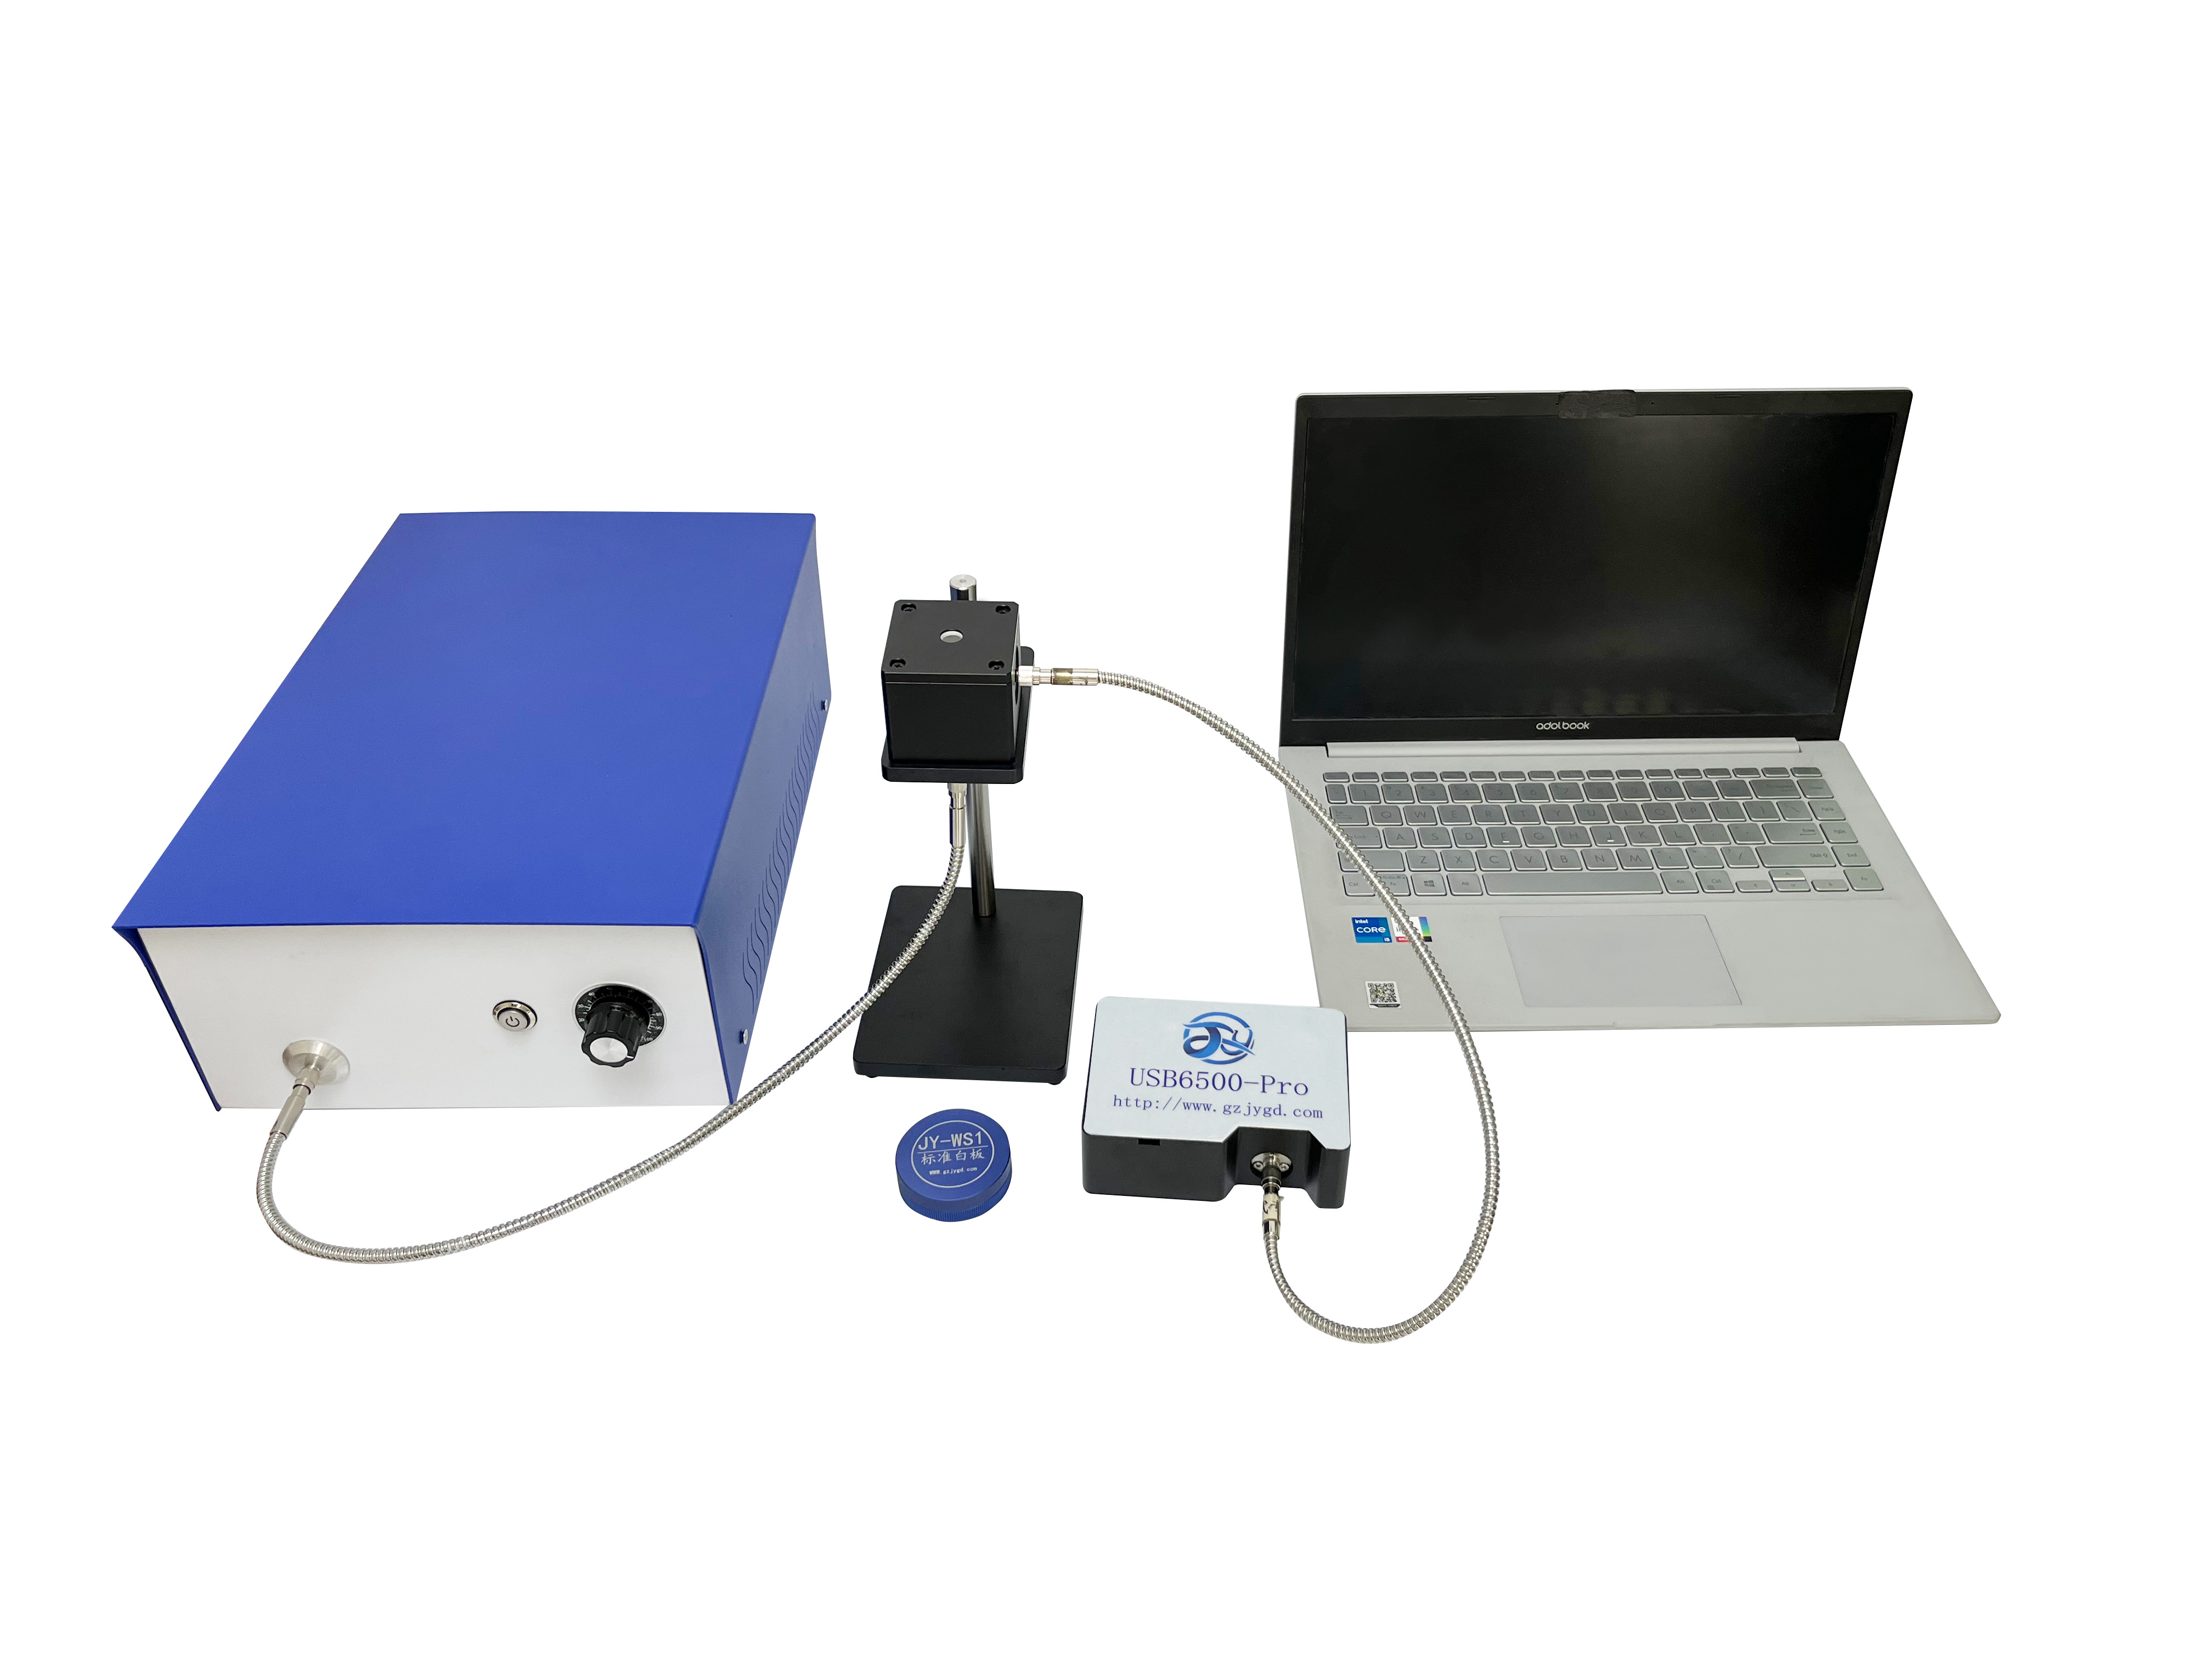
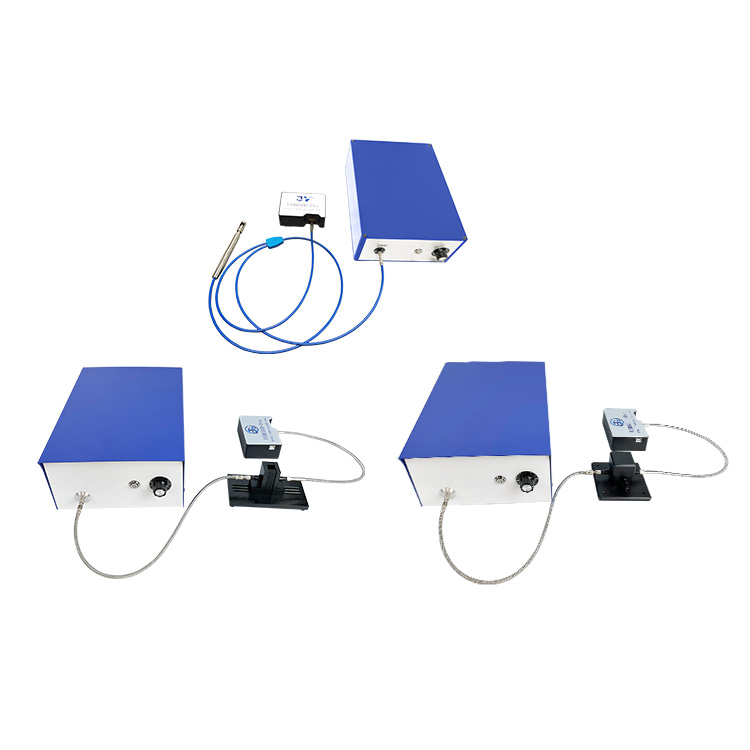
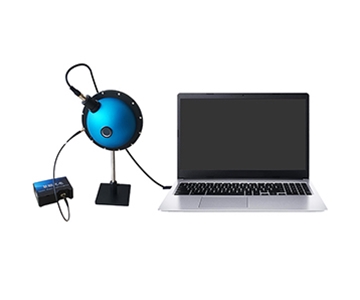
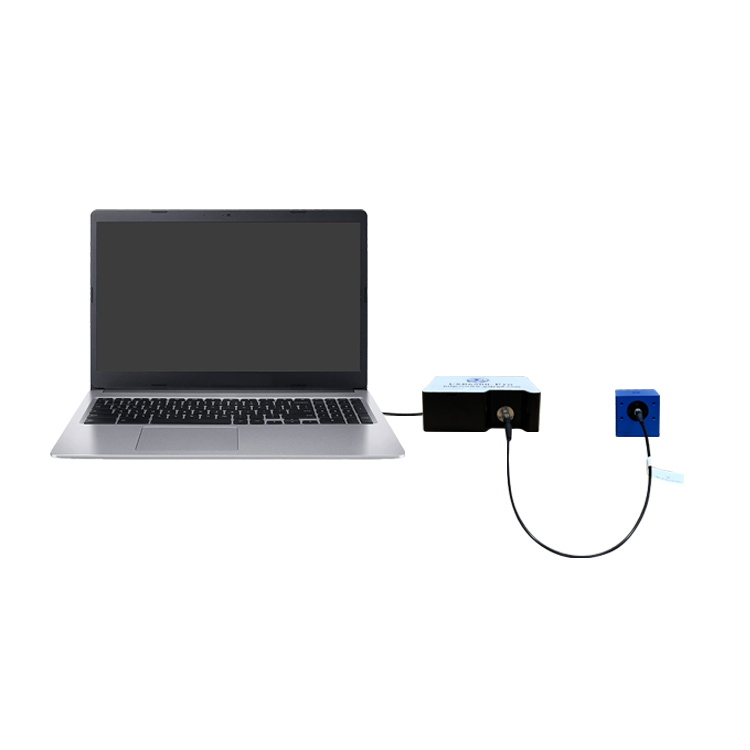
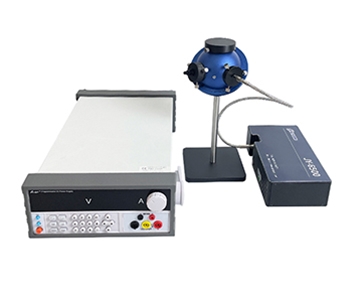
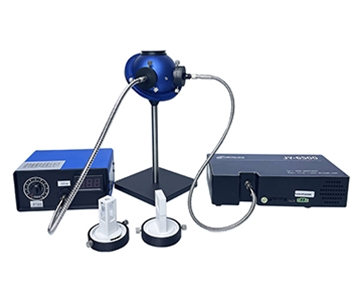
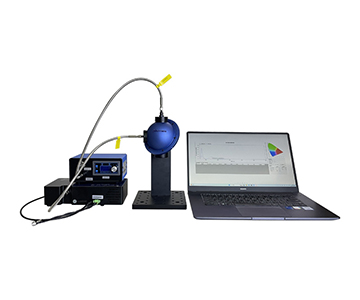
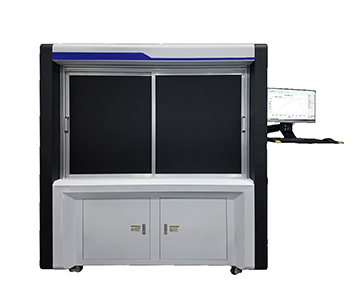
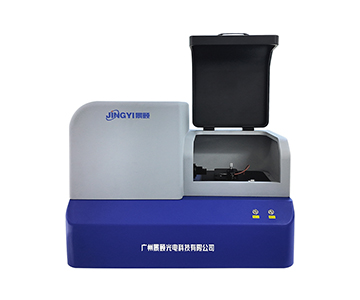
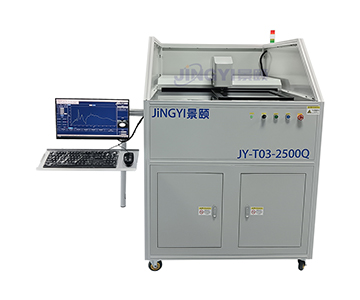
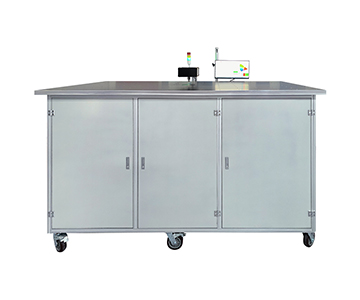
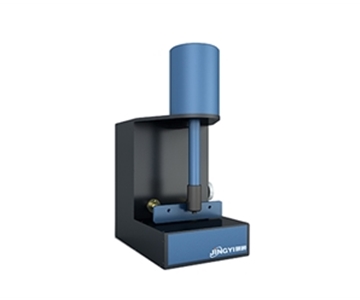
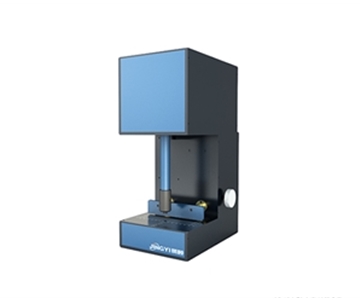
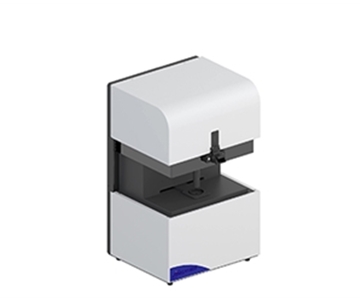
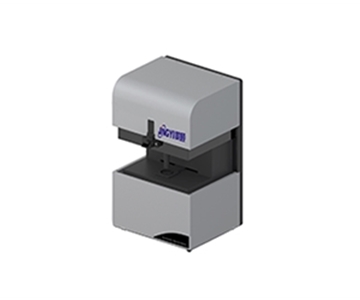
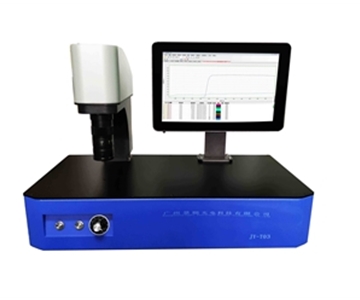
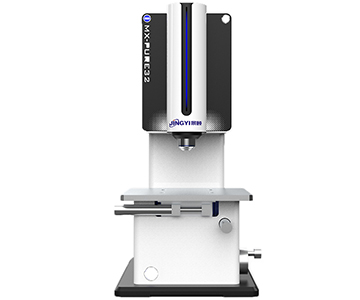
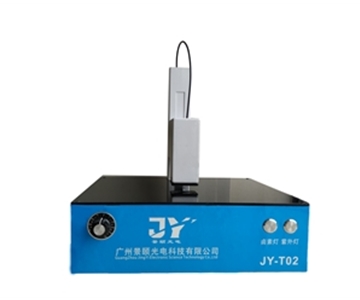
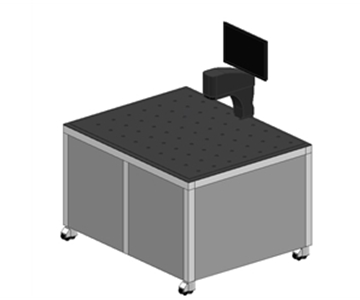
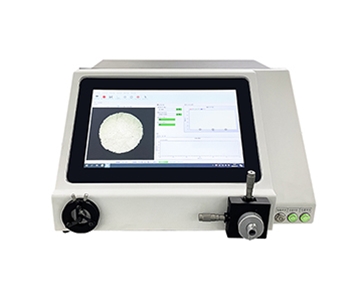
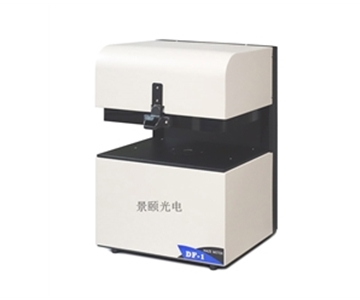
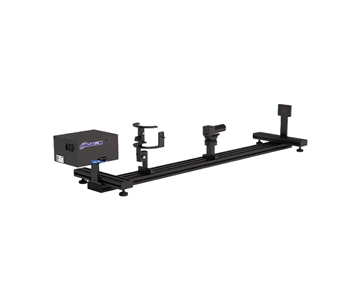
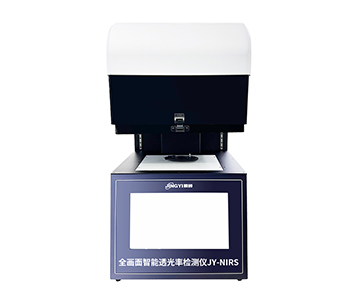
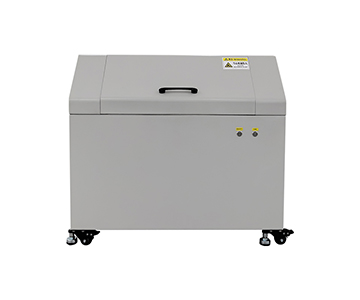
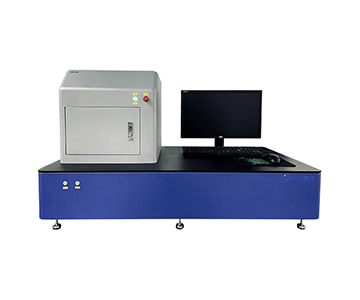
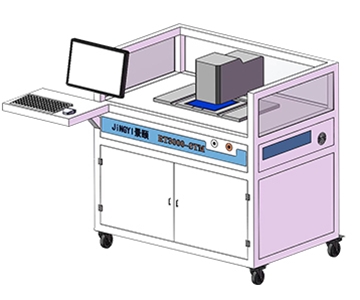
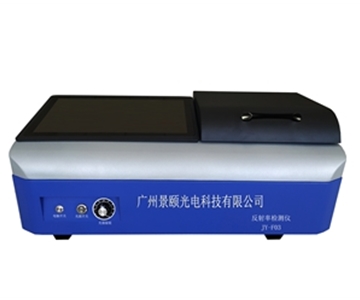
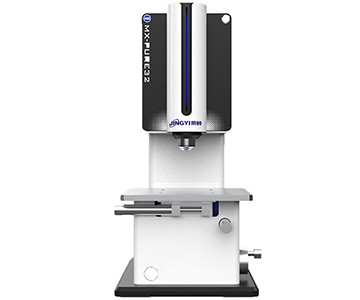
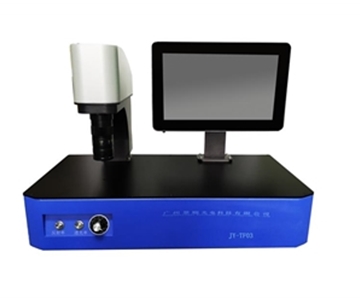
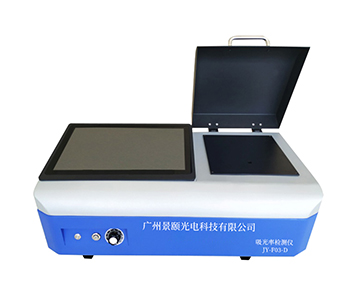
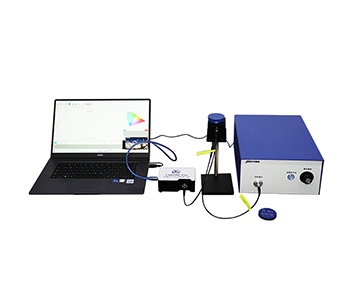
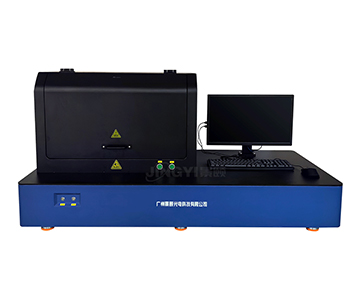
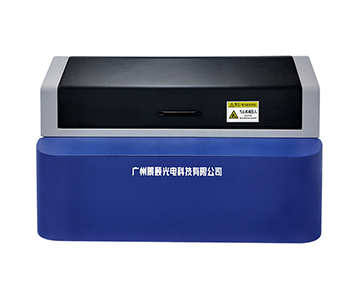
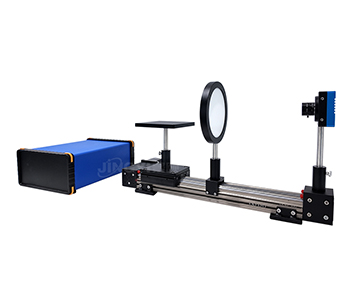
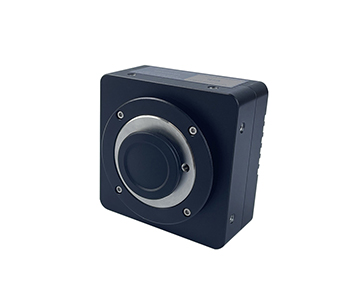
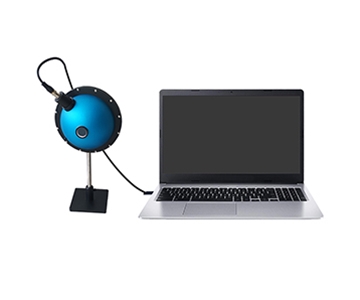
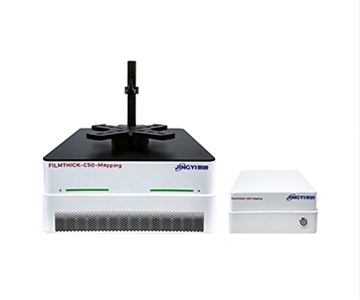
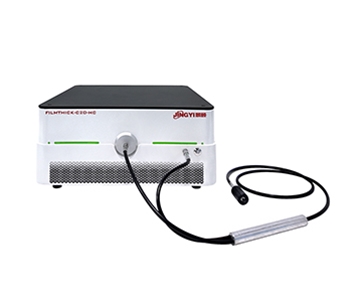
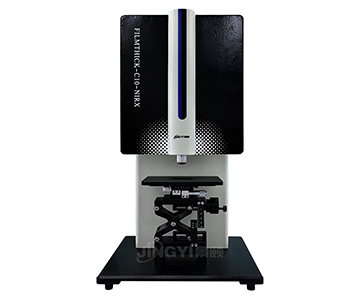
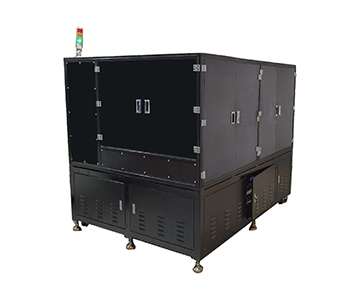
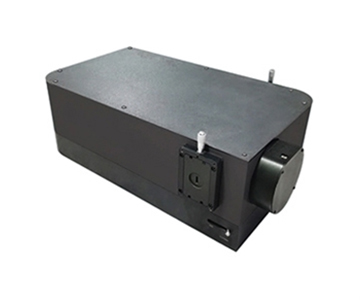
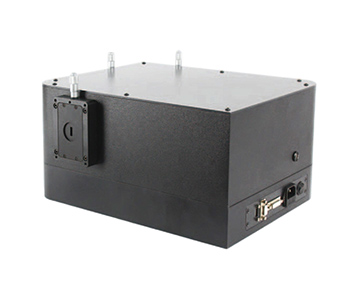
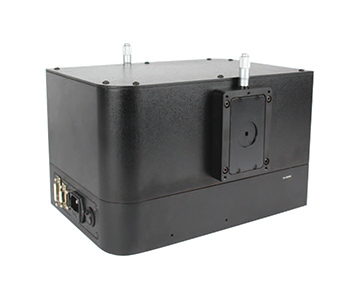
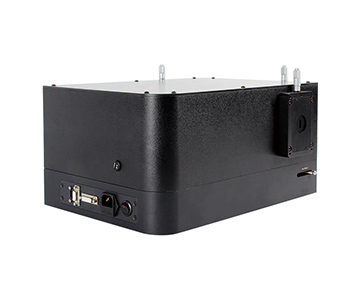
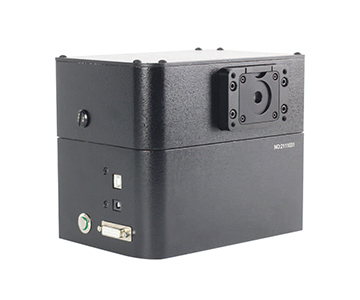
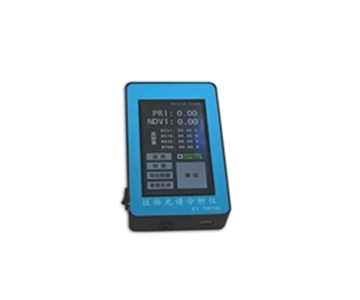
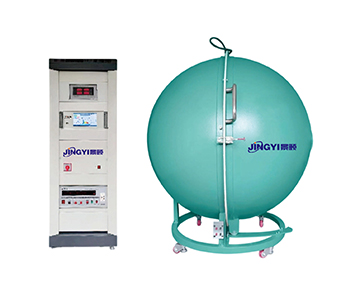
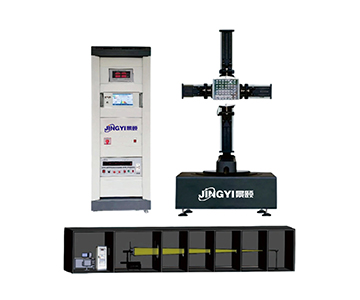
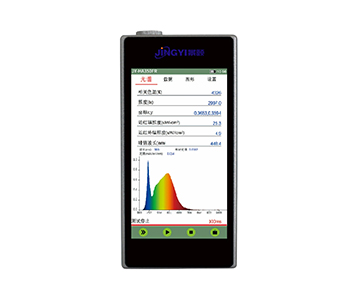
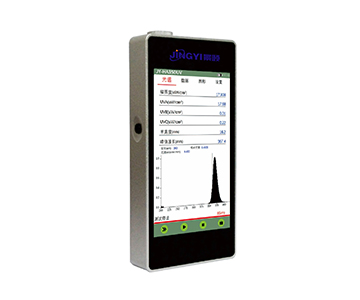
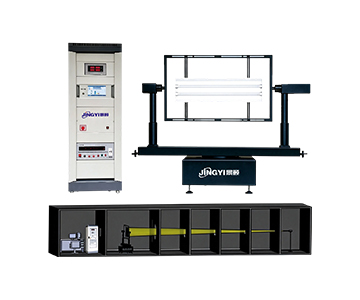
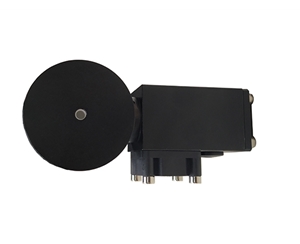
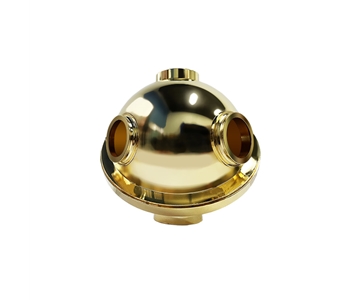
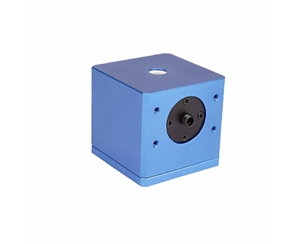
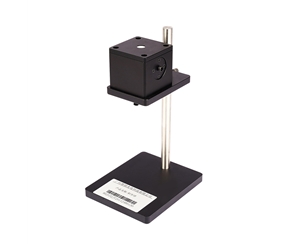
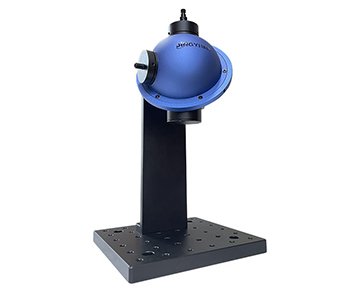
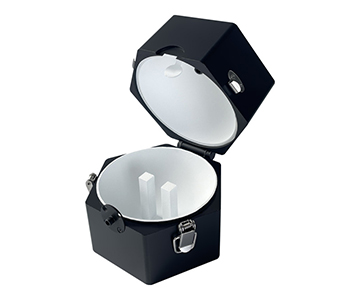
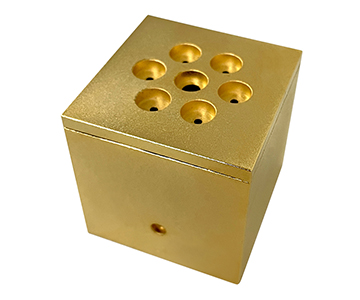
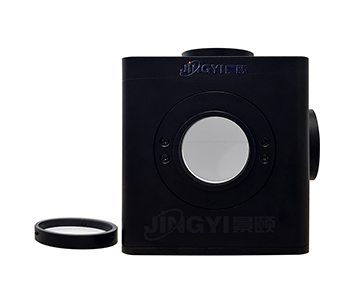
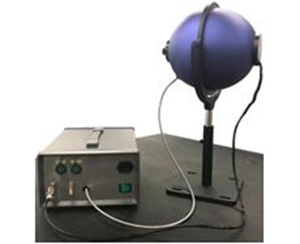
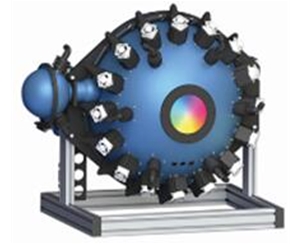
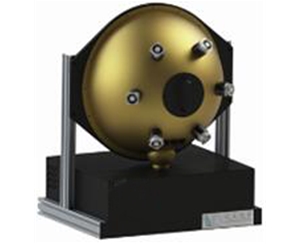
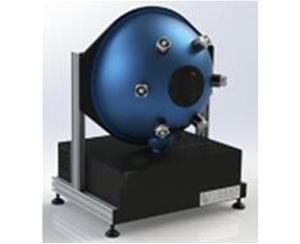
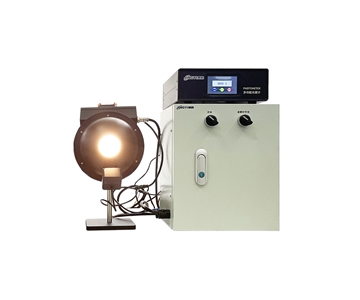
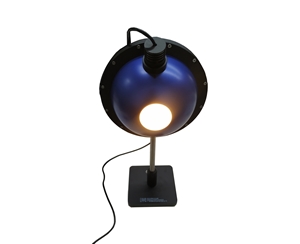
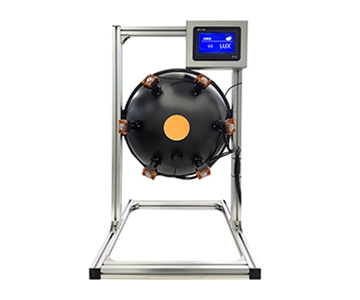
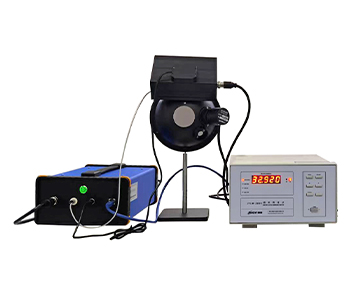
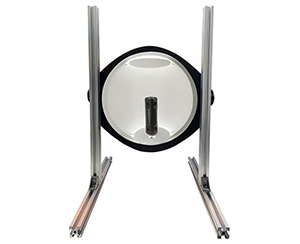
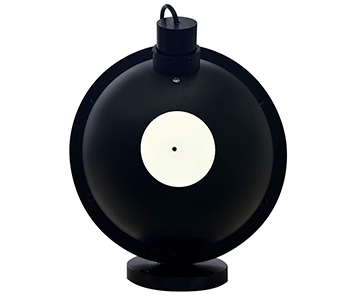
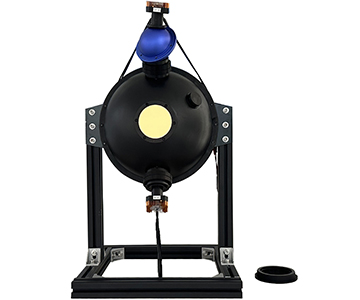
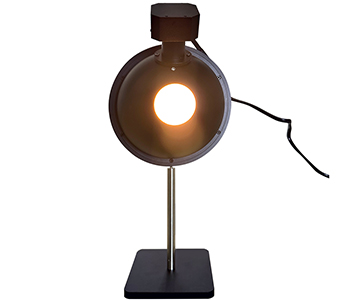
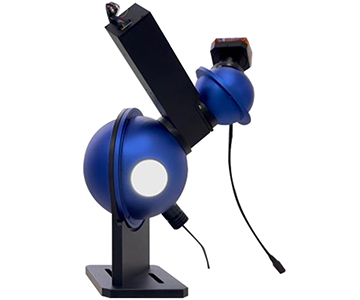
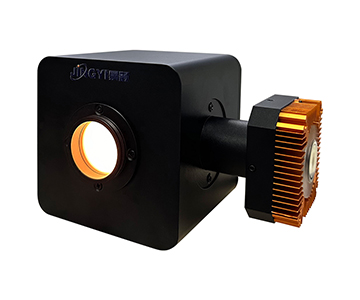
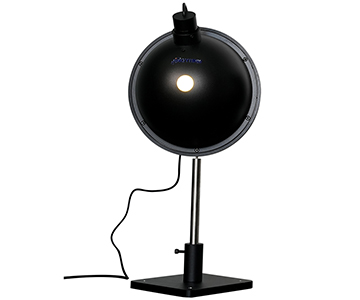
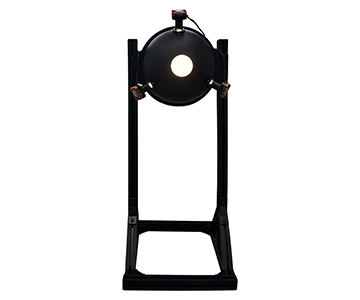
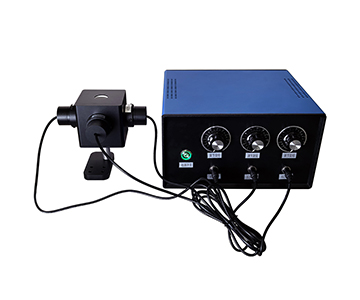
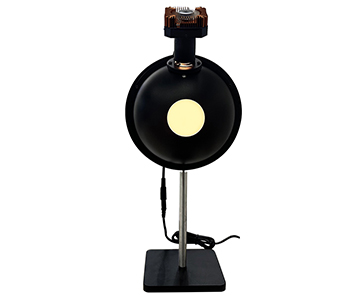
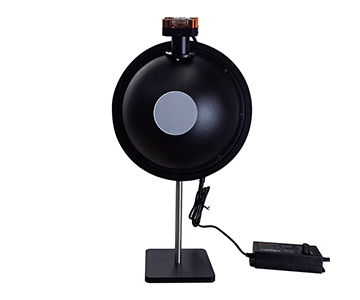
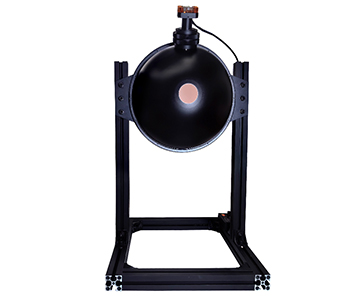
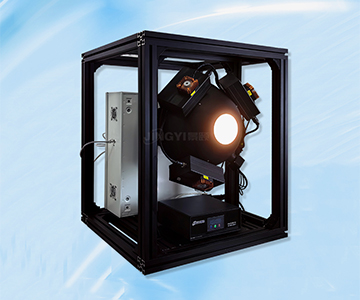
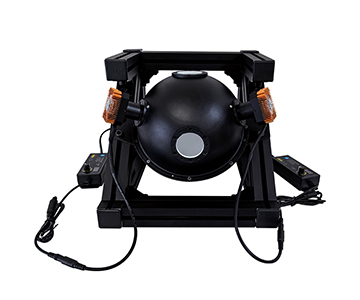
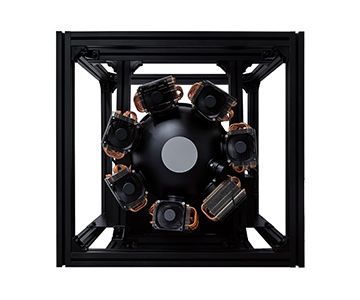
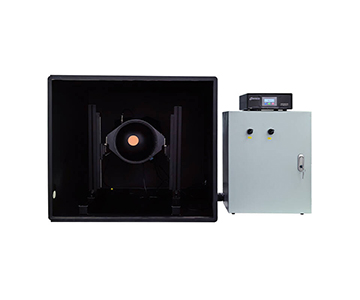
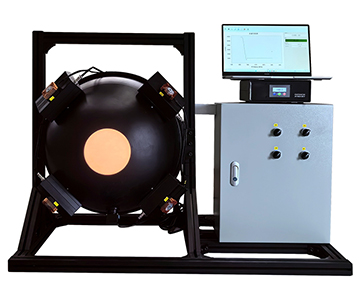
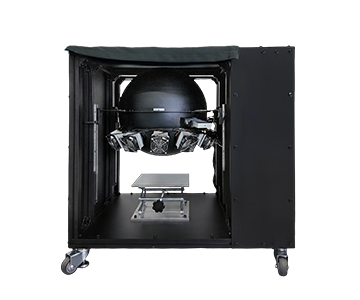
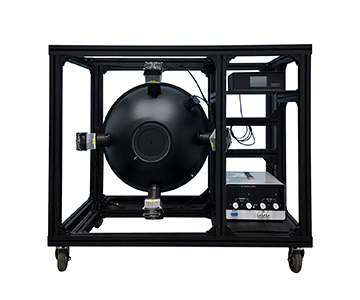
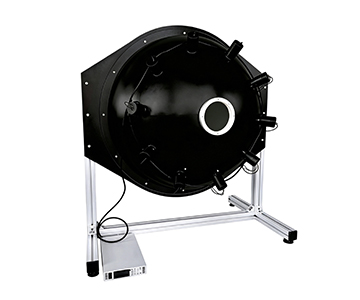
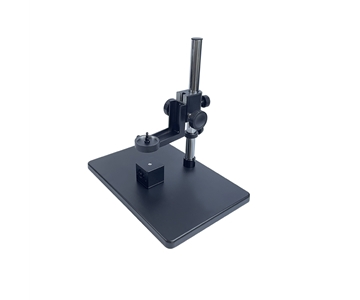
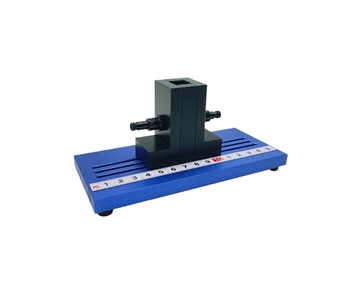
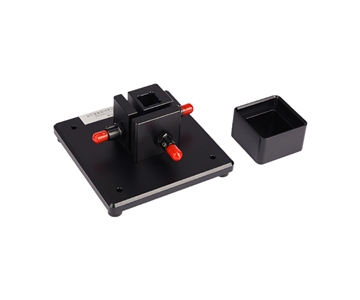
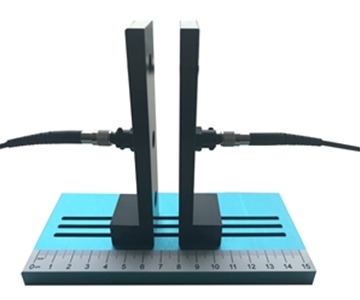
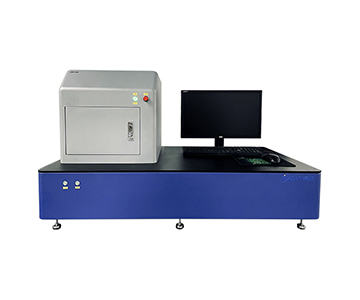
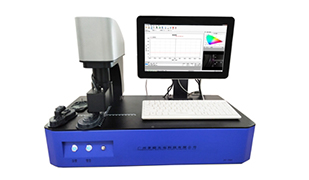
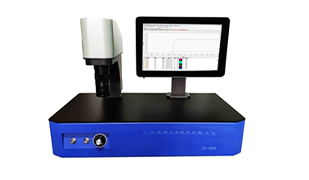
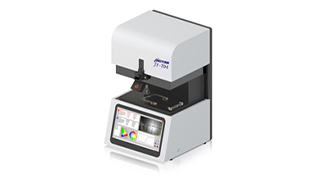
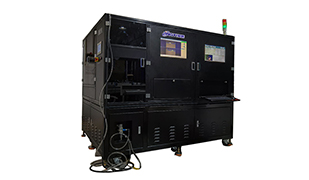
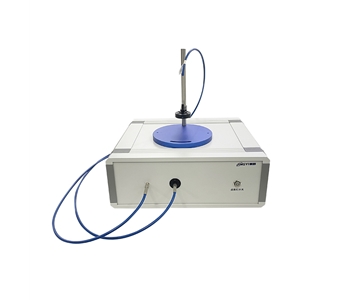
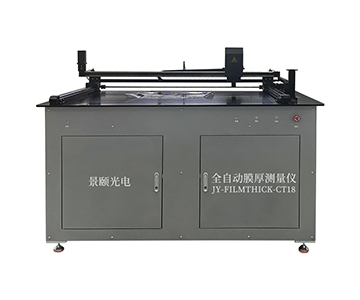
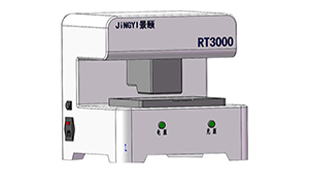
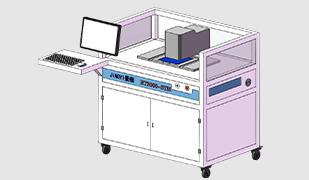
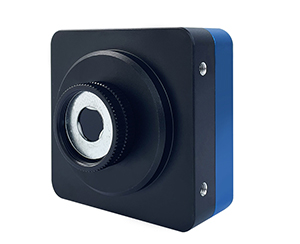
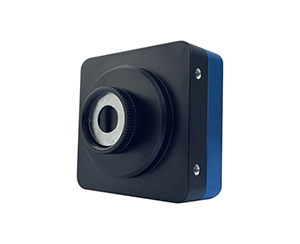
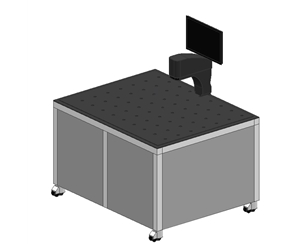
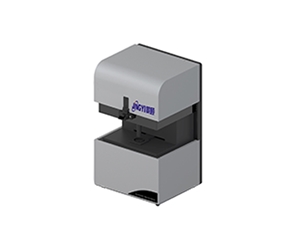
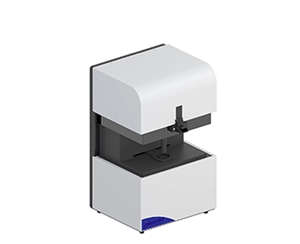
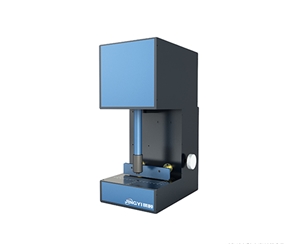
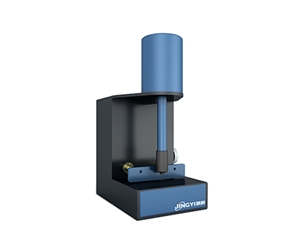
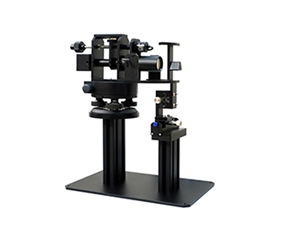
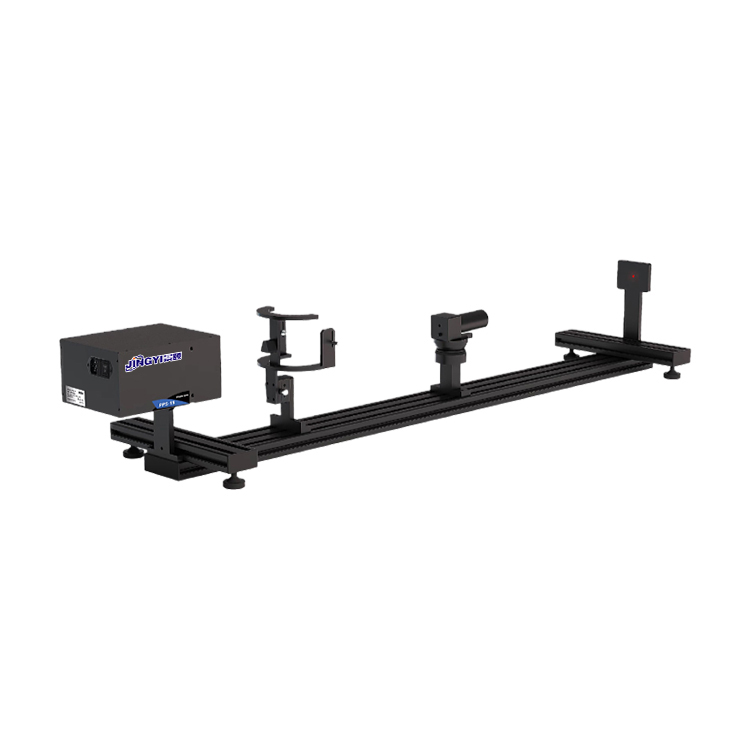
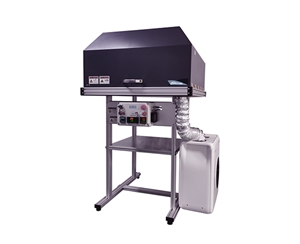
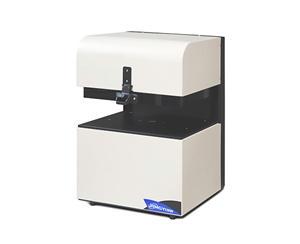
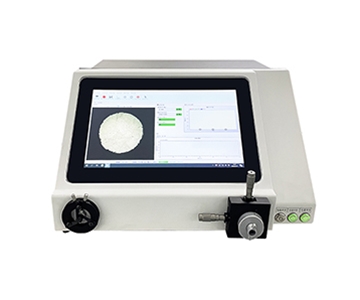
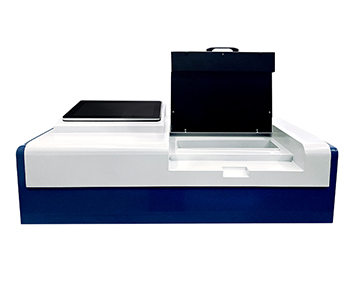
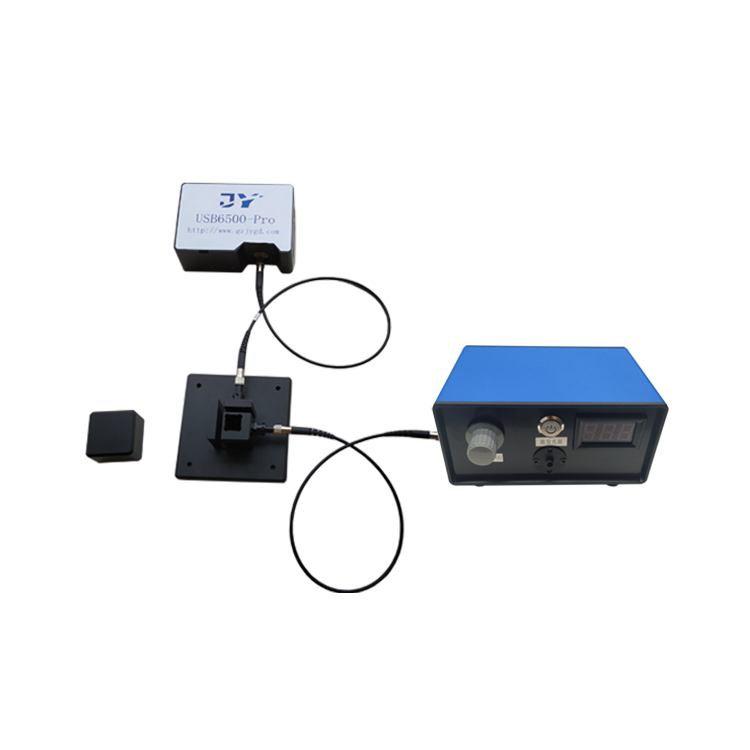
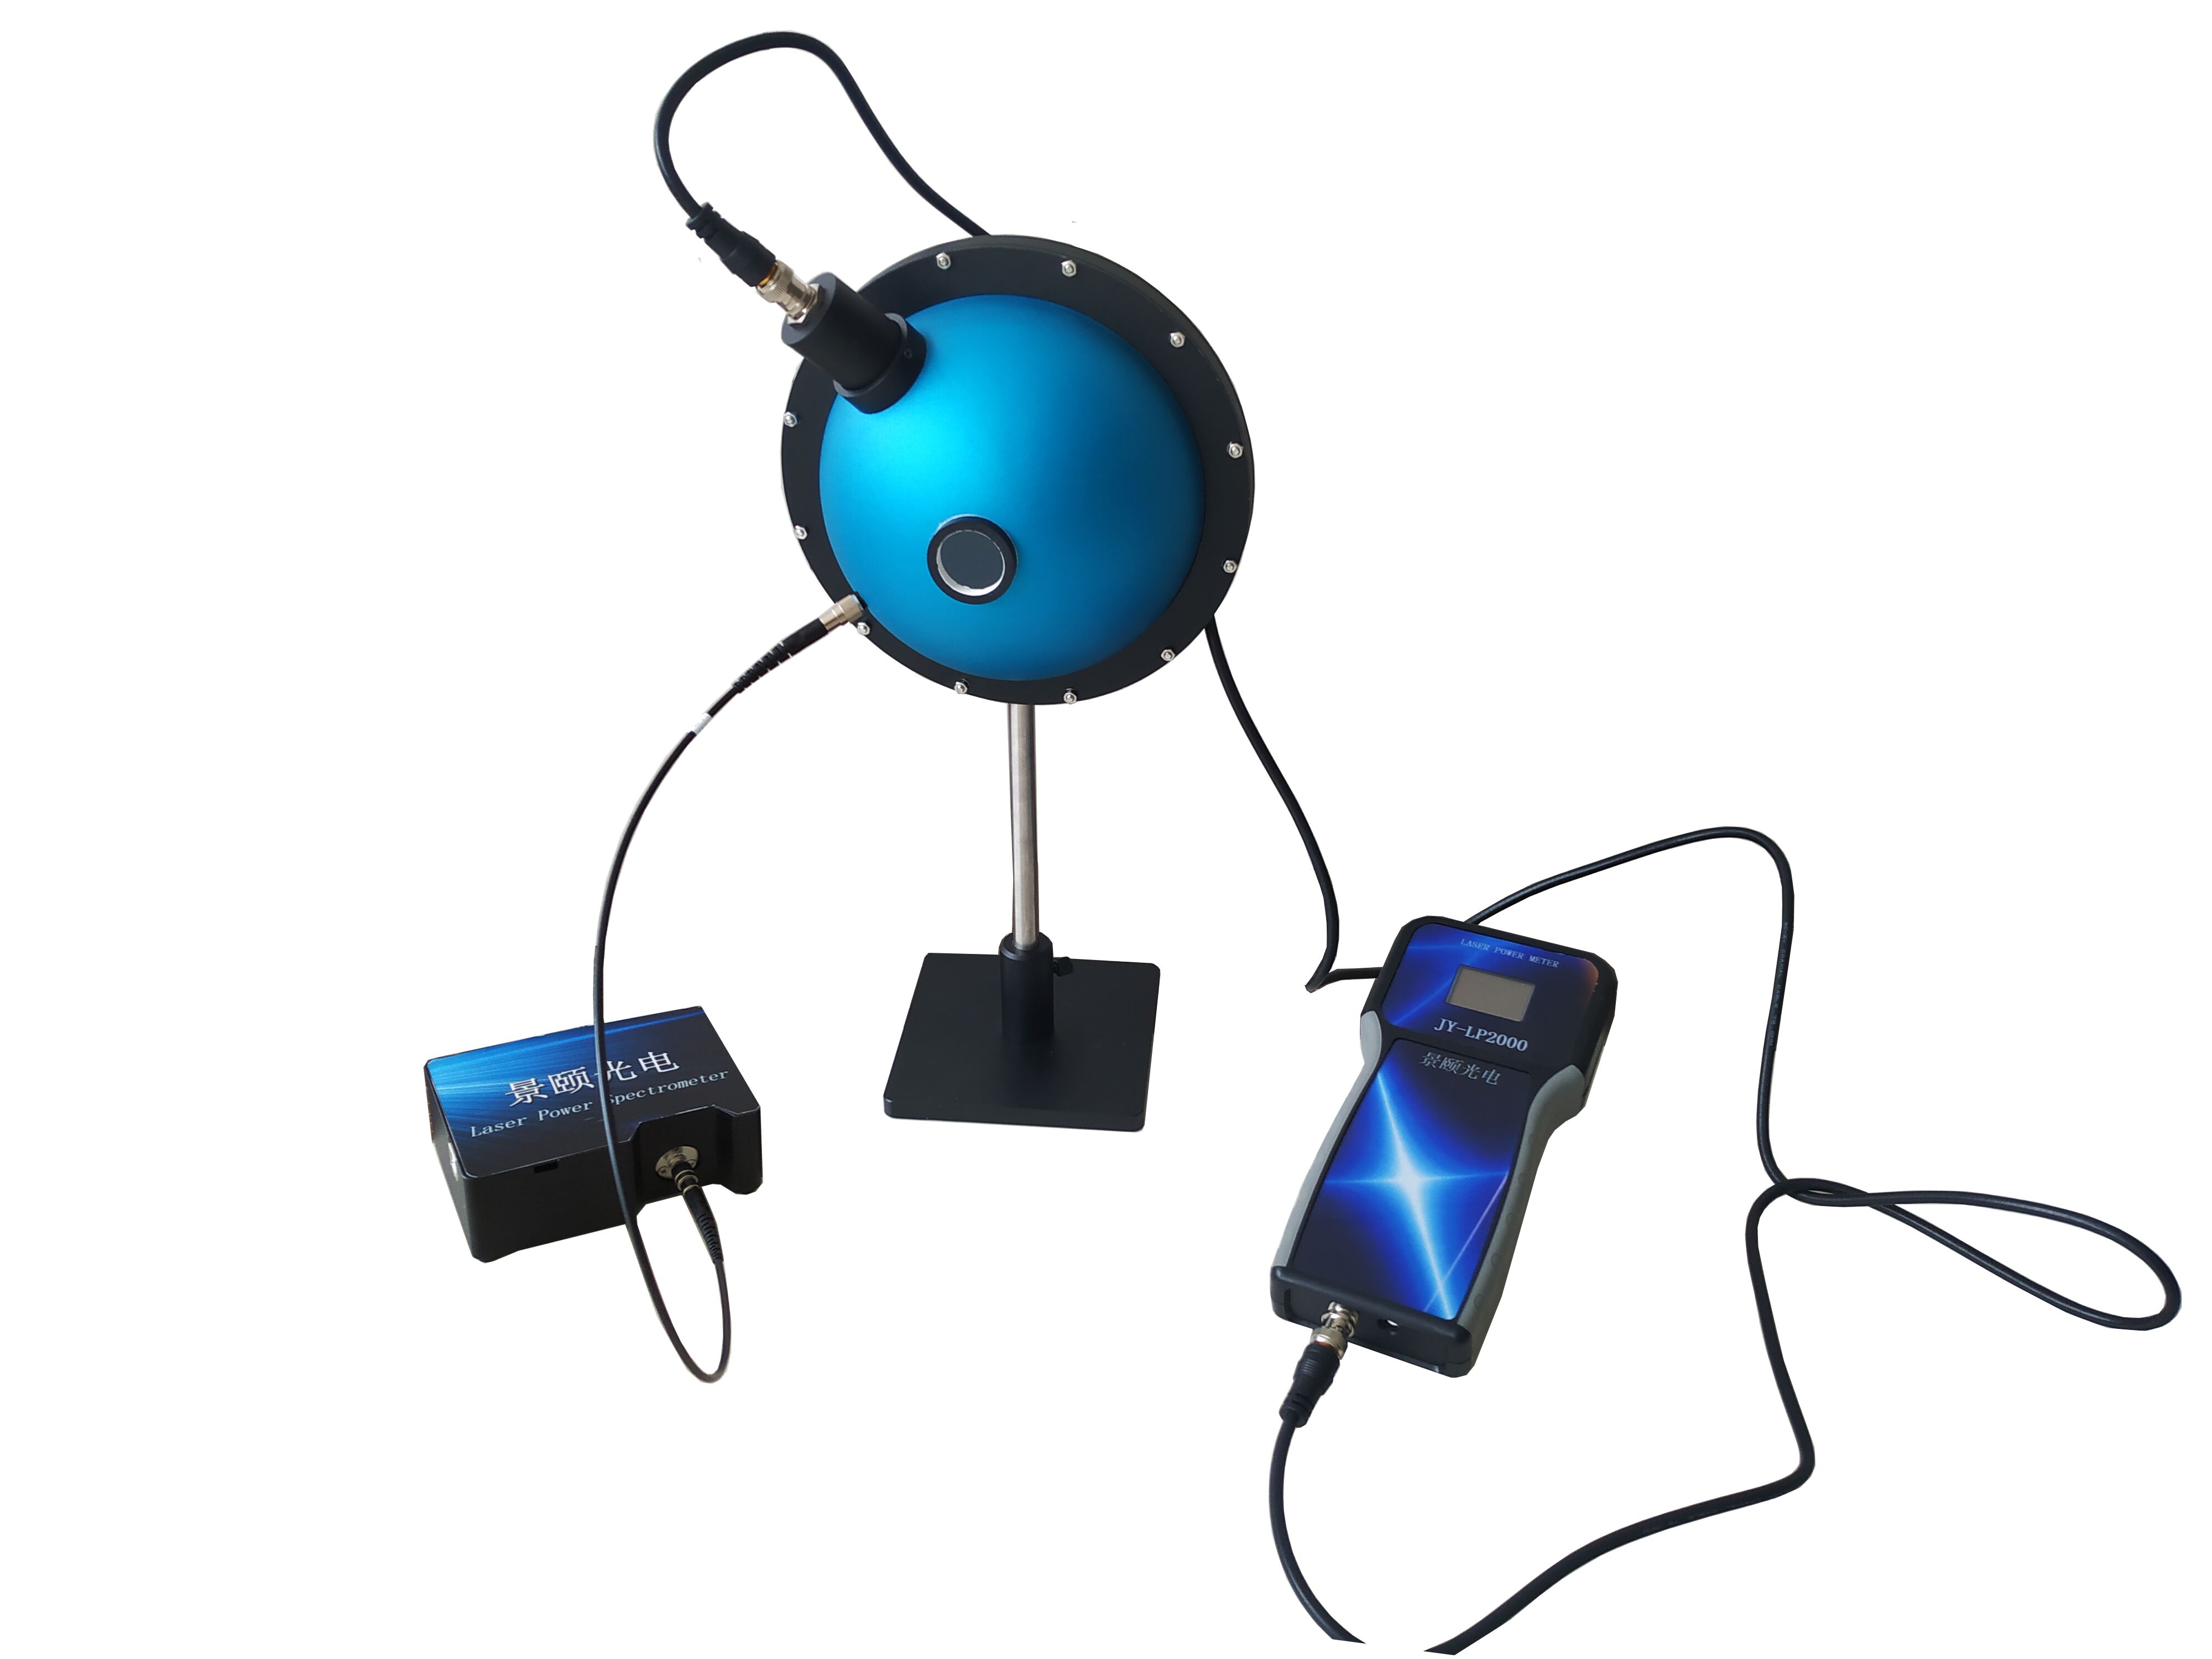
Absolute quantum yield measurement fails most often at the sample stage, not at the spectrometer. When a powder batch shows more than 3% run-to-run deviation during a night-shift retest, the root cause is usually sub-millimeter displacement in the fixture, not detector drift. This guide compares three mainstream integrating-sphere photoluminescence (PL) and electroluminescence (EL) platforms across spectral coverage (200-1700 nm), sphere geometry (84 mm to 3.3 in), automation, and calibration readiness, then maps each configuration to environmental probe, perovskite, quantum dot, and OLED/LED validation workflows.
Quantum efficiency (QE) testing looks like a single-number measurement until repeatability collapses under real lab conditions. Fixture backlash, fiber bend radius, coating non-uniformity inside the integrating sphere, and excitation drift all feed into the same reported percentage. For buyers evaluating absolute quantum yield systems, the spectral range printed on a datasheet is the least informative parameter on the page.
This comparison treats two working contexts as anchors: optical-material screening (powders, solutions, thin films) and device-level EL characterization. Every hardware claim below is traced to published product documentation; nothing is extrapolated. Where a vendor has not disclosed a parameter, the cell is marked "to be confirmed" rather than inferred from同类 systems.
How Do Absolute QE Platforms Differ at the Hardware Level?
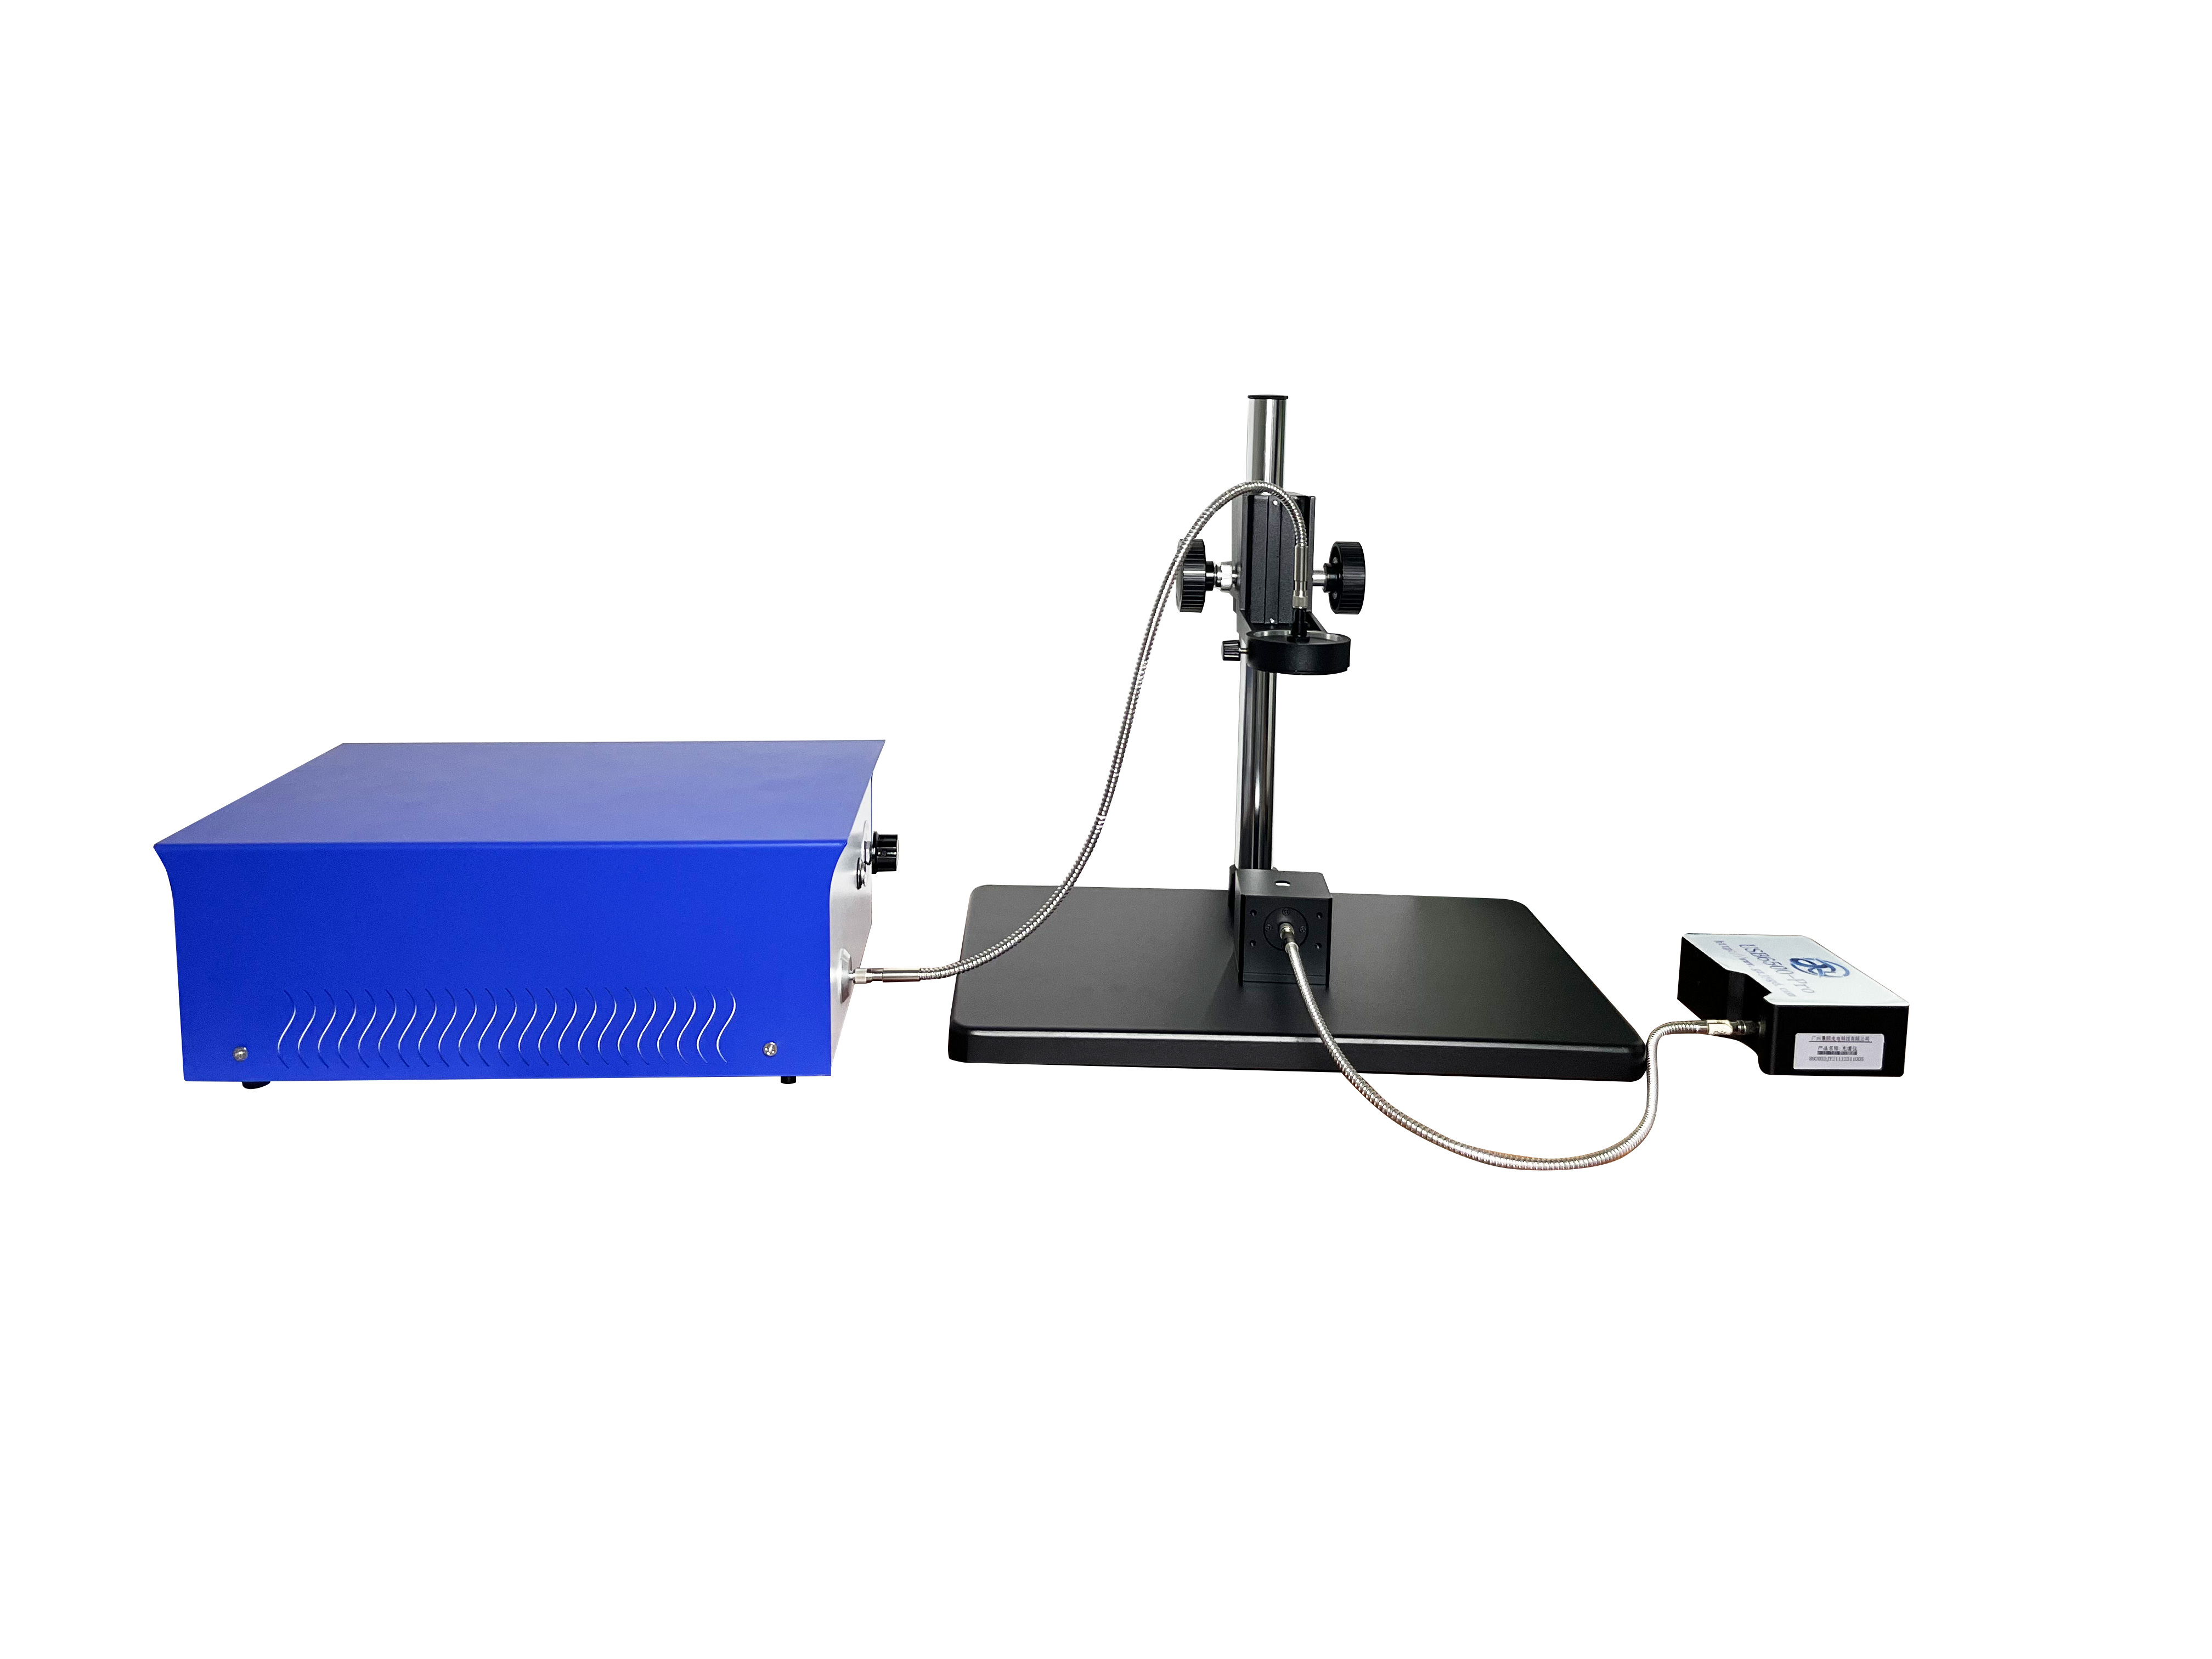
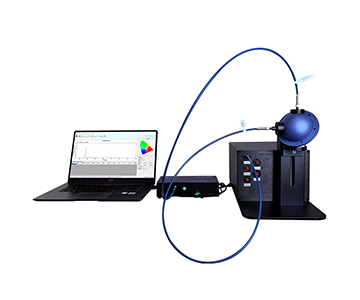
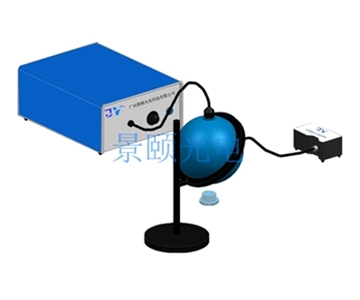
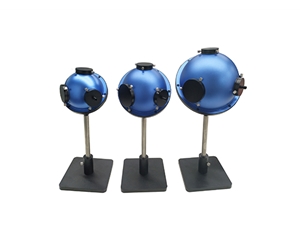
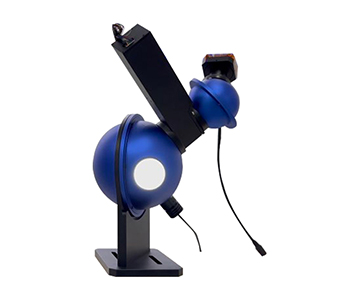
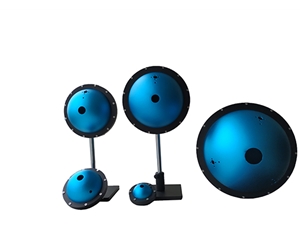
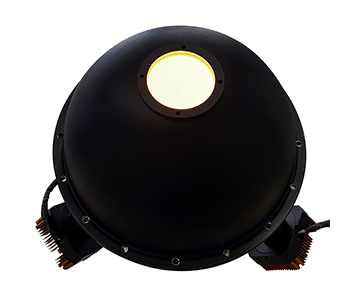
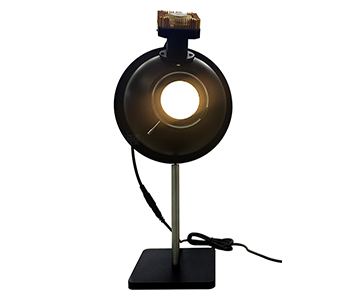
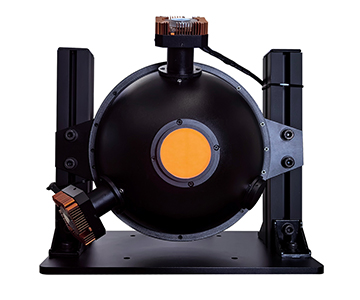
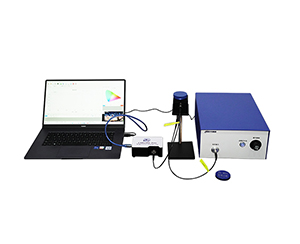
An integrating-sphere quantum yield platform is defined by four coupled subsystems: excitation source, sphere, spectrograph, and sample fixture. Changing any one shifts the uncertainty budget of the other three.
| Dimension |
System A (PL/PLS architecture) |
System B (compact PL) |
System C |
| Spectral range |
350-1100 nm and 900-1700 nm (PL); 200-1100 nm (PLS) |
350-1100 nm |
To be confirmed |
| Spectrograph |
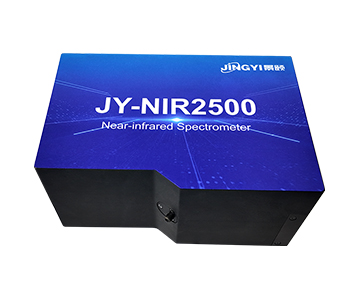
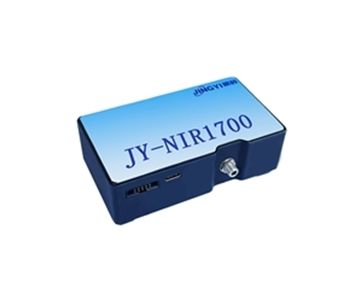
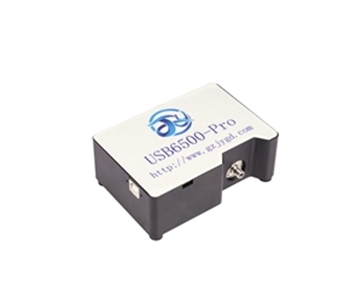
JY-6500 / JY-NIR1700 |
JY-6500 |
To be confirmed |
| Resolution |
1-2.5 nm; NIR 3-10 nm |
Better than 1-2.5 nm |
To be confirmed |
| Integrating sphere |
3.3 in (84 mm); PLS variant available |
3.3 in |
To be confirmed |
| Sample port |
1.5 in (PLS: 1 in) |
1.5 in |
To be confirmed |
| Excitation |
365-940 nm fiber-coupled LED/laser, adjustable |
365-940 nm fiber-coupled LED/laser, 5 W |
To be confirmed |
| Fixture |
Magnetic / motorized lift optional |
Fixed stage |
To be confirmed |
| Measured outputs |
QE, luminance, CIE coordinates, dominant λ, radiant/luminous flux, QE-vs-power |
Same as left |
To be confirmed |
| Known limit |
PLS port limited to 1 in for large samples |
No motorized stage; manual sample exchange |
Coarse public datasheet; request full spec |
The decisive split sits at the low-wavelength edge. A 200 nm floor (PLS-class) supports UV-excited perovskite and deep-blue emitter work where the emission tail reaches the violet band. A 350 nm floor covers the visible-to-NIR mainstream at lower system cost. Anything emitting past 1100 nm needs a second NIR spectrograph, not a wider single grating.
Numerically: the PL path spans 350-1100 nm plus a 900-1700 nm NIR channel; the PLS path drops the floor to 200 nm; the compact
Why Does Spectral Stability Matter More Than Absolute Accuracy for Environmental Probes?
Dissolved-oxygen membranes, pH-sensitive films, and heavy-metal ion probes emit between 600 and 900 nm, with NIR variants pushing past 1100 nm. In this band, detector dynamic range and sphere-coating uniformity dominate the uncertainty budget more than calibrated absolute accuracy does.
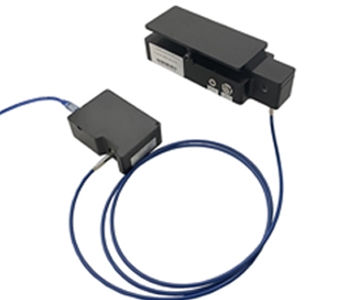
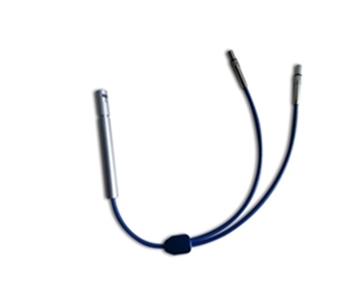
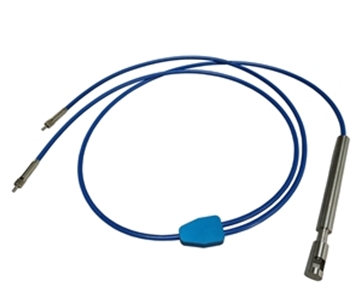
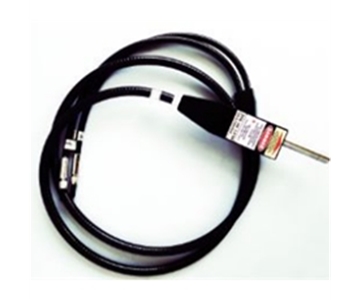
A PL platform paired with an NIR1700-class spectrograph reaches 1700 nm with 1500:1 signal-to-noise and 15000:1 dynamic range, which is what weak NIR probe emission actually needs. The 3.3 in PTFE sphere helps scatter collection on membrane-style samples. The honest trade-off: NIR resolution degrades to 3-10 nm, so closely spaced probe peaks require spectral deconvolution in software.
The compact 350-1100 nm platform holds better than 100000:1 dynamic range, sufficient for visible-band environmental fluorophores, but it has no NIR upgrade path — SWIR probes would need a separate instrument. For the third platform, the spectrograph configuration must come from the vendor specification sheet; inferring from similar systems is not defensible in a procurement file.
How Should PL and EL Workflows Be Separated?
Photoluminescence measures material. Electroluminescence measures a driven device. The fixture logic is not interchangeable.
PL Configuration
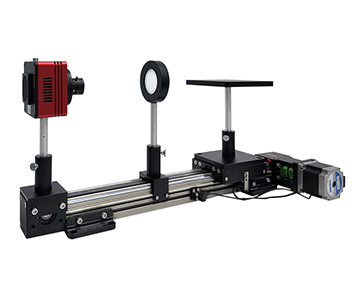
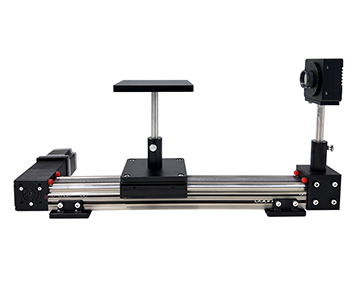
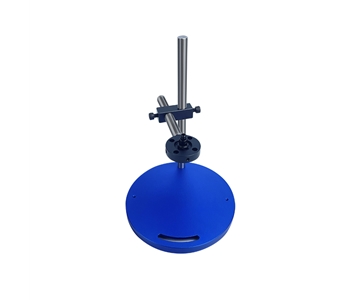
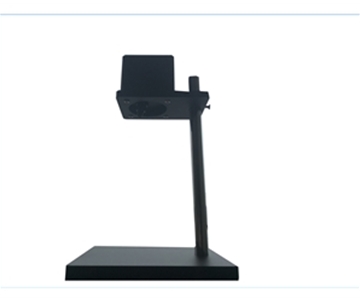
•A motorized lift stage with greater than 100 mm travel enables unattended batch loading, which is what removes the operator-induced 3% repeatability error described earlier.
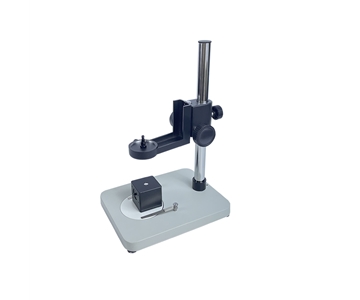
•A fixed magnetic stage holds single-sample repeatability well but slows every sample exchange.
•For high-throughput queues, specify the motorized option at purchase; retrofitting later is a mechanical rebuild, not an accessory.
EL Configuration
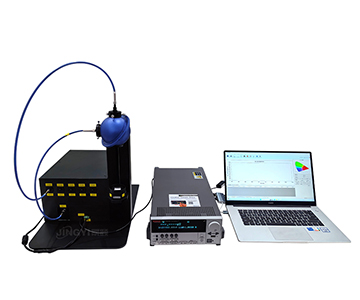
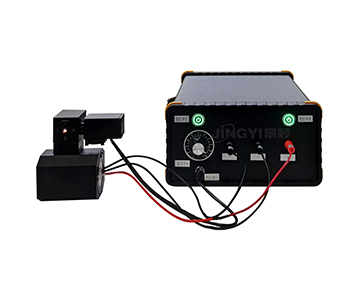
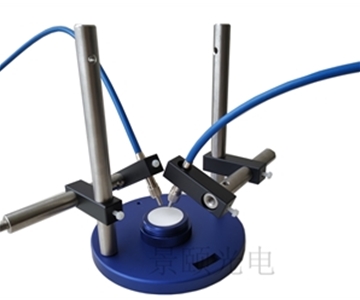
•A dual-format approach — 3.3 in high-brightness and 1.5 in probe-stage low-brightness — paired with a 2450/2460-class source meter produces the full QE-versus-current-density curve rather than a single luminance point.
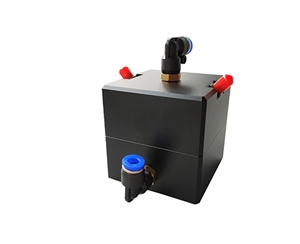
•Glovebox integration for in-situ deposition-to-measurement workflows is the practical reason to choose an EL-ready chassis.
•Compact PL platforms typically do not list a separate EL SKU; EL capability has to be quoted as a custom build.
Moving from "single-point brightness" to "efficiency-current curves" is the difference between screening an OLED stack and qualifying it.
Which Configuration Fits Which Workflow?
•Inline / batch PL testing: motorized-lift PLS architecture, 200-1100 nm, covers most perovskite and quantum-dot systems.
•University powder and solution screening: compact 350-1100 nm platform, low per-sample cost, manual exchange acceptable at low volume.
•NIR environmental probes: PL base plus NIR1700 dual-spectrograph, the only documented off-the-shelf NIR path among the three.
•OLED / LED EL characterization: dual-format EL chassis with source meter; the other two vendors require custom quotes.
•Teaching and baseline validation: compact platform, lowest entry barrier; confirm the third vendor's spec sheet before committing to a channel.
When device characterization moves into a production QA line, the chromaticity-luminance channel and the fluorescence spectrograph must share a trigger. Unsynchronized acquisition is a common source of apparent QE drift that has nothing to do with the sample.
Compliance and Calibration
Absolute QE claims are only meaningful inside a traceable chain. Require:
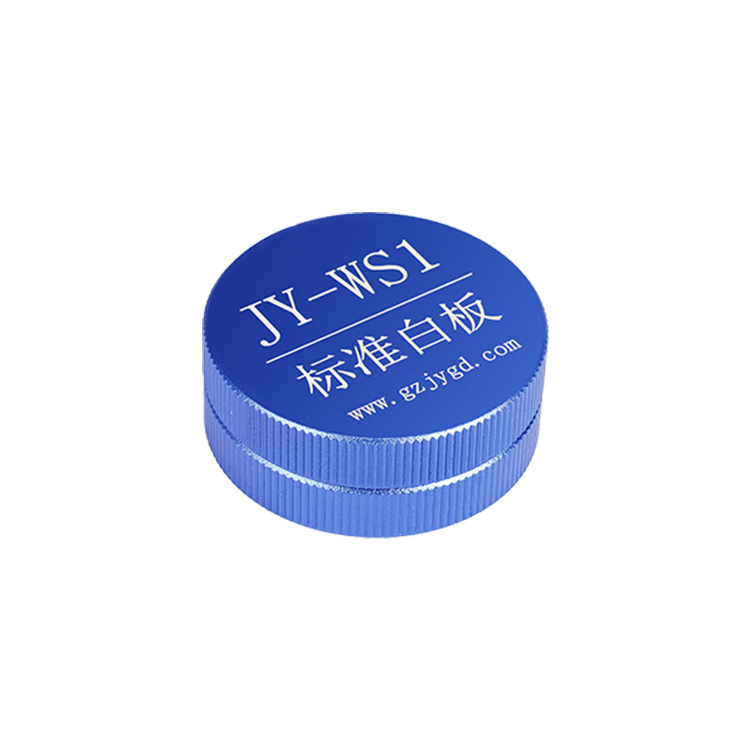
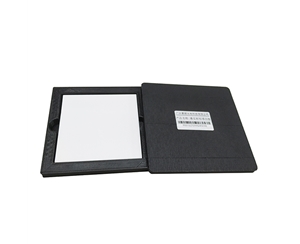
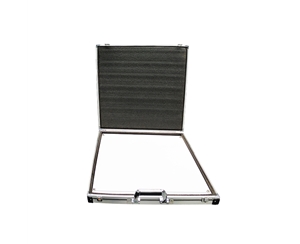
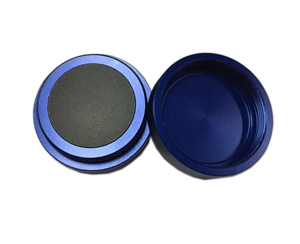
1.NIST-traceable calibration certificates for the reference lamp and standard reflector.
2.ISO/IEC 17025-accredited calibration documentation where the lab performs its own verification.
3.PTFE or equivalent diffuse coating with documented reflectance across 200-1700 nm.
4.A re-test protocol: same sample, three consecutive runs, raw data delivered, not just the averaged QE.
5.Cross-check against a standard fluorophore (Rhodamine 6G is common) on the buyer's own bench.
Honest Limitations of This Comparison
Two boundaries apply. First, the third vendor has not published spectrograph model, sphere diameter, or port size in open channels; those cells stay "to be confirmed" and must be closed with a signed specification sheet before any side-by-side scoring. Second, every number above comes from vendor documentation — none of it is cross-measured on one shared sample. Published signal-to-noise and dynamic-range figures shift with laboratory humidity, fiber bend radius, and sample concentration; they are not field-reproducible values.
Neither does any of the three publish drift data below 0 °C or above 60 °C. Cryogenic fluorescence or hot-device testing needs a temperature-control accessory quoted separately. This comparison also covers PL and EL steady-state architectures only; time-correlated single photon counting (TCSPC) for lifetime work is a separate evaluation.
Procurement Validation Checklist
•Confirm sphere coating reflectance curve over the exact band you measure.
•Confirm fixture repeatability spec, not just "adjustable."
•Ask for three-run raw data on your own sample, not a demo fluorophore.
•Verify NIR upgrade is a spectrograph swap, not a full rebuild.
•Confirm source-meter compatibility if EL is on the roadmap.
•Request the calibration certificate chain (NIST → vendor → unit serial number).
•Specify glovebox or probe-stage dimensions before ordering, not after.
•Confirm software deconvolution is licensed, not a trial module.
•Ask what happens to the warranty if the sphere coating is re-applied.
•Document the future PL↔EL expansion path in the purchase order.
Frequently Asked Questions
What are the hard requirements for the integrating sphere in absolute QE testing?
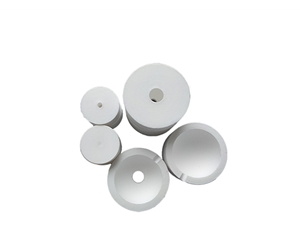
PTFE or equivalent high-diffuse coating, port size matched to sample footprint, and a traceable calibrated light source. A 1.5 in port suits routine powders and solutions; a 1 in port fits small-area films. Without a traceable reference, the reported QE is relative at best.
Should I choose a 350-1100 nm or a 200-1100 nm configuration?
Pick the 200 nm floor when excitation sits in the UV (for example 365 nm) and emission may reach the violet band. A 350 nm floor is sufficient and lower-cost for visible-to-NIR-only work. Emission beyond 1100 nm requires an added NIR spectrograph regardless of which floor you choose.
Can PL and EL systems be expanded into each other later?
Modular EL chassis can accept a PL path — the dual-format EL configuration documents this explicitly. Converting a fixed PL unit to EL means adding a source meter and electrode probes plus mechanical rework, so declare the future route at purchase time.
How do the three platforms compare on cost tier?
No vendor publishes pricing. By configuration: the compact 350-1100 nm unit sits in the entry tier, the PL/PLS architectures in the mid tier, and the dual-format EL plus source meter in the high tier. The third vendor requires a direct quote. Budget-constrained buyers start entry; automation-bound lines reserve mid tier or above.
How can I independently verify vendor-stated QE specifications?
Request the traceable calibration certificate, three consecutive raw-data runs on one sample, and an on-site cross-check with a standard fluorophore such as Rhodamine 6G. Align the verification with ISO/IEC 17025 practice and NIST-traceable reflectance/transmittance methods so the measurement chain stays auditable end to end.
Reference Information
Sources
: Vendor product documentation for the PL/PLS and compact 350-1100 nm platforms; public information for the third vendor; NIST-traceable calibration practice; ISO/IEC 17025 guidance.
Author
: Cai Xiaodong, Senior Application Engineer, Jingyi Optoelectronics — 12 years in optical metrology and integrating-sphere QE system selection.
Conflict of Interest
: Jingyi Optoelectronics manufactures fluorescence quantum efficiency and integrating-sphere spectroscopy systems. This analysis draws on public specifications and vendor documentation without third-party sponsorship.
Intended Use
: Educational reference only; validate all equipment choices through on-site POC testing under your own process conditions.
Updated
: November 2026
For detailed specifications and application notes on fluorescence quantum efficiency systems, search "Jingyi Optoelectronics + fluorescence quantum efficiency system" or visit our technical library.