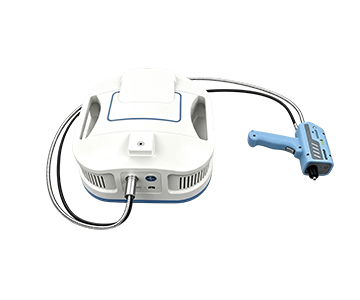
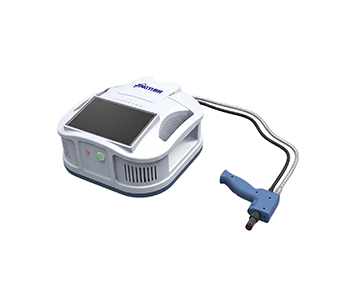
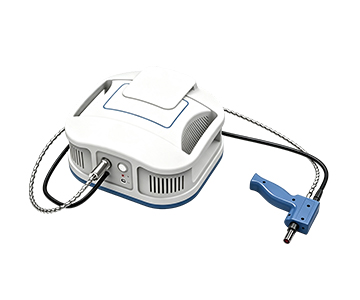
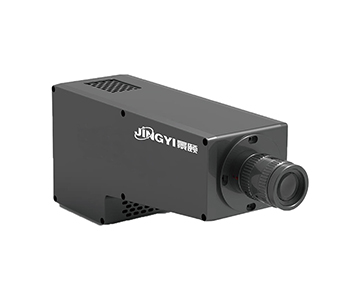
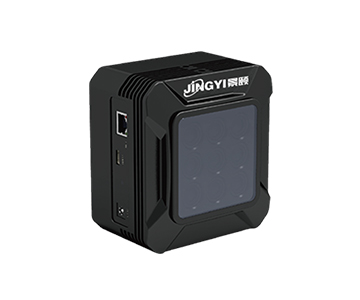
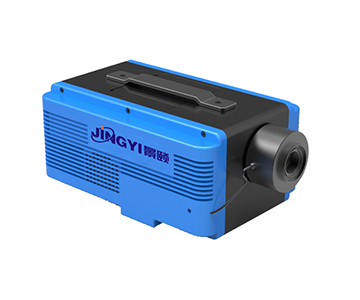
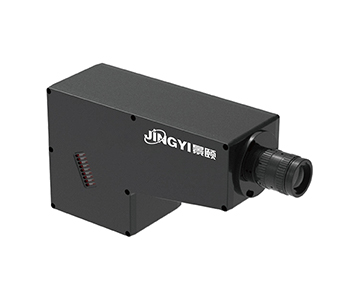
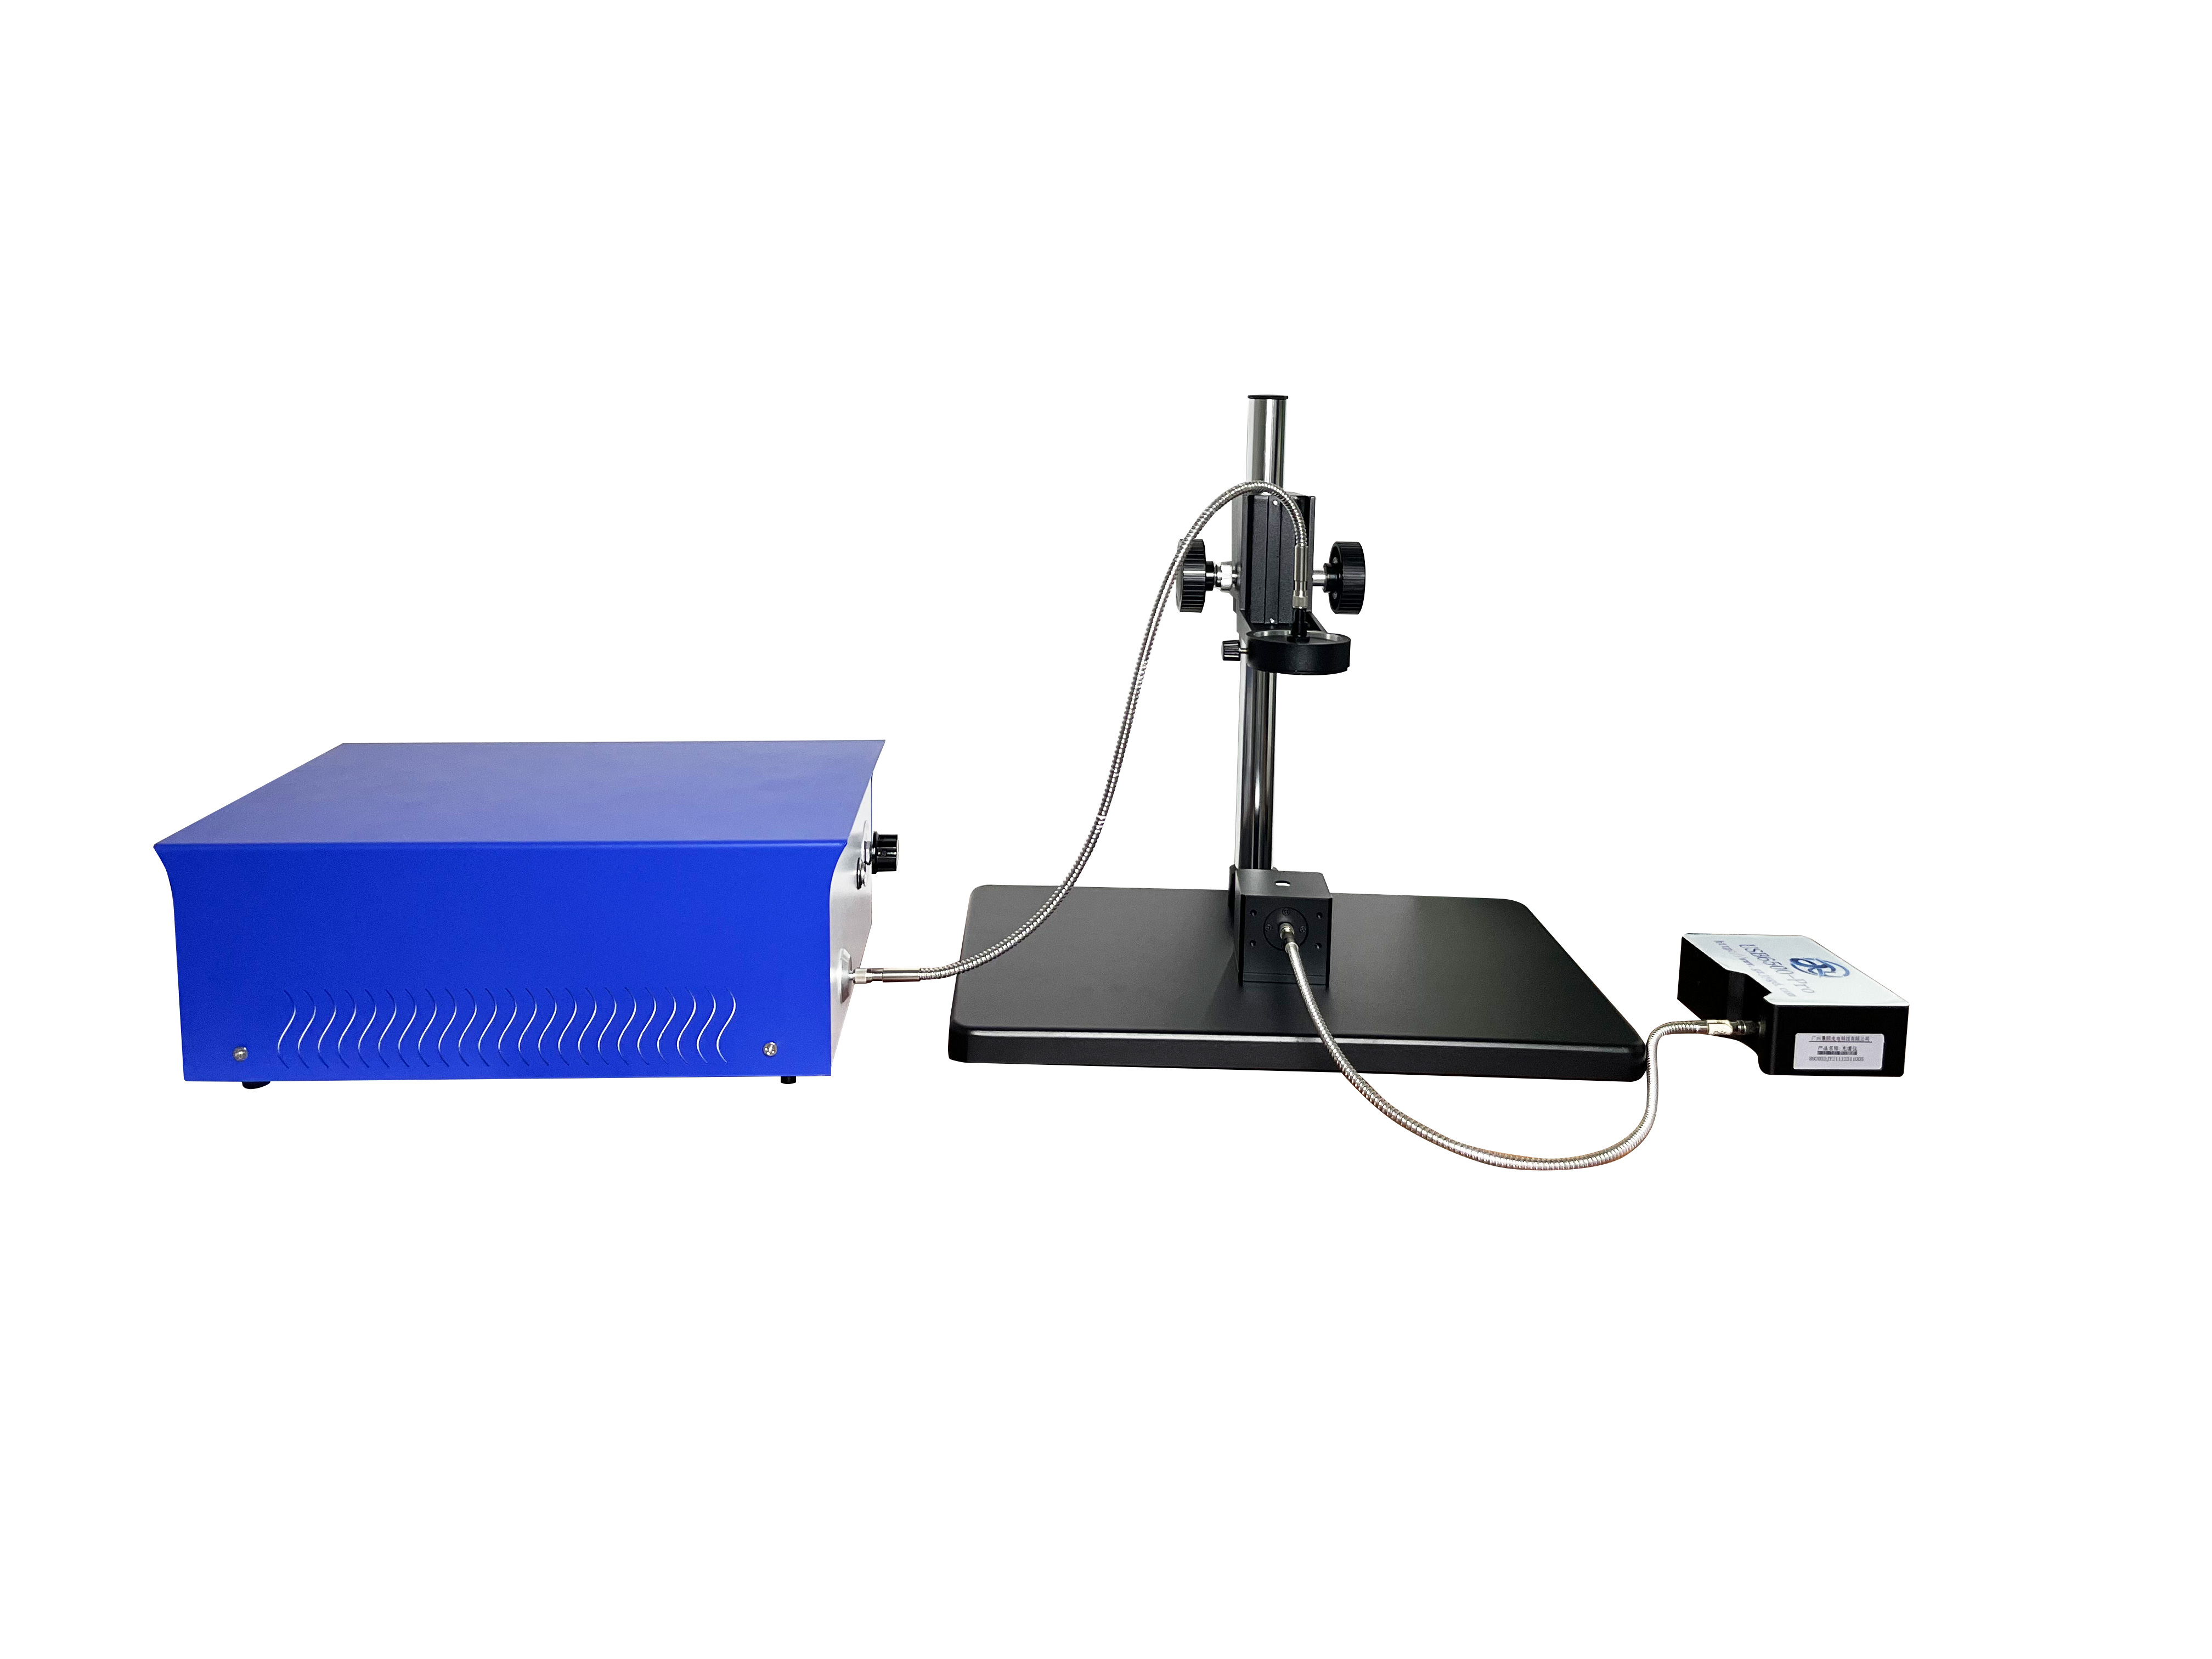
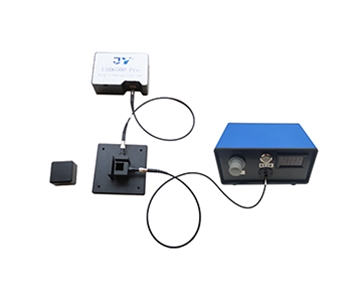
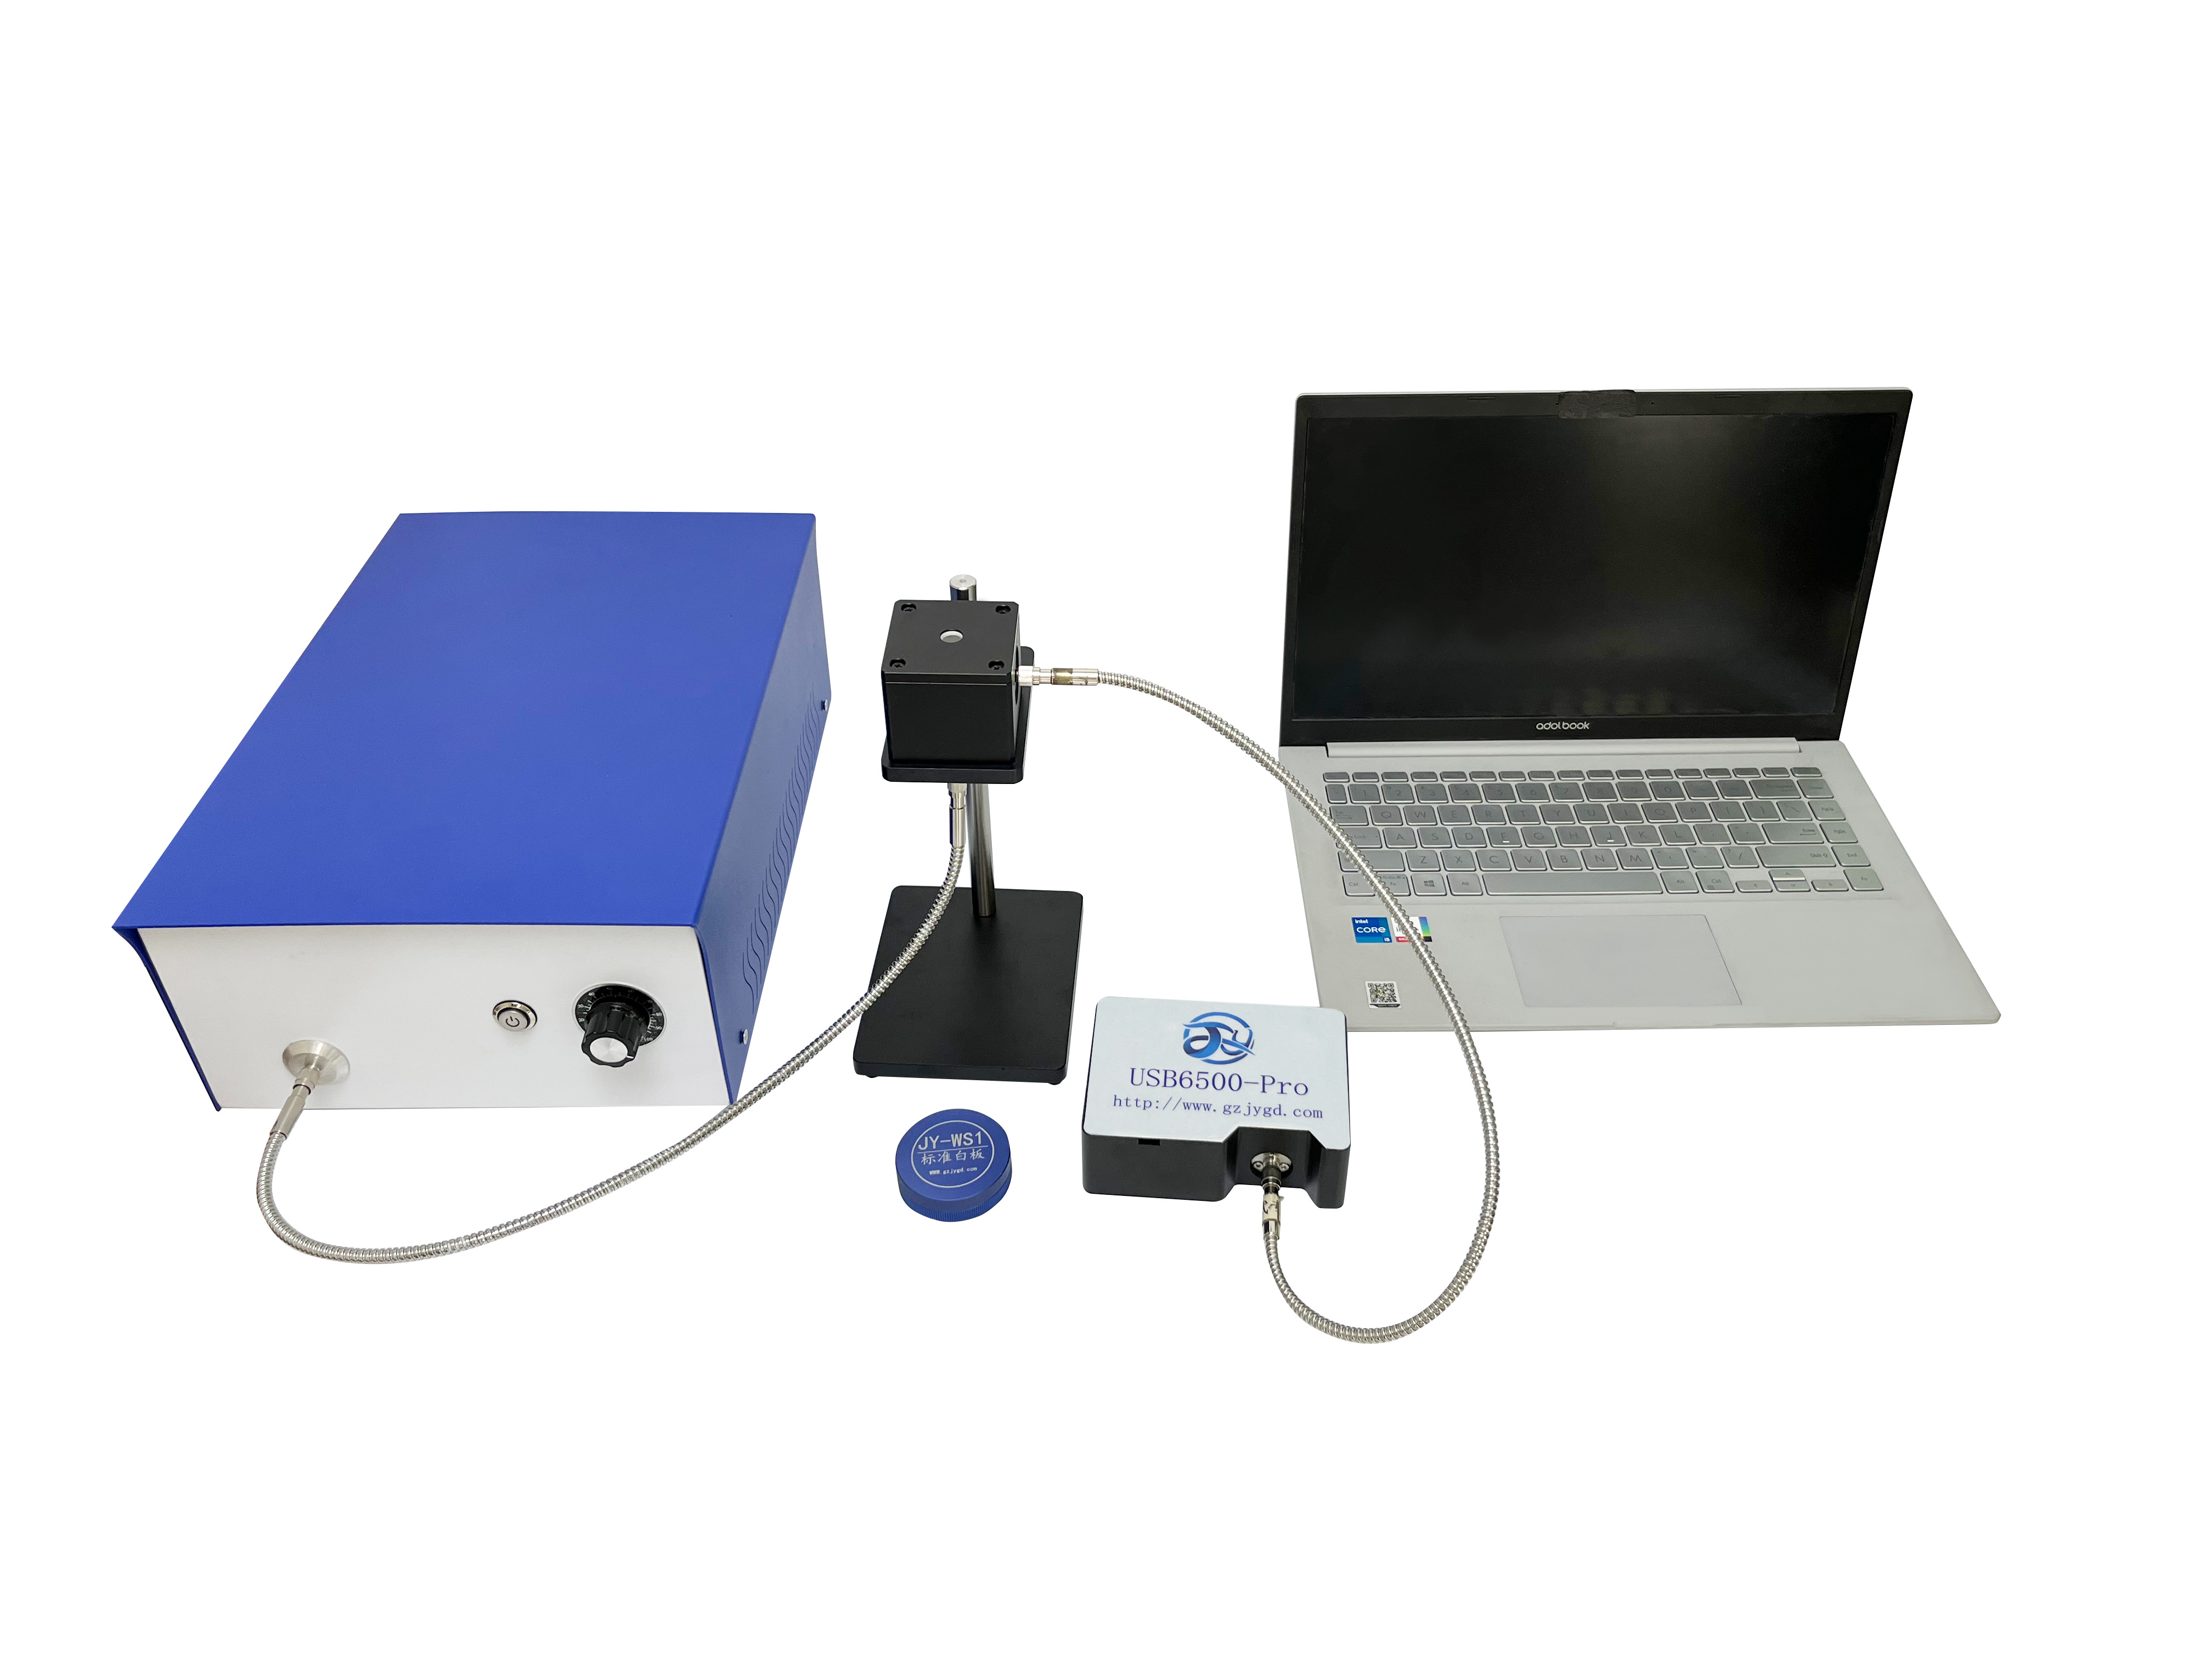
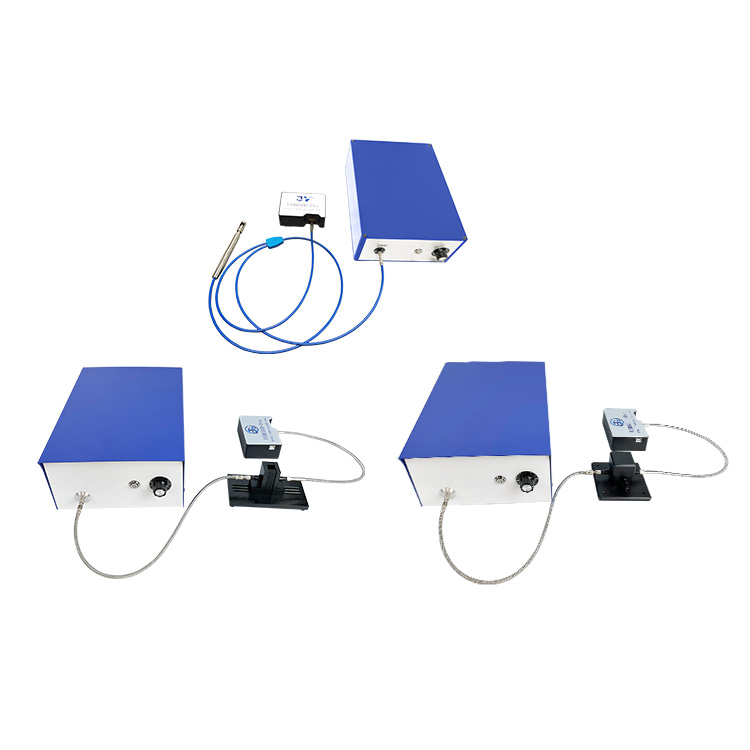
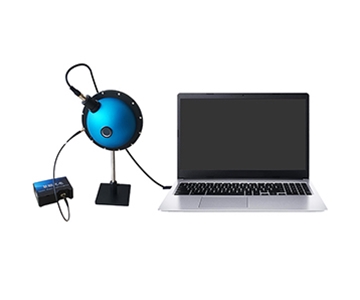
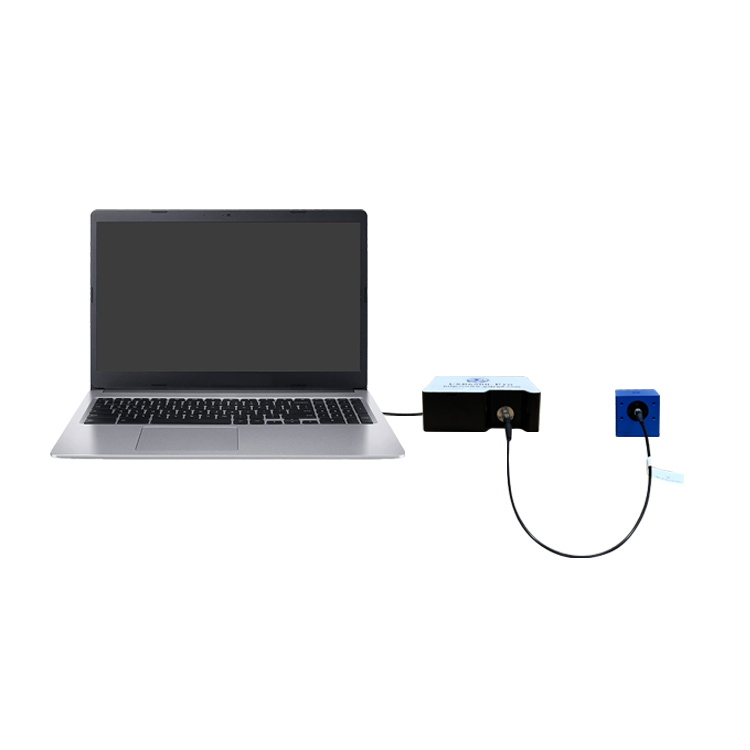
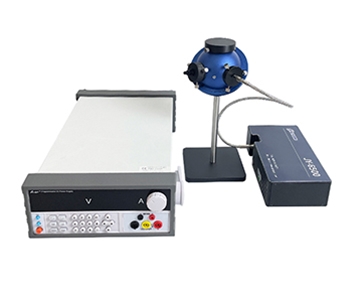
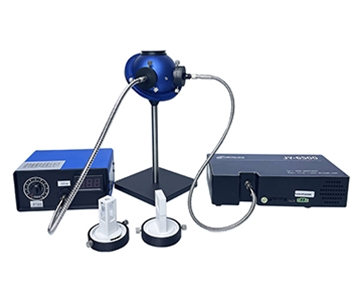
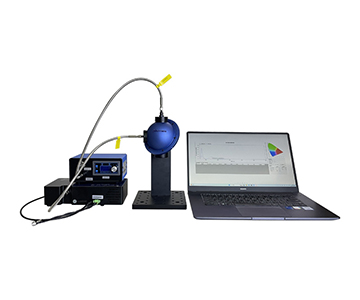
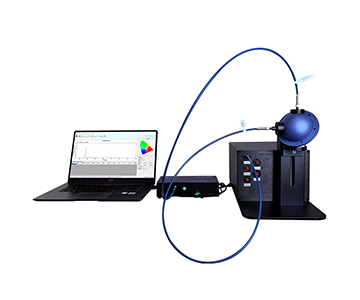
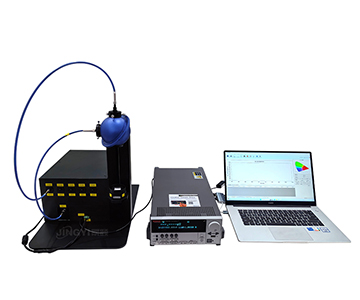
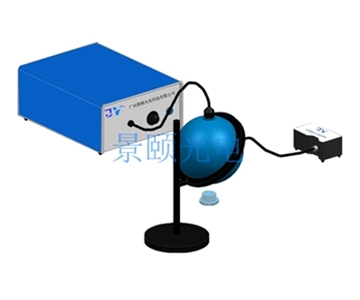
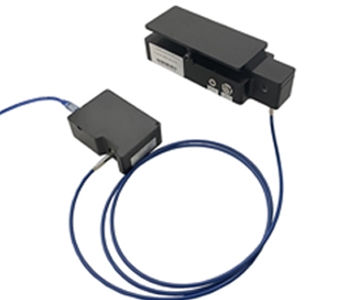
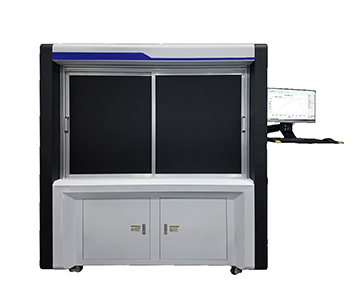
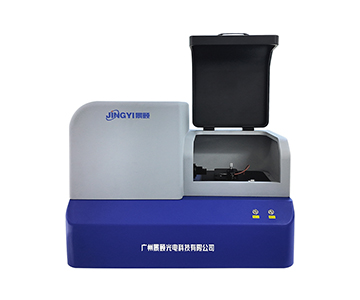
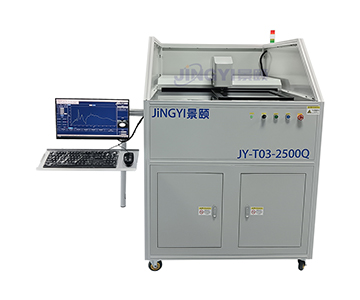
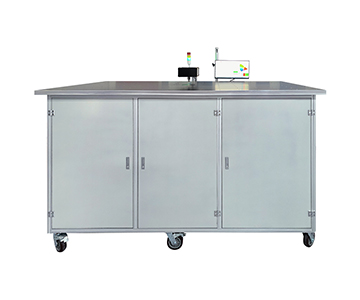
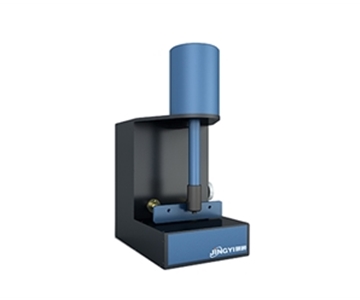
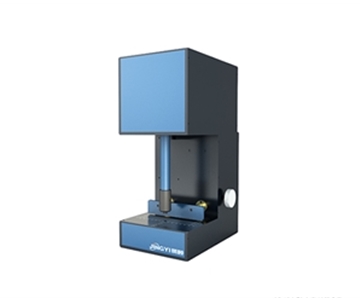
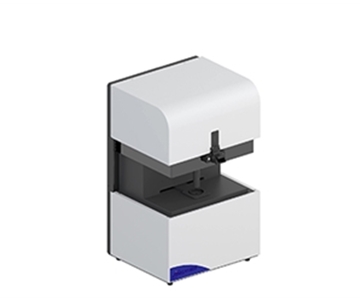
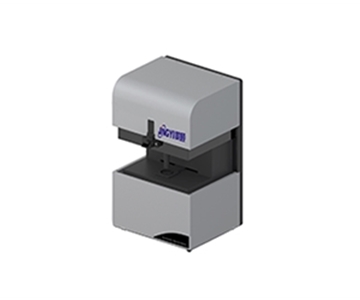
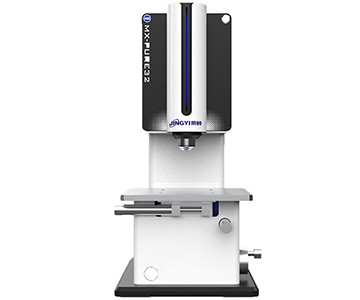
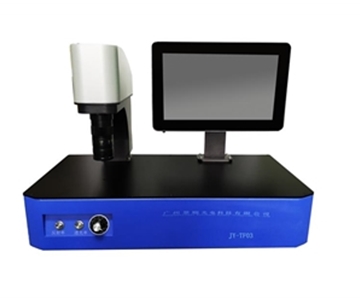
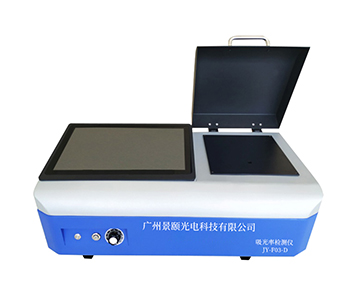
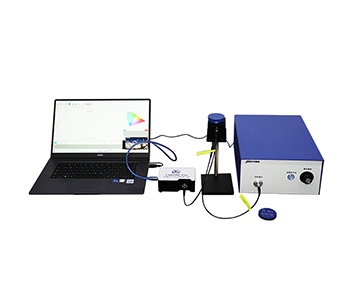
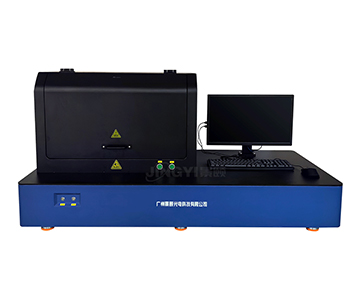
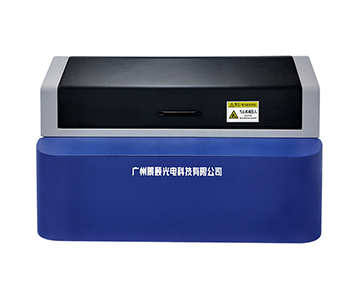
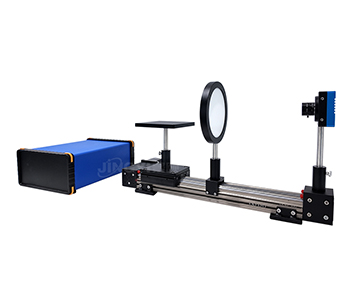
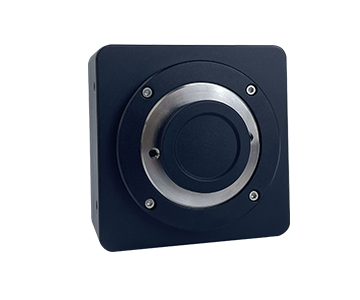
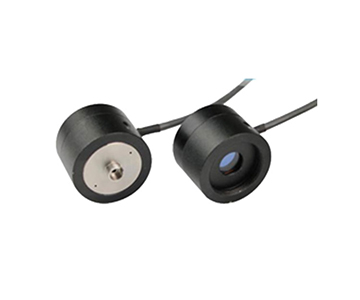
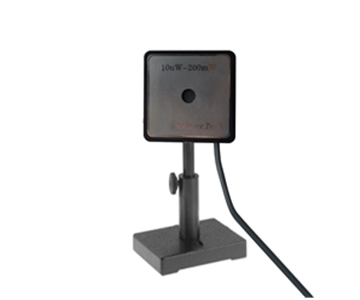
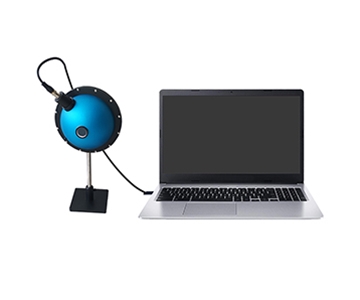
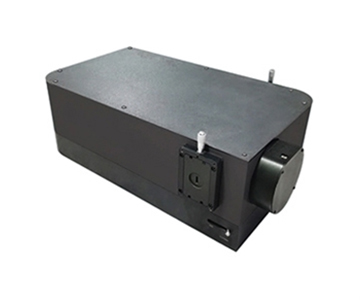
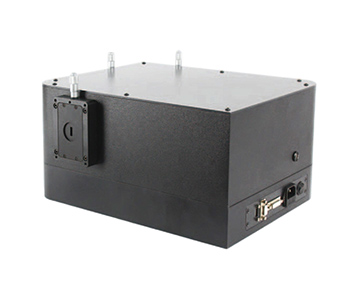
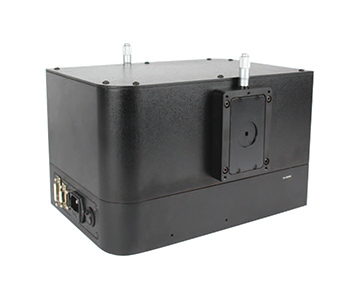
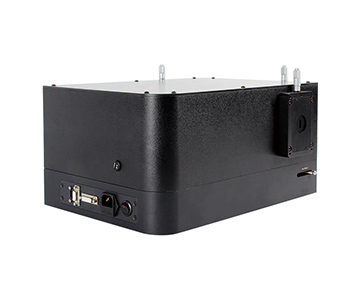
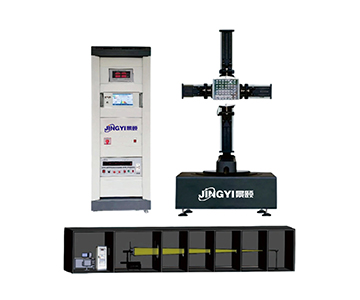
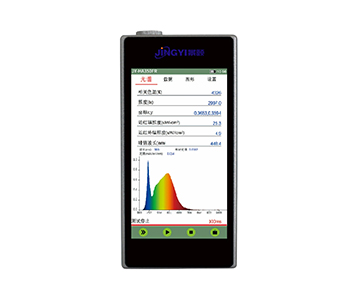
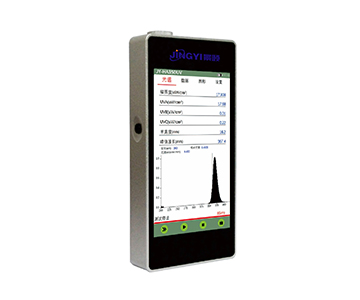
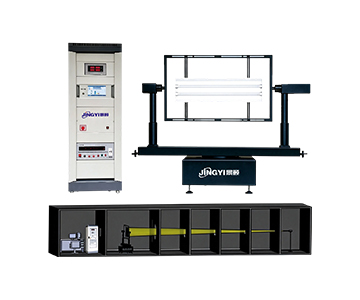
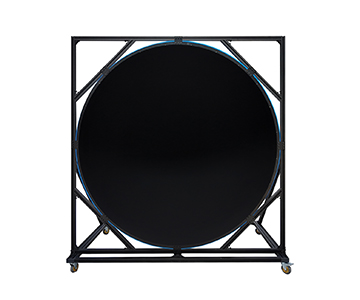
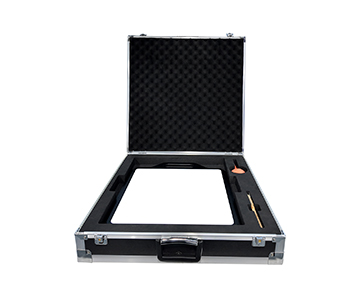
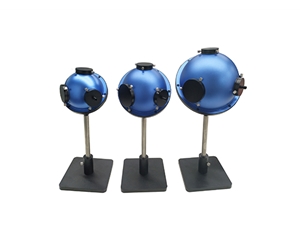
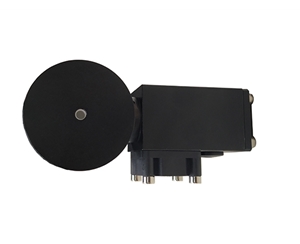
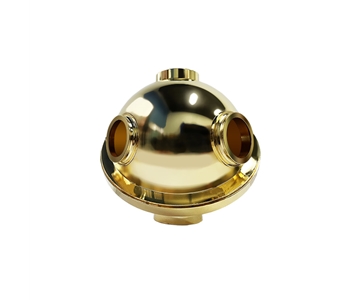
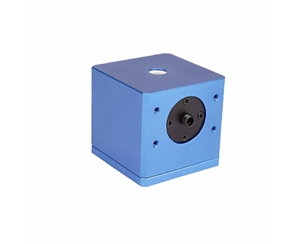
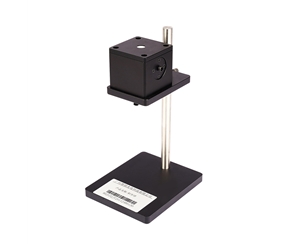
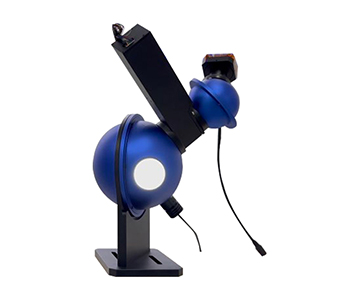
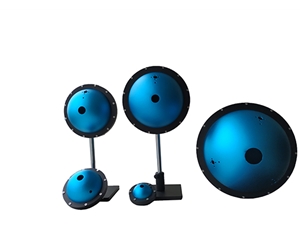
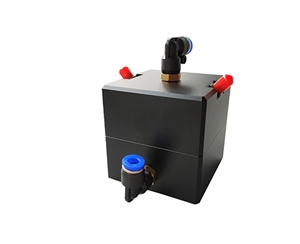
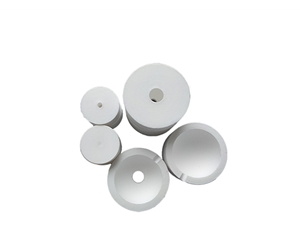
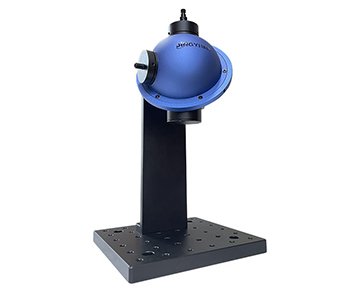
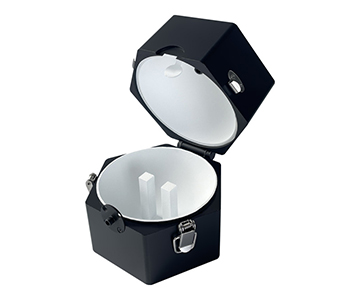
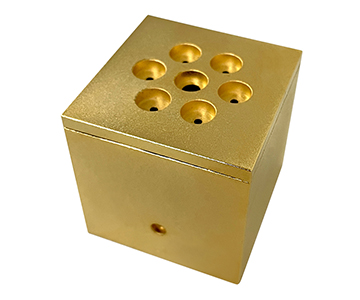
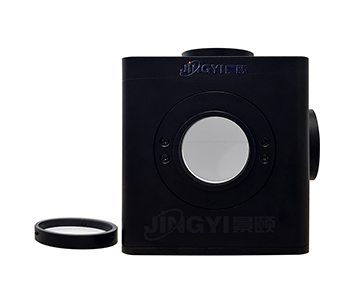
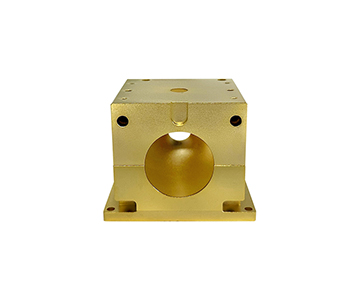
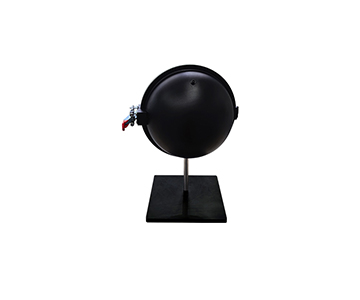
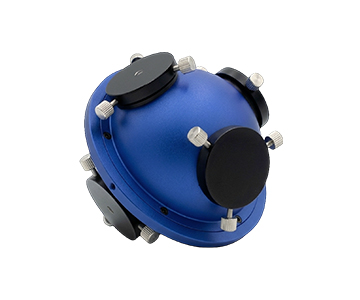
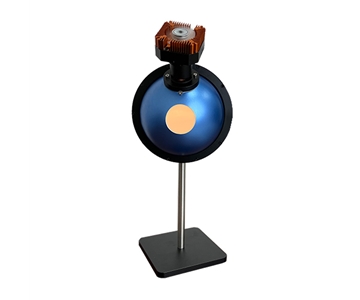
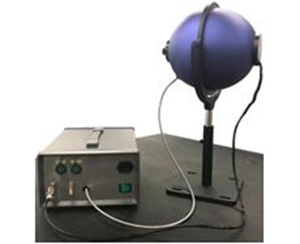
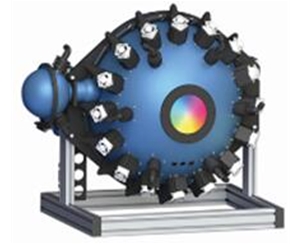
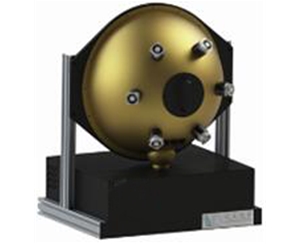
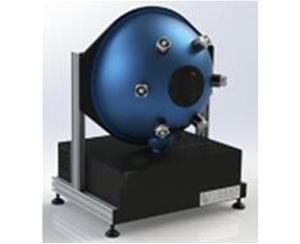
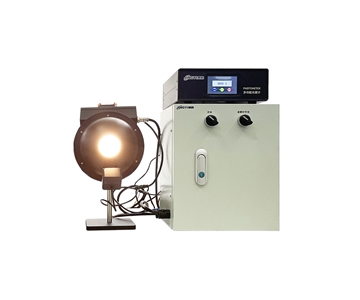
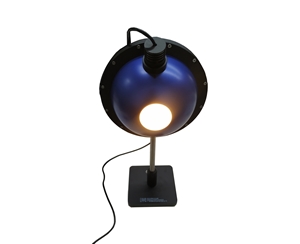
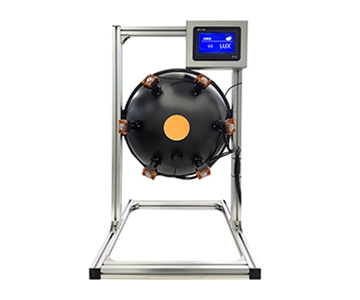
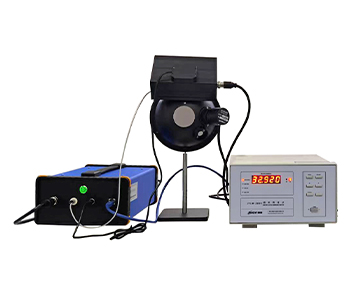
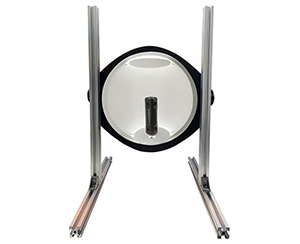
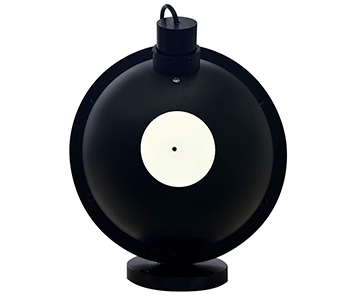
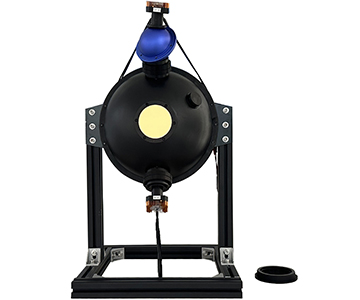
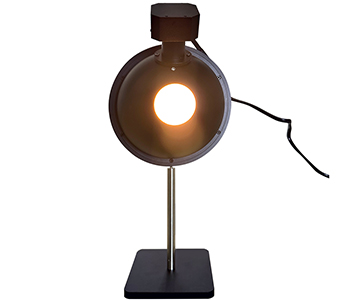
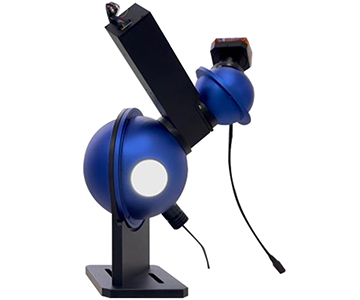
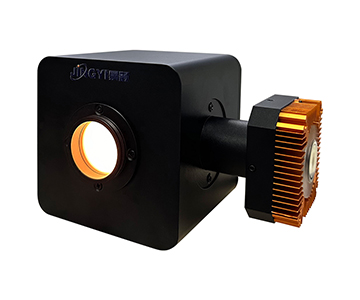
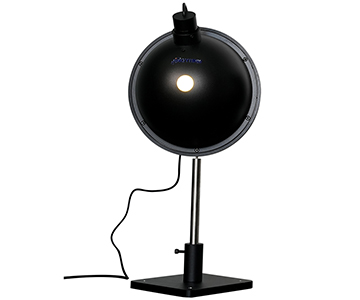
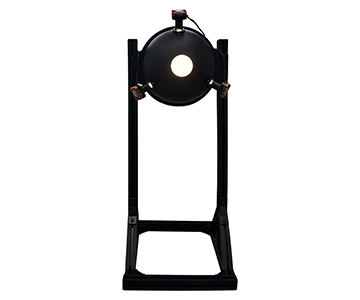
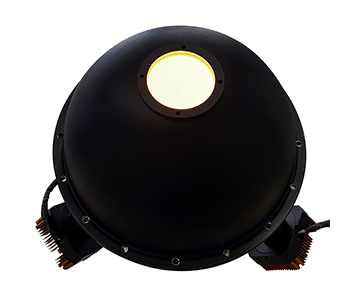
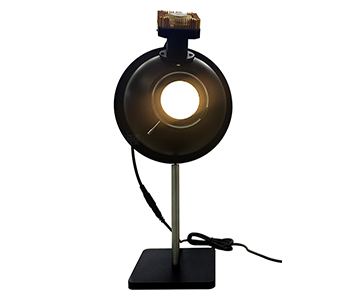
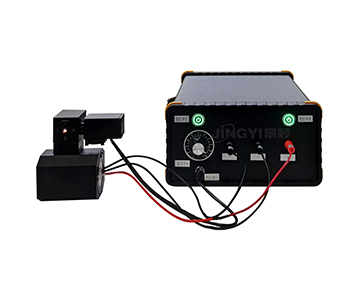
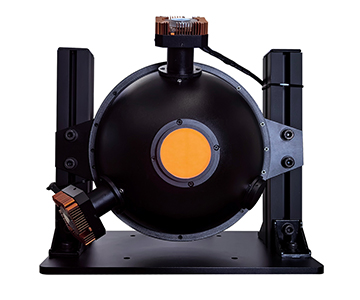
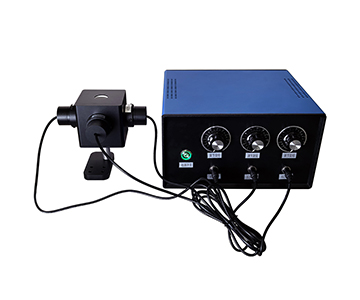
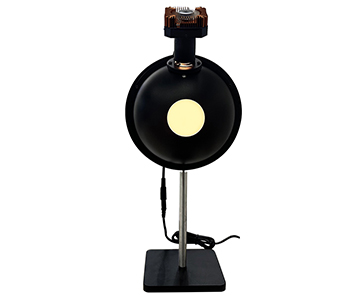
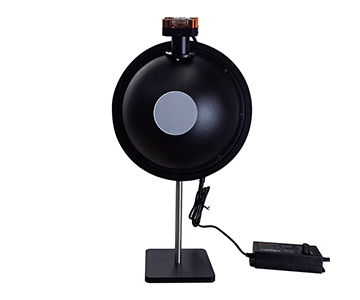
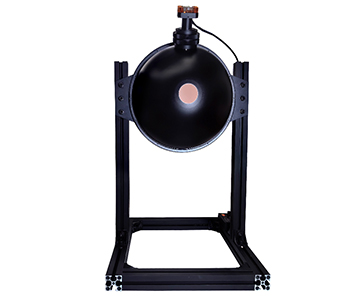
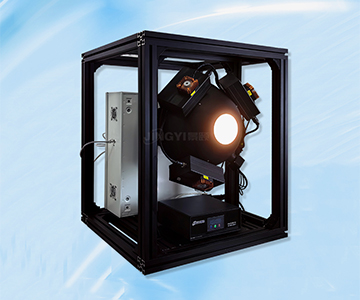
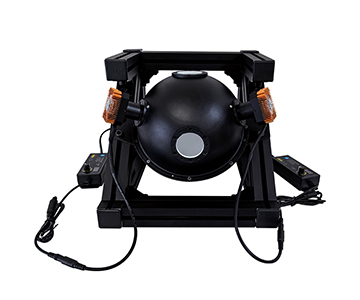
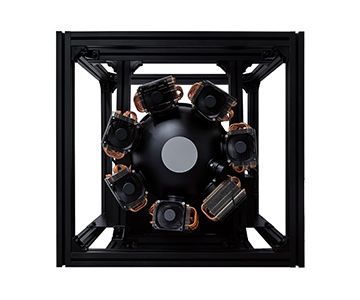
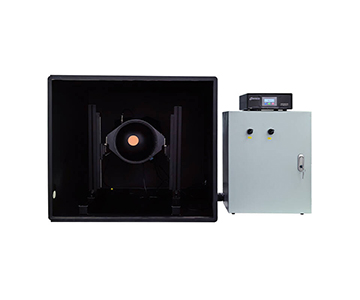
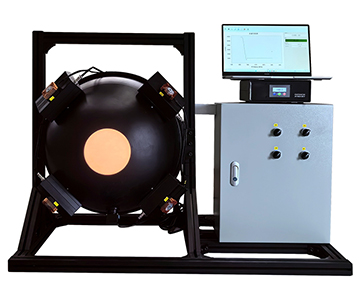
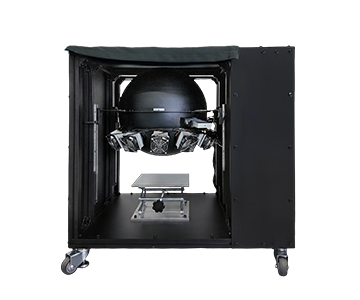
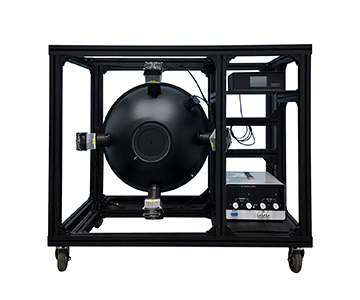
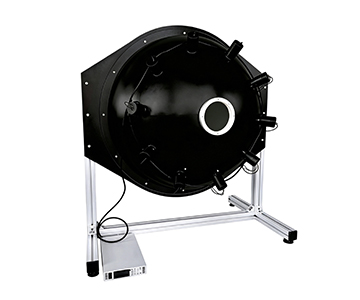
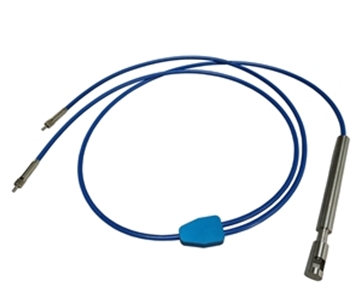
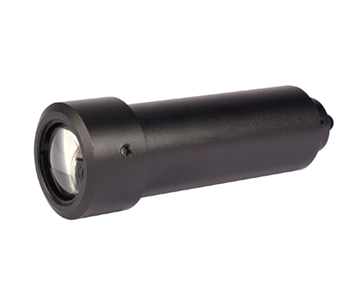
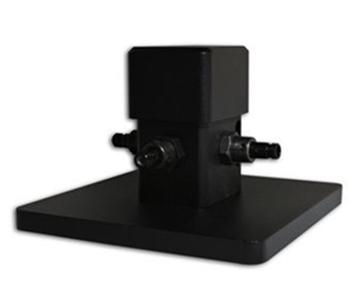
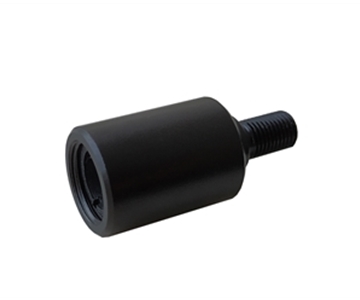
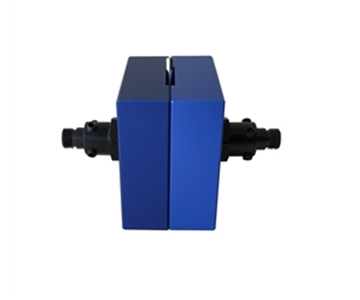
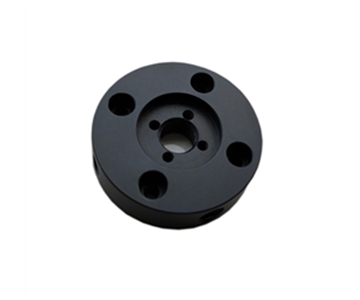
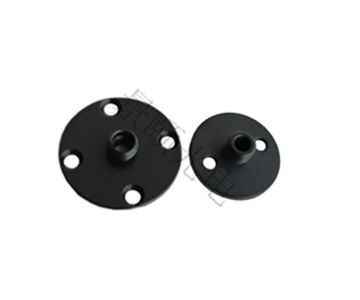
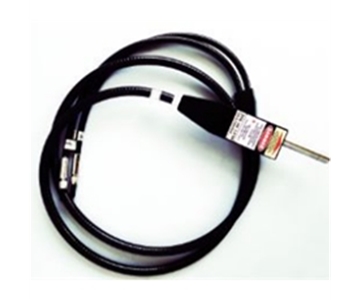
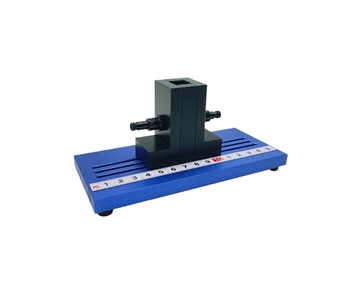
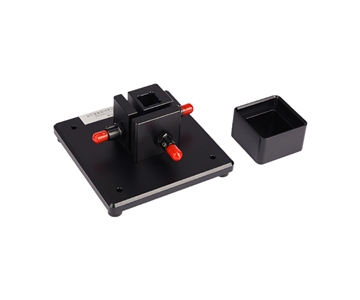
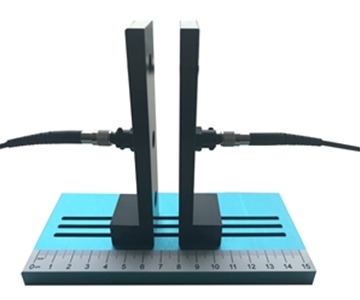
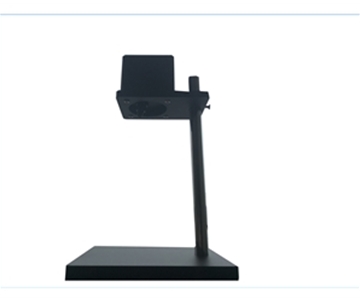
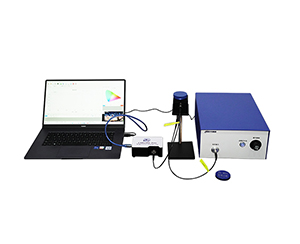
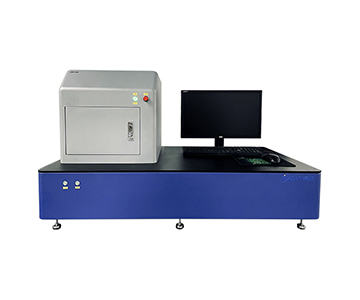
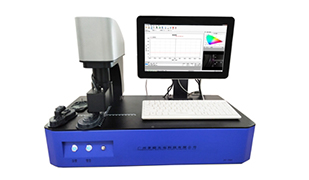
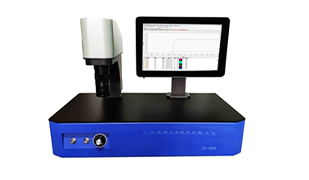
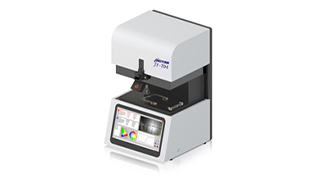
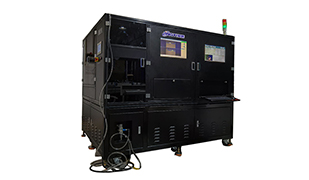
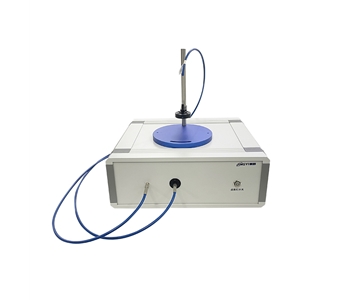
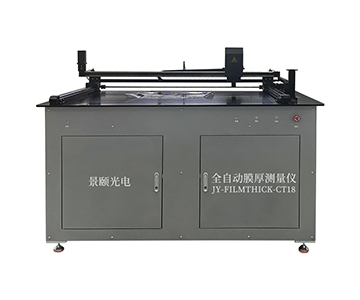
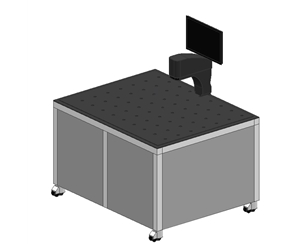
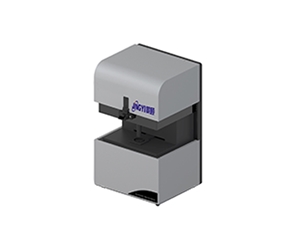
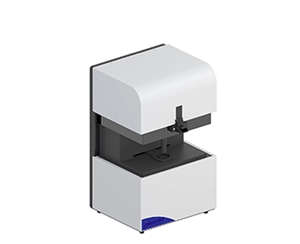
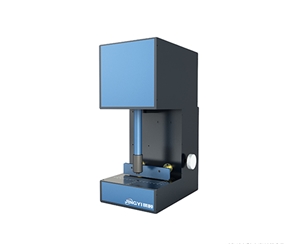
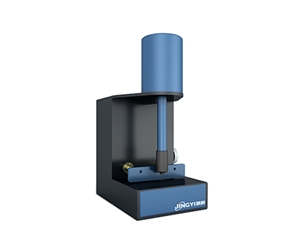
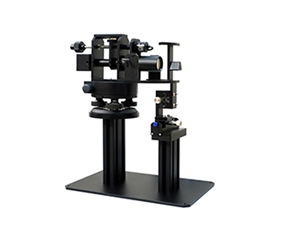
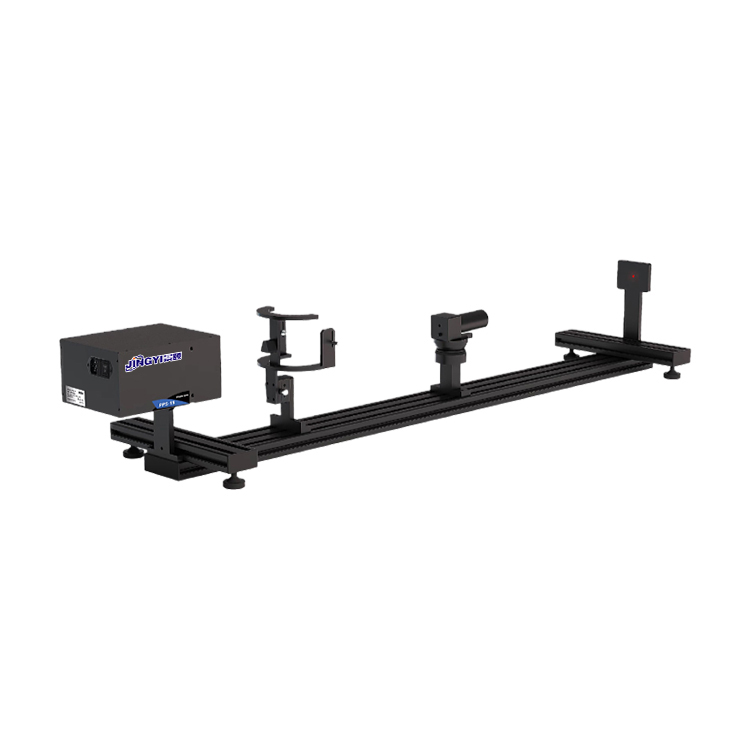
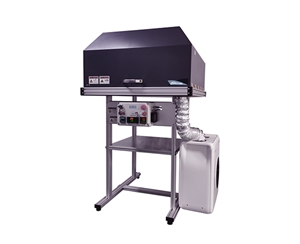
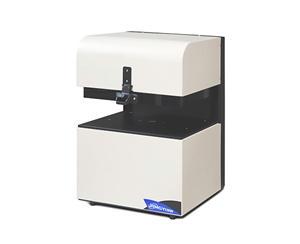
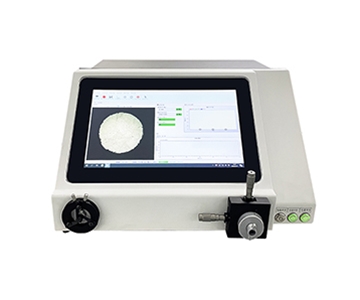
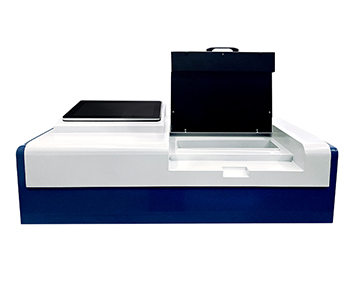
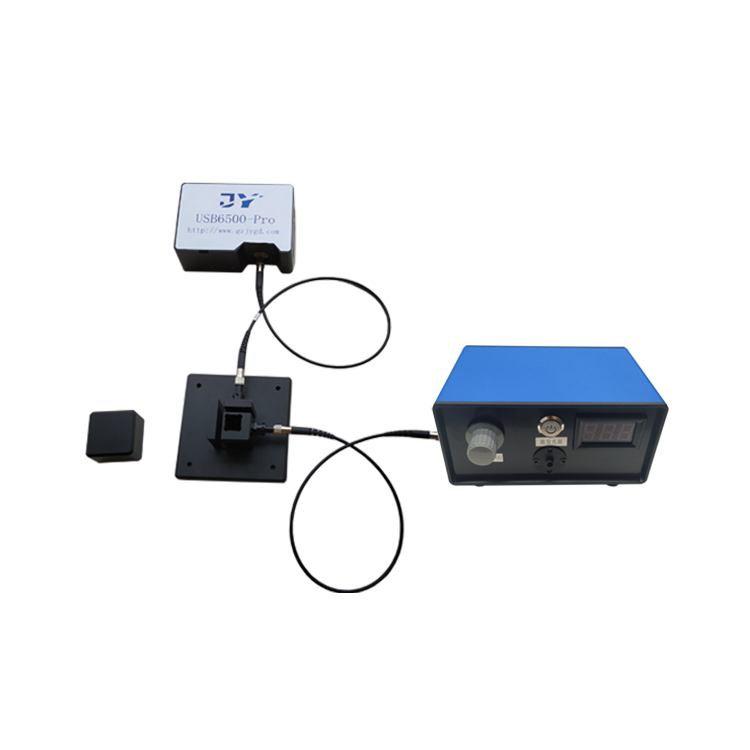
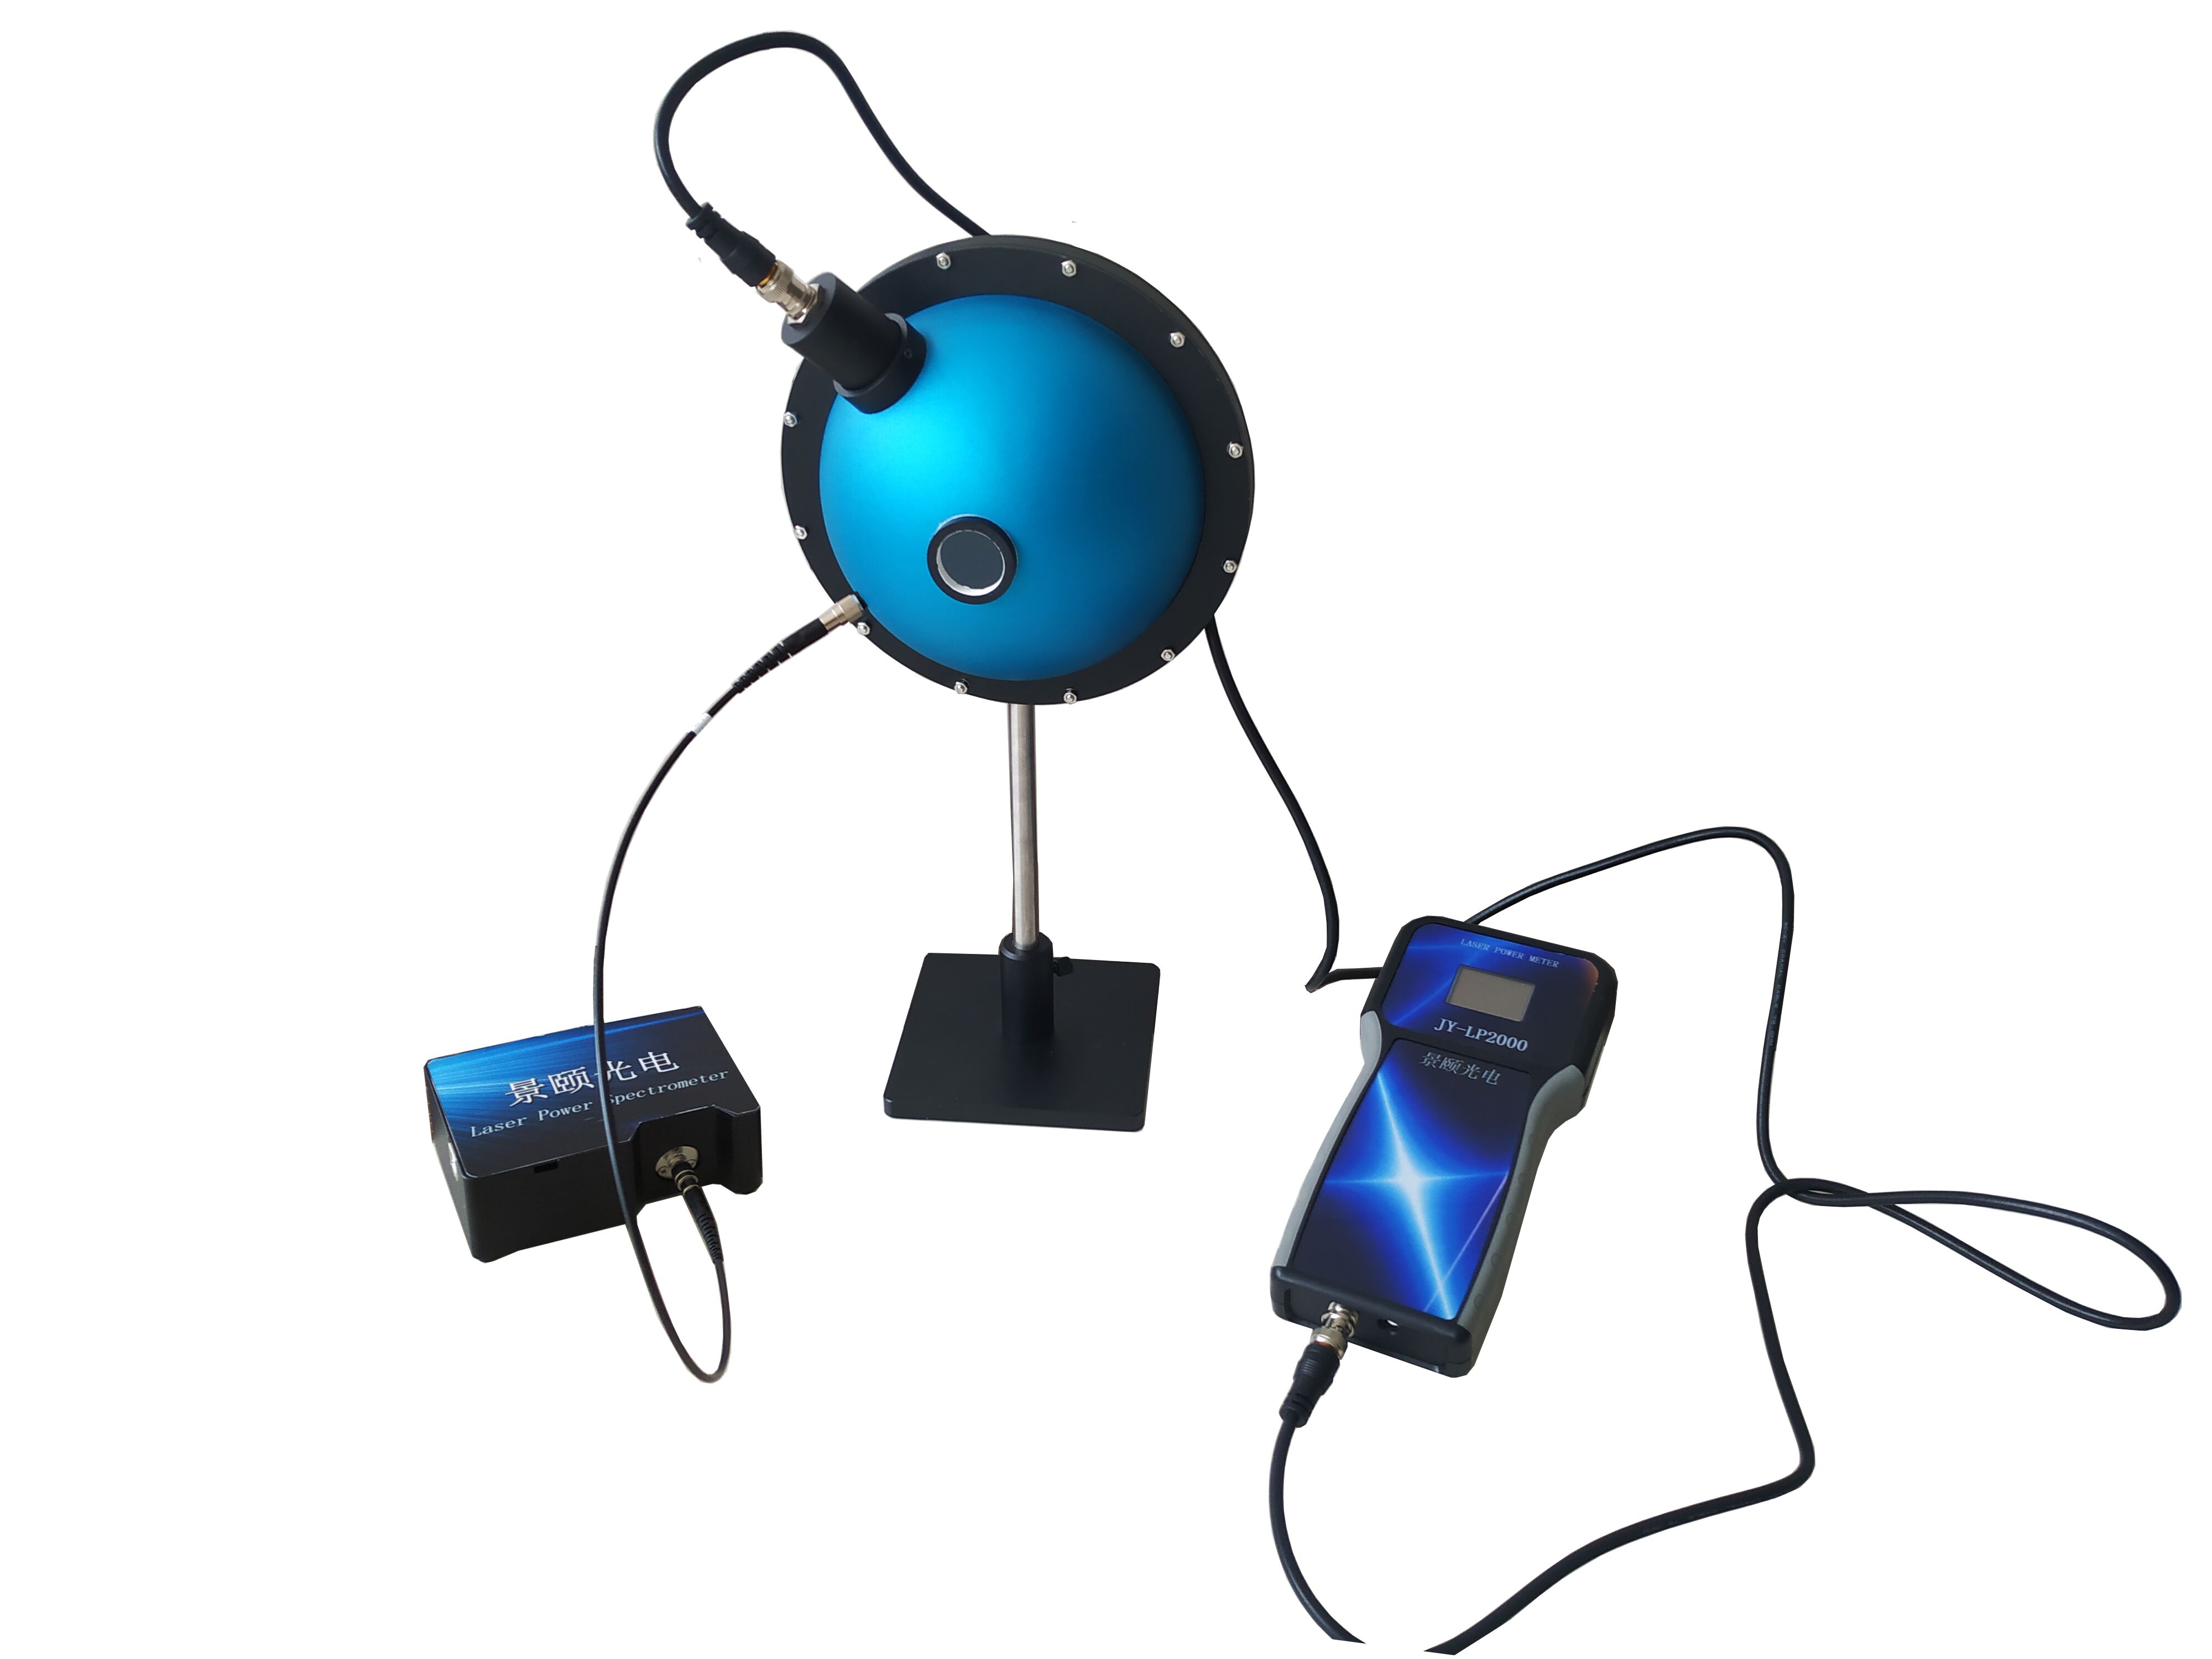
Integrating sphere power meter selection starts with wavelength accuracy, not the headline precision figure. Divergent laser sources exceed what a standard photodiode can capture, and the uncollected fraction becomes untraceable error. An integrating sphere uses repeated diffuse reflection on a high-reflectance coating to remove spatial information, so the detector receives a signal proportional to total luminous flux. Evaluated configurations span 200–1100 nm, 380–1100 nm, and 800–1650 nm, with 0.2 ms sampling, a 13 mm or 25.4 mm (0.51 in or 1.0 in) aperture, and a range from 1 nW to 100 W. Documented specifications list ±5% measurement uncertainty, ±0.5% linearity, ±2% uniformity, and NIST traceability. This guide walks buyers through wavelength matching, sphere diameter, power-tier selection, thermal limits, and a six-step proof-of-concept validation before contract signature.
Why Total Cost of Ownership Beats Bare-Board Price
A plant equipment manager rarely evaluates an integrating sphere power meter on its sticker price alone. The maintenance, recalibration, and replacement-part spend on one imported bench in a single year can cover several domestically built mainline units. The number that survives a budget review is the three-year total cost of ownership (TCO), not the quote on the configurator.
Three procurement traps surface repeatedly on the buyer side:
•Overstated parameters. A spec sheet advertises high reflectance while the delivered unit uses a lower-cost coating.
•Low-entry pricing. The bare-board quote looks attractive, but attenuators, software licensing, and annual recalibration are each billed separately.
•Model mismatch. The verbal pitch does not align with the parameter table, and by the time the discrepancy is caught the contract withdrawal window may have closed.
A more subtle failure follows a different timeline. A budget-tier unit arrives with clean numbers, then six months later the coating reflectance drops by a few tenths of a percent and the entire calibrated dataset drifts with it. That kind of latent drift is harder to catch than a spec that was wrong on day one, because every self-check still reports nominal.
Wavelength Accuracy Is the First Gate, Not Precision
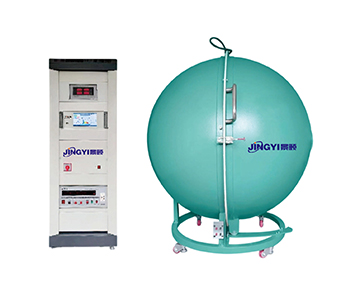
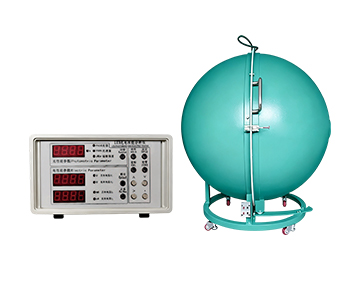
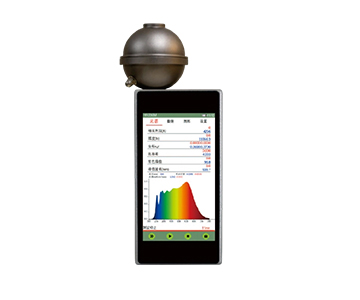
A source with a large divergence angle overwhelms a conventional detector: only part of the light is intercepted, and the remainder scatters through the workspace as error that cannot be traced back. The integrating sphere resolves this by reflecting light repeatedly off a high-reflectance inner wall until spatial information is washed out, leaving the detector a signal proportional to total flux.
The first question in any evaluation is therefore not "what is the accuracy?" but "does your wavelength fall inside the response band?" Get the band wrong and every downstream accuracy figure is turning on an empty channel.
Matching the Three Wavelength Bands
•200–1100 nm: general-purpose UV-to-near-IR coverage, mapped to a base configuration.
•380–1100 nm: the visible-to-near-IR workhorse band, common for laser diodes and modules.
•800–1650 nm: near-IR-dedicated coverage, including the 1550 nm telecom band.
No single unit covers every band. A 405 nm violet source belongs in the 200–1100 nm tier; a 1550 nm telecom measurement requires the 800–1650 nm tier. Cross-band use produces readings that should not be trusted, so a unit bought for the wrong band is a display that reads cleanly without measuring what you need.
Acceptance Action Under a Wavelength-Accuracy Lens
At receipt, do not stop at the nominal wavelength range. Cross-check on the actual station against a reference source with a known spectral line. If the deviation exceeds the negotiated threshold, trace the coating and detector matching before adjusting software coefficients — compensating in software does not repair a physical mismatch.
Seven Selection Dimensions, Broken Down
1. Wavelength Coverage and Detector Matching
The three bands above are the starting filter. Measure 405 nm violet in the 200–1100 nm tier; measure 1550 nm telecom only in the 800–1650 nm tier. Every other dimension is downstream of this one.
2. Sphere Diameter and Aperture
Sphere diameter is offered in 50, 84, 100, 125, and 150 mm. The aperture is 13 mm on the 50 mm sphere and 25.4 mm (1.0 in) on the other four. When the source spot approaches or exceeds the aperture, a larger sphere reduces bias from near-field occlusion — so spot geometry should drive the diameter choice, not habit.
3. Power Tiers and Range Handoff
Three documented tiers apply:
| Tier |
Range |
Overlap behavior |
| Low |
1 nW – 0.01 W |
Overlaps the middle tier |
| Middle |
100 nW – 1 W |
Overlaps both neighbors |
| High |
10 mW – 100 W |
Overlaps the middle tier |
Adjacent tiers overlap by design. Place the common operating power in the middle of a tier rather than riding its edges, where drifts push readings out of the linear region.
4. Sampling Speed and Line Takt
Sampling time is 0.2 ms. When a QC line must capture a dozen points per second, 0.2 ms means a point is read the moment it is lit, with no wait for the second-scale settling a thermopile would require. Confirm the takt budget against this number before committing.
5. Attenuators and the Thermal Limit
The high-power tier depends on a front-end attenuator to pull over-range light back into the linear region. The documentation states plainly that the measurable power depends on the thermal limit of the sphere's internal coating or material — the 100 W ceiling is not reached simply because it is printed on the sheet. Running at the top of the range for long periods accelerates coating aging.
6. Interface and Data Acquisition
A USB 2.0 interface with dedicated software returns optical power data in one step and supports real-time analysis. When the QC line must feed a MES, this step determines whether integration is a configuration task or a second development project.
7. Compliance and Calibration
Traceability is documented to NIST, with ±5% uncertainty and better than 1% power accuracy. Inside a domestic quality system, calibration by a national metrology institute is equivalent; NIST traceability favors international mutual recognition and export-facing audits. Confirm conformance to ISO/IEC 17025-calibrated reference chains, and check the remaining validity on any traceability certificate before the purchase order is cut.
Horizontal Comparison: By Tier, Not by Brand
Comparing without naming vendors, the market sorts into three structural tiers anchored to the documented parameters:
| Tier |
Pricing band |
What you get |
Where it shows limits |
| Import reference |
$200K+ |
Absolute spectroradiometric calibration strength, international inter-comparison |
Higher annual maintenance and recalibration load |
| Domestic mainstream |
~$100K |
0.2 ms sampling, ±0.5% linearity, ±2% uniformity, NIST traceability bundled |
Adequate for offline sampling and online monitoring of divergent sources |
| Domestic economy |
~$50K |
Lower entry price |
Attenuator, software license, and annual recalibration often billed separately |
Read the numbers together rather than in isolation. The mainstream domestic tier bundles 0.2 ms sampling, ±0.5% linearity, ±2% uniformity, and NIST traceability into one configuration, which is sufficient for offline sampling and online monitoring of divergent-source power tests. The import reference tier earns its position in international comparison and absolute spectroradiometric calibration. The economy tier is cheaper up front, but attenuators, software licensing, and yearly recalibration are commonly priced apart, so the landed total must be added up by hand.
POC Validation: Six Steps Before You Sign
A proof-of-concept run on the actual station closes the gap between a spec sheet and a production line.
1.Receipt check and dark level. Verify the serial number against the factory certificate and log unboxing temperature and humidity. Capture a baseline with no light present and confirm dark noise stays below 0.01% of full scale.
2.Wavelength cross-check. Compare against a known-line reference source on the real station. Push any deviation past the negotiated threshold back for investigation rather than software compensation.
3.Photometric calibration comparison. Let a standard lamp calibrated by a higher-level metrology body stabilize at rated current, compare against the unit reading, and write the coefficient into the configuration file.
4.Multi-point linearity sweep. Take 3–5 power points in each of the low, middle, and high tiers, covering the 1 nW–100 W overlap, and confirm deviations land inside the ±5% uncertainty band.
5.Repeatability test. Measure one stable source ten times consecutively and compute the relative standard deviation as the pre-launch baseline.
6.Light-tight and stray-light audit. Stray light at flanges and interfaces can consume a few tenths of a percent; run a shielded-vs-unshielded comparison at acceptance.
Pre-Purchase Checklist: Ten Questions
1.Does your wavelength fall inside 200–1100, 380–1100, or 800–1650 nm?
2.Which sphere diameter — 50, 84, 100, 125, or 150 mm — and does it match the spot?
3.Aperture 13 mm or 25.4 mm (0.51 in or 1.0 in), and has near-field occlusion been evaluated?
4.Which tier does your common power sit in, and is it near the tier midpoint?
5.For high-power use, is the attenator standard or optional?
6.Can 0.2 ms sampling keep up with the line takt?
7.Is the traceability certificate from NIST or another body, and how much validity remains?
8.Does the USB 2.0 software include data export and a secondary-development interface?
9.Does the shop floor hold 5–50°C (41–122°F) and below 70% RH over the long run?
10.Has conformance to ISO/IEC 17025 and NIST-traceable calibration been confirmed so the traceability chain stays intact?
Five Selection Errors Engineers Keep Making
•Reading nominal precision without wavelength matching. Pick the wrong band and the ±5% uncertainty is meaningless.
•Treating 100 W as a normal ceiling. Ignore the coating thermal limit and sustained top-of-range running accelerates aging.
•Skipping light-tight at the low-power end. The 1 nW point is so sensitive to stray light that ordinary shop lighting moves the reading.
•Overlooking attenuator cost. It is absent from the quote and surfaces at delivery as a separate line.
•Trusting self-check instead of recalibration. After coating contamination the self-check still reports nominal; a standard lamp is the only honest trace-back.
Honest Limitations
An integrating sphere power meter is not a universal key. At the weak end, 1 nW is constrained by ambient stray light; at the strong end, 100 W is constrained by the thermal limit of the PTFE coating. Both ends must be re-validated under real operating conditions — a nameplate range does not hold in every scenario.
The ±5% uncertainty and better-than-1% power accuracy are documented figures. They are adequate for routine line sampling, but anything approaching sub-1% absolute metrology requires a higher-grade calibration system layered on top. No single bench carries that burden alone.
Frequently Asked Questions
Can one unit cover 1 nW to 100 W continuously?
Not simultaneously. Coverage is achieved by swapping the detector front end or switching tiers, since the high-power and low-power probe structures differ. Confirm the exact configuration before ordering.
For pulsed laser, integrating sphere or a standard probe?
Sources with large divergence and irregular spots suit an integrating sphere better; the 0.2 ms sampling time covers most pulse scenarios. Ultra-short pulses require a separate check of peak-handling capability.
NIST traceability or domestic metrology institute calibration?
NIST favors international mutual recognition and export-facing use; a national institute calibration is equivalent inside a domestic quality system. Choose according to your customer audit requirements.
With a limited budget, which tier comes first?
Set the configuration by primary wavelength and common power tier first, then fold the attenuator, software, and first-year recalibration into TCO — do not compare bare-board prices alone.
How can I independently verify the unit has not drifted?
Trace back with a higher-level standard lamp quarterly and record the drift slope. After coating contamination, recalibrate rather than relying on the unit's self-check routine.
About This Guide
Data Sources
: Product technical documentation, NIST handbook references, ISO/IEC 17025 calibration guidance, and in-house validation reports.
Author
: Cai Xiaodong, Senior Application Engineer, Jingyi Optoelectronics, 12 years in industrial precision measurement.
Disclosure
: Jingyi Optoelectronics manufactures integrating sphere power meters and related optical measurement equipment. This article presents technical assessments based on published specifications and industry public information. No compensation was received from third-party brands mentioned.
Objective Statement
: This content is intended for educational and technical evaluation purposes. Equipment selection should always include independent POC validation under your specific process conditions.
Last Updated
: November 2026
For detailed specifications and application notes on integrating sphere power meters, search "Jingyi Optoelectronics integrating sphere power meter" or visit our technical library.