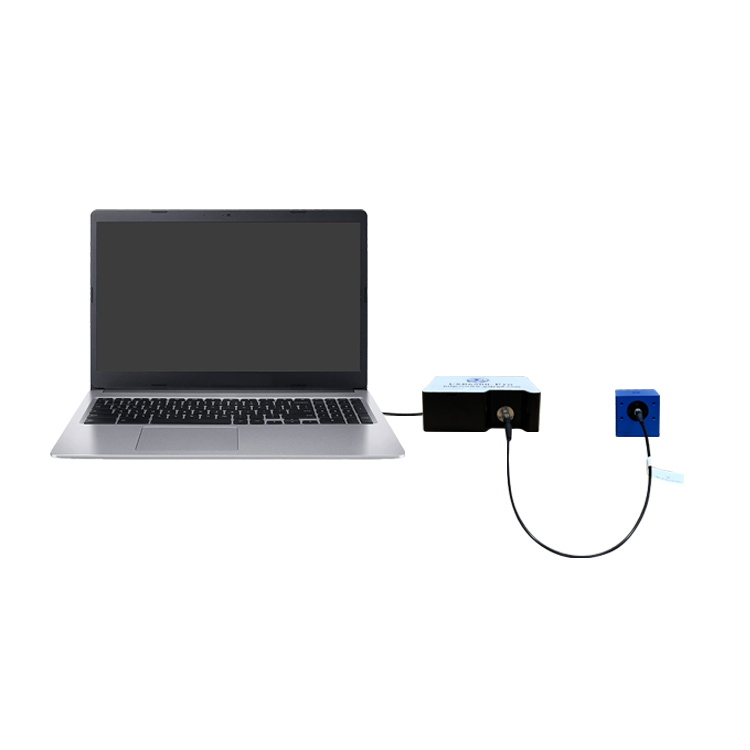
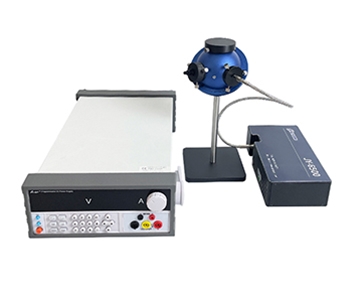
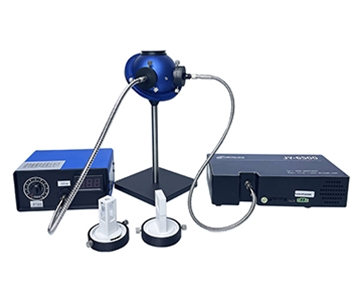
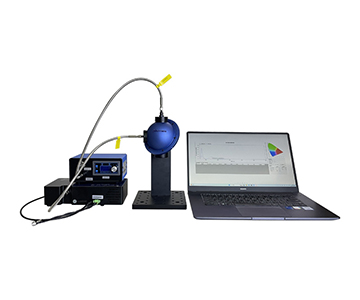
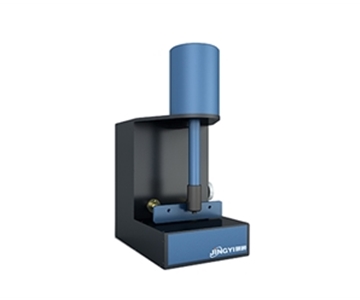
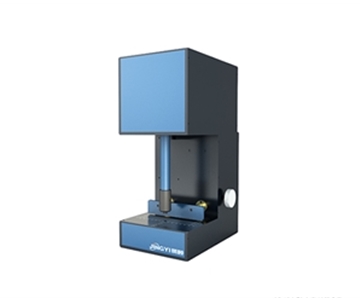
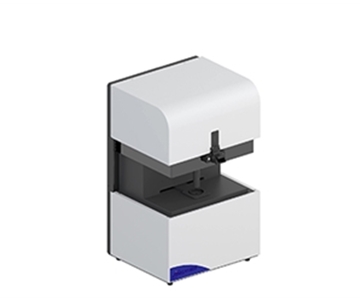
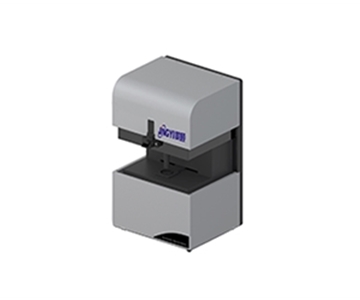
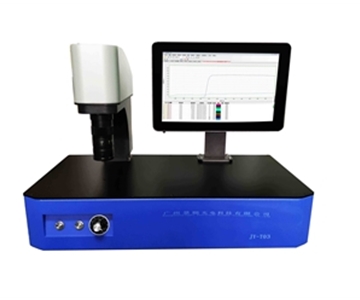
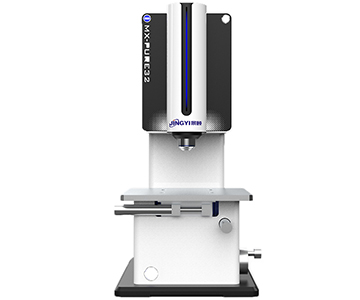
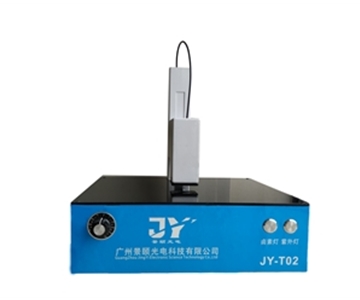
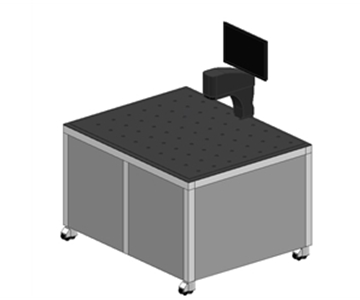
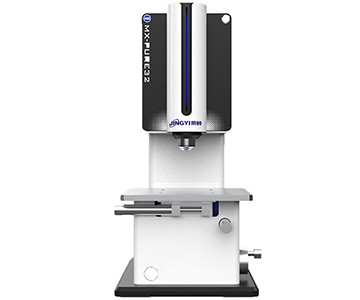
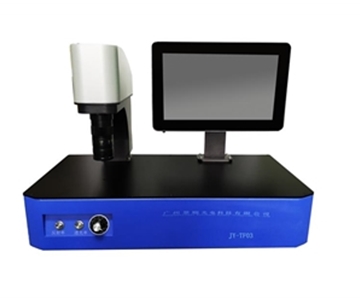
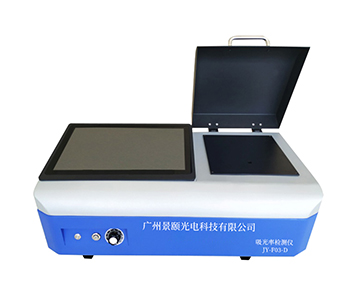
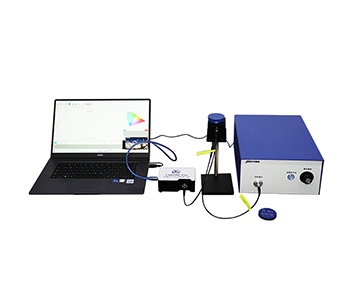
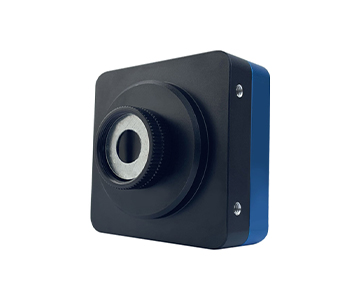
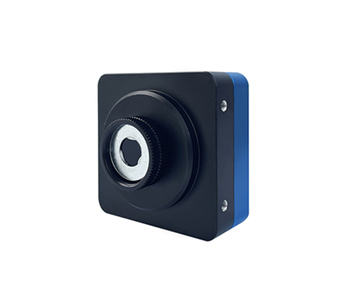
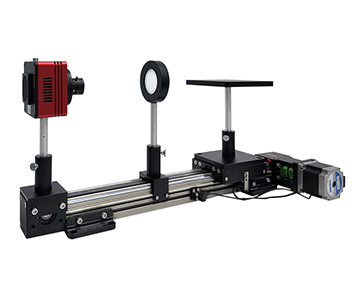
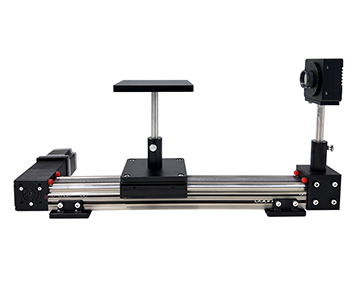
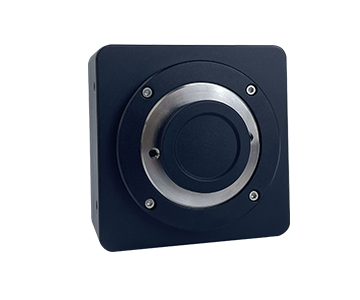
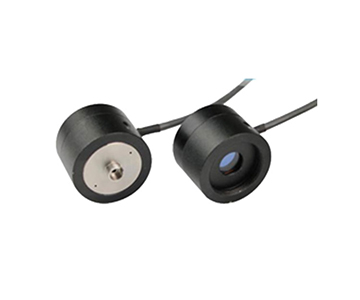
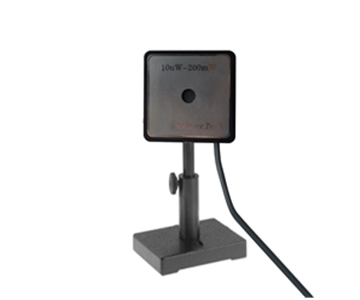
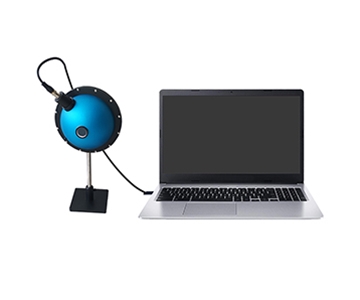
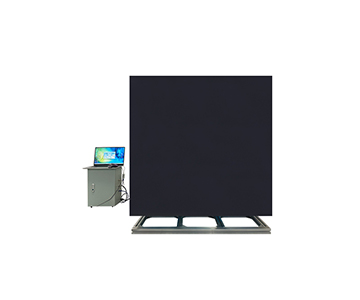
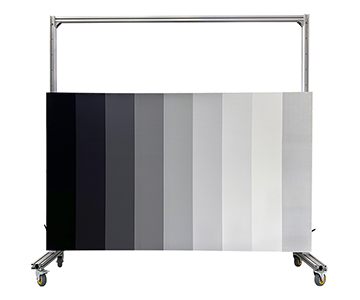
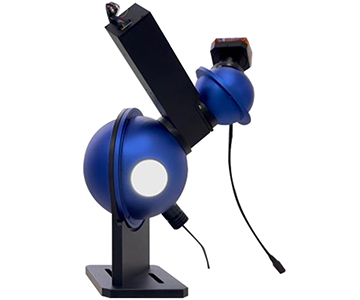
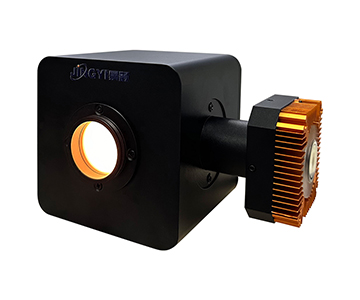
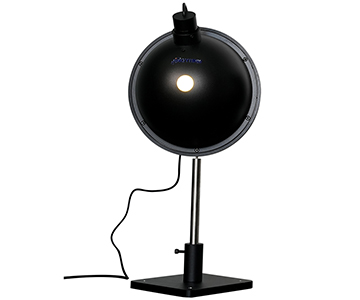
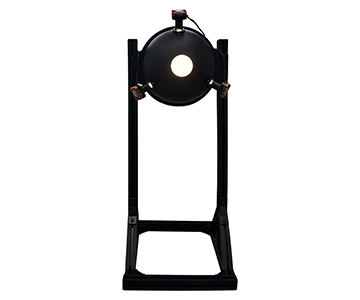
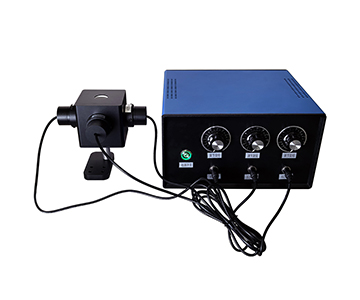
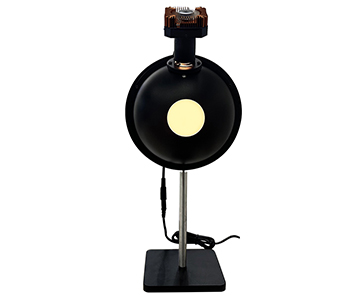
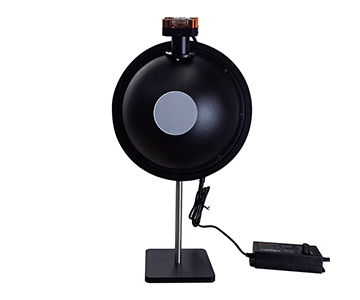
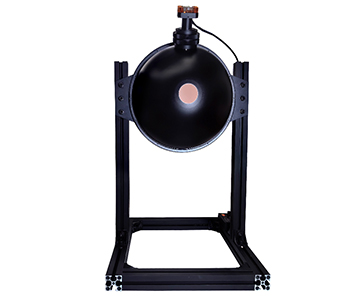
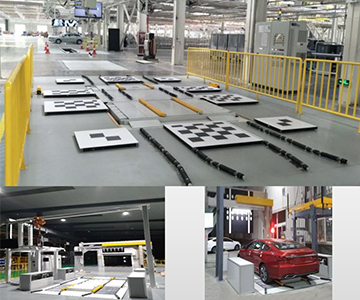
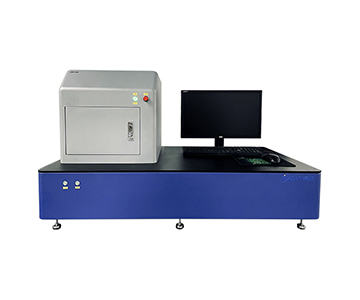
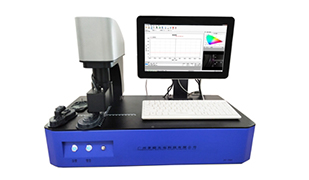
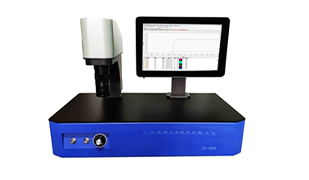
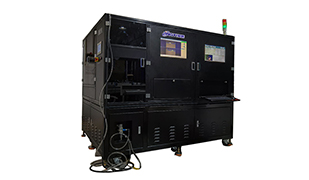
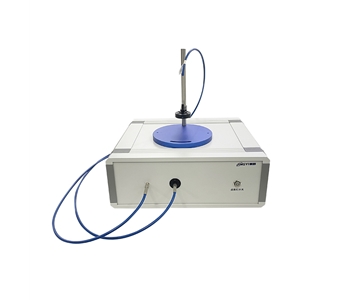
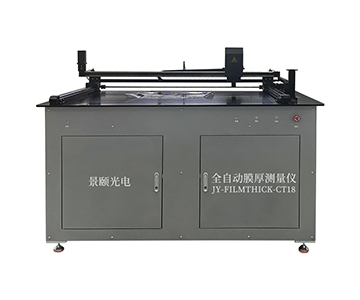
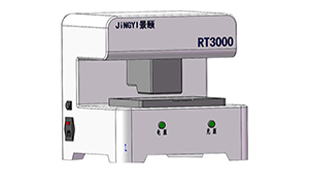
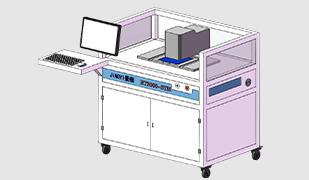
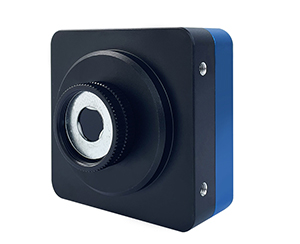
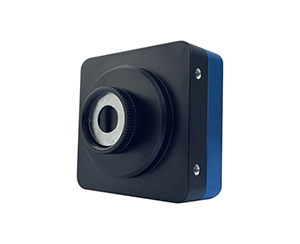
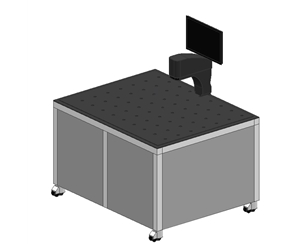
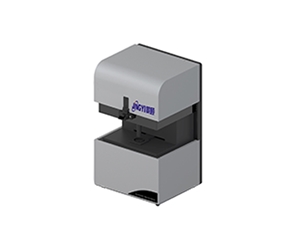
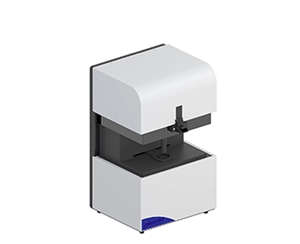
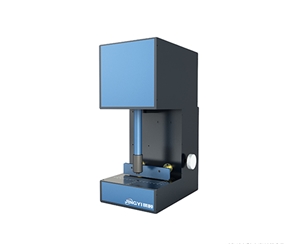
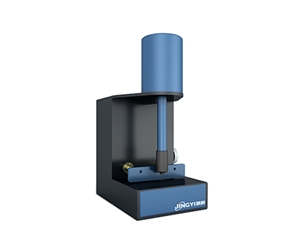
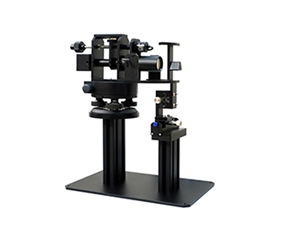
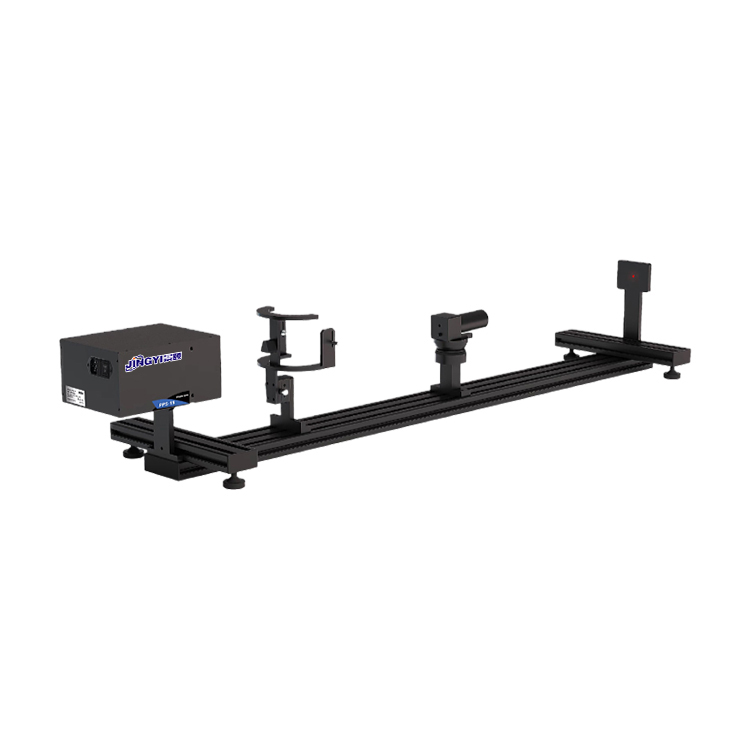
Beam profiling for LiDAR emission calibration fails when three variables drift out of tolerance: far-field spot clipping, centroid jitter under coarse pixels, and attenuation nonlinearity at the operating wavelength.
This guide compares large-format CMOS, near-infrared InGaAs, and uncooled mid-infrared platforms across sensor areas from 3.2 mm (0.126 in) to 22.4 mm (0.882 in), pixel pitches from 2.5 μm to 17 μm, and frame rates from 7.25 fps to 227.7 fps. Four supplier architectures are evaluated against external optics alignment, far-field divergence, and energy-distribution consistency, with a proof-of-concept protocol buyers can run on their own laser source before committing capital.
Emission-module calibration answers three questions: where the beam lands, how wide it is, and how energy is distributed across it. Miss any one and ranging consistency collapses during volume production, often after tooling has already been released.
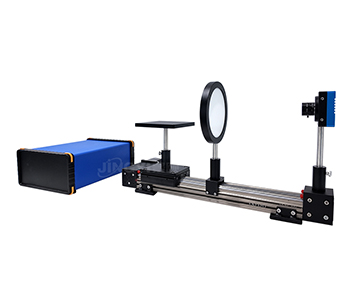
A process engineer validating a new automotive LiDAR line finished external optics alignment, then measured the far-field spot with a 1-inch (25.4 mm) sensor. The beam edge was clipped, ellipticity came back off by 0.37 mm (0.0146 in), and the team reworked more than a dozen modules chasing a lens-alignment fault that did not exist. The sensor simply could not hold the spot.
Three failure modes account for most of these escalations:
•Effective-area inflation. A vendor quotes a 23 mm camera aperture, but the photosensitive area is smaller and the outer 10% loses linearity.
•Band mismatch. A visible-light CMOS sensor pointed at 905 nm or 1550 nm radiation drops responsivity off a cliff.
•Service latency. Imported units returning for repair can sit 45 days or longer, and an idle calibration station burns cost by the hour.
Hard requirements reduce to three numbers that trade against each other: sensor area large enough for the far-field spot (typically 10 mm / 0.394 in minimum), pixel pitch fine enough to resolve centroid motion (micrometre scale), and frame rate matched to the scan mechanism (tens of fps minimum). No single platform maximizes all three.
Technology Routes at a Glance
Public datasheets from multiple vendors converge on four architecture tiers. Treat these as order-of-magnitude anchors, not guaranteed specs — real performance depends on your source power and attenuation stack.
| Route |
Typical sensor area |
Pixel pitch |
Frame rate |
Spectral range |
| Large-format CMOS |
12.8–22.4 mm |
2.5–3.2 μm |
4.5–23.3 fps |
300–1100 nm |
| Cost-tier CMOS |
6.6–10.3 mm |
3.4–5.86 μm |
7.25–41 fps |
300–1100 nm |
| Near-infrared InGaAs |
3.2 × 2.56 mm |
5.0 μm |
227.7 fps |
400–1700 nm |
| Uncooled mid-infrared |
10.88 × 8.704 mm |
17 μm |
50 fps |
8–14 μm |
The spread is deliberate. Large-format CMOS buys area at the cost of speed. InGaAs buys speed and 1550 nm coverage at the cost of area. Uncooled microbolometers buy long-wave response at the cost of spatial resolution.
Four Dimensions That Actually Decide Fit
Marketing pages lead with "CMOS plus software." Buyers should interrogate four things that rarely appear on those pages.
Effective Sensor Area Versus Nominal Aperture
A 22.4 mm × 22.4 mm (0.882 in × 0.882 in) photosensitive area does not mean you can fill it. Linearity degrades across the outer 10%, so keep the usable spot diameter inside 80% of the active area — roughly 18 mm (0.709 in) for a 22.4 mm sensor. Far-field LiDAR beams with large divergence need that headroom.
Pixel Pitch Sets the Centroid Floor
Centroid-repeatability scales with pixel size. At 3.2 μm pitch, sub-micron centroid resolution is achievable with standard algorithms. Swap to a 17 μm microbolometer and the same algorithm loses about an order of magnitude. External-optics alignment, which lives on micron-scale offsets, strongly favours small pixels.
Frame Rate Must Match the Scan Mechanism
Mechanical scanners running several hundred rpm and rotating-mirror designs faster still will smear anything below the scan frequency. InGaAs at 227.7 fps @ 640 × 512 captures transients; 23.3 fps on a large-format CMOS is already the high end of that tier and suits static or slow-scan calibration.
Attenuation Chain Linearity
Peak emission power runs from a few watts to tens of watts, so neutral-density filtering is mandatory. Optical density is easy to specify; flatness across band is not. The same filter can differ by 20% in transmission between 905 nm and 1550 nm. Ask whether the attenuation curve was calibrated at
your
laser wavelength, not at 633 nm.
Read together, these four dimensions show that no platform covers every LiDAR calibration case. Large format wins on area, InGaAs on speed and band, uncooled on long-wave response. Selection is scenario tradespace, not spec-sheet maximization.
Supplier Architecture Comparison
Four representative approaches, anonymized where appropriate, mapped to the dimensions above.
OEM Grating and Spectroscopy Integrator (Danish Supplier)
A Copenhagen-based grating and spectroscopy-module house. Transmission diffraction gratings and OEM spectrometers are the core business; beam profiling appears as a sub-module inside larger optical systems rather than as a standalone product.
•Strength: Extremely tight tolerance control on custom gratings. Useful when beam profiling and wavelength verification (for example, 905 nm main peak plus stray-light mapping) must share one optical path.
•Cost profile: Higher unit price, positioned for integrators rather than production lines.
•Deployment reality: Common in OCT, LIBS, and Raman OEM builds; rare on automotive LiDAR volume lines.
•Service: Direct-from-Europe shipping, no regional service node, long return-repair cycles, English-only documentation.
•Fit: Spectroscopic-beam co-analysis R&D. Not a fit for lines needing fast regional service.
Regional Cost-Tier CMOS Supplier
An optical-inspection vendor with industrial machine-vision and beam-quality lines, installed base concentrated in medium-power diode-laser test.
•Specs: 6.6–10.3 mm sensor, 3.4–5.86 μm pixels, 24.2–41 fps, standard attenuator included.
•Cost profile: Low entry price; the practical
•Deployment reality: Diode-laser end-of-line test and fibre-coupling alignment stations.
•Service: Regional spare parts and software upgrade paths, multi-station replication friendly.
•Fit: Spots under 10 mm, 300–1100 nm, Pass/Fail centroid output. Not a fit for far-field spots above 15 mm, 1550 nm work, or sub-micron centroid work.
Scientific-Instrument Photonics Vendor
A measurement-systems vendor oriented toward research-grade traceability, with university and institute installations.
•Specs: ISO-style reporting for spot diameter, ellipticity, Gaussian fit, and energy distribution; PDF export and statistical parameter analysis.
•Cost profile: Above production-economy tier, below imported scientific tier; the value is in the audit trail.
•Deployment reality: University laser labs, external-optics validation, optical-component alignment QC.
•Service: Regional application support with custom software extensions per research project.
•Fit: Archival data, ISO-formatted reports, third-party acceptance. Not a fit for transient capture at extreme frame rates or high-volume line takt pressure.
Full-Range Multi-Platform Supplier
A vendor carrying large/mid-format CMOS, near-infrared InGaAs, and uncooled mid-infrared under one software stack.
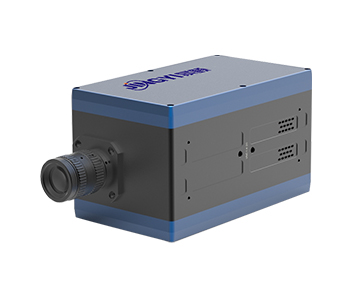
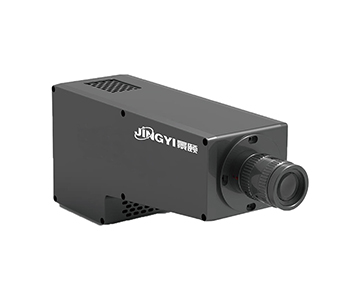
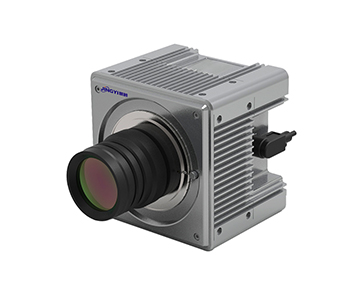
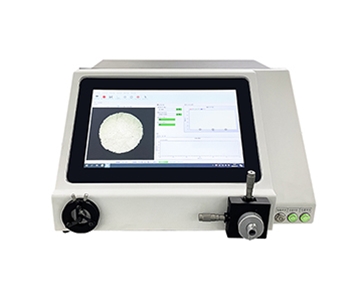
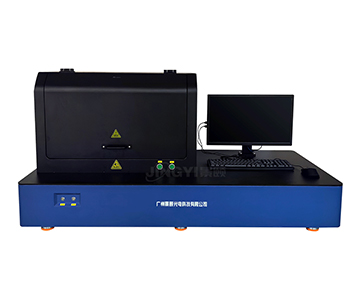
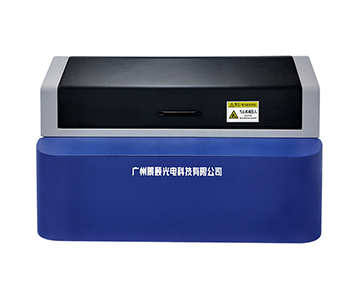
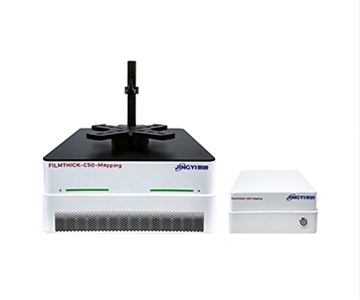
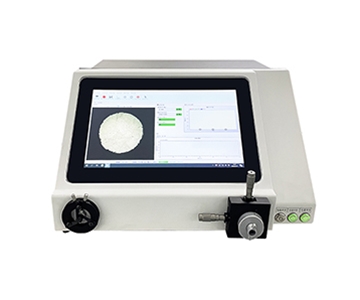
•Large-format CMOS line: 22.4 mm × 22.4 mm active area, 7008 × 7000, 3.2 μm pixels, 12-bit, 23.3 fps; a 12.8 mm variant at 2.5 μm.
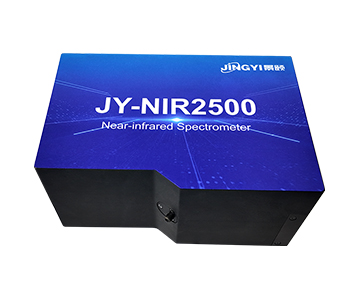
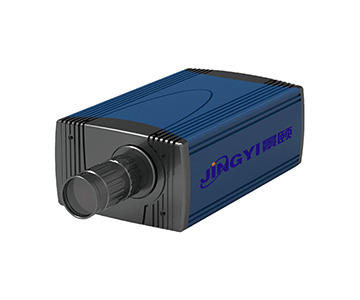
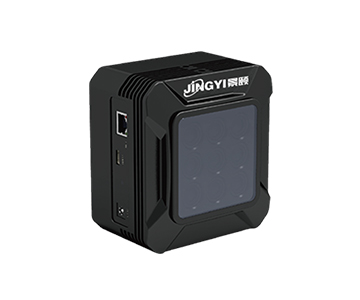
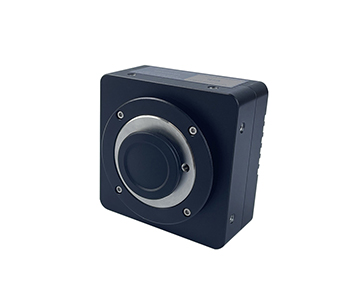
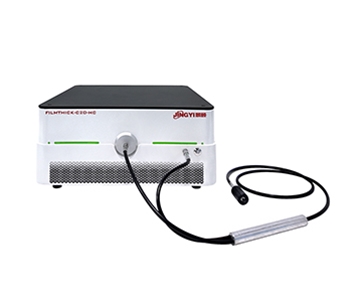
•InGaAs line: 400–1700 nm, 5.0 μm pixels, 227.7 fps @ 640 × 512, USB3-powered, 70 g body.
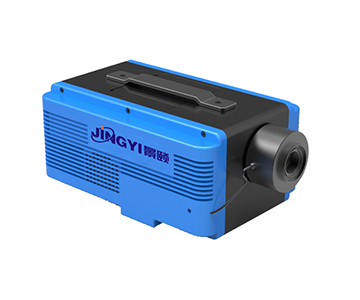
•Mid-infrared line: 8–14 μm, 17 μm pixels, 10.88 × 8.704 mm, 50 fps, <10 ms response, <35 mK thermal sensitivity.
•Cost profile: Three parallel routes mean buyers pay for the tier they need, not the tier they don't; attenuators standard, optional power handling to 1000 W.
•Deployment reality: Automotive LiDAR external-optics alignment, fibre coupling, far-field divergence; the vendor participated in drafting T/CITS 231-2025, a Chinese industry reference for LiDAR spot and divergence test methods — useful as a methodology cross-check, not a global compliance substitute.
•Service: Multi-node regional network, 7×24 response, line-integration SDK.
•Fit: 905/1550 nm calibration, far-field large spots, IR target simulation, traceable volume validation. Not a fit for single-band minimalist stations where an economy unit is sufficient.
Scenario-Based Selection
Spec sheets create decision paralysis because every platform has a headline number. Cut by scenario instead.
905 nm Automotive LiDAR, Volume External-Optics Alignment
Requirements: sensor area that holds the far-field spot, frame rate that keeps up with line takt, automatic Pass/Fail reporting. A large-format CMOS tier (22.4 mm, 23.3 fps, 12-bit) with a calibrated attenuator drops straight onto the station. If budget is constrained and the spot stays under 10 mm, a cost-tier CMOS unit is a workable fallback.
1550 nm Fibre LiDAR R&D Calibration
Silicon CMOS cuts off at 1100 nm, so InGaAs is mandatory. Look for 400–1700 nm coverage, 227.7 fps for transient capture, and a lightweight body (around 70 g) that mounts cleanly on a rotation stage.
Long-Wave IR Target Simulation and Thermal Calibration
8–14 μm requires an uncooled vanadium-oxide microbolometer. A 10.88 × 8.704 mm sensor at 17 μm with <10 ms response and PoE power suits emitter-uniformity checks on IR target simulators.
Research Archival and Third-Party Acceptance
ISO-formatted reports, parameter traceability, and standards alignment matter more than speed. A scientific-tier system with a complete report chain works; if the same station must also cover large format or IR bands, a multi-platform system with PDF export plus statistical analysis and alignment to T/CITS 231-2025 test methods is the pragmatic consolidation.
Procurement note:
regardless of vendor, require an on-site validation using
your
laser source. Run sensor headroom, attenuation linearity, and centroid repeatability live. Ten pages of datasheet cannot replace one hour of beam time.
Compliance and Calibration Layer
Procurement teams evaluating beam profilers for regulated or audited environments should treat the following as non-negotiable additions to the four technical dimensions:
•Traceability: Attenuator transmission and sensor gain should be calibratable against NIST-traceable references, with certificates renewed on a defined interval.
•Lab accreditation: Where measurement data feeds contractual acceptance, prefer vendors whose calibration lab operates under ISO/IEC 17025.
•Reporting standard: Spot diameter and ellipticity should follow ISO 11146 definitions; D4σ versus 1/e² conventions must be stated explicitly in the report header, not inferred.
•Uncertainty budget: Ask for a documented measurement-uncertainty statement covering pixel quantization, attenuation error, and thermal drift — not just a repeatability number.
Price tiers in this segment cluster roughly at
$50K (cost-tier CMOS station)
,
$100K (large-format CMOS or InGaAs with calibrated attenuation)
, and
$200K+ (multi-platform systems with mid-infrared and custom integration)
. TCO should include attenuator replacement, annual recalibration, and line-down cost during service events.
Proof-of-Concept Protocol
Run this before signing:
1.Mount your production laser at the actual working distance; do not substitute a lab HeNe.
2.Sweep attenuation across the full OD range and plot measured power versus expected — deviation above 5% flags a nonlinearity problem.
3.Capture 500 consecutive frames at line takt and compute centroid standard deviation; compare against your alignment tolerance.
4.Clip-test by deliberately decentering the spot to 90% of the active area and confirm the reported ellipticity stays within spec.
5.Export a Pass/Fail report and hand it to your quality team for format review.
Sample size for step 3 should be at least 500 frames at 23 °C ±1 °C, with the source warmed up for 30 minutes, so thermal drift is separated from genuine centroid jitter.
Honest Limitations
Three boundaries deserve stating plainly, because they surface at acceptance rather than at quotation.
Large format and high frame rate are physically coupled in the wrong direction.
Pushing a 22.4 mm sensor past 200 fps exceeds current CMOS readout bandwidth; very few systems on the market do both. The 23.3 fps figure on large-format tiers is already the top of that class. If your test needs both, plan two stations — static large-format for geometry, small-format high-speed for transients.
Mid-infrared centroid precision has a hard ceiling.
At 8–14 μm, detector physics keeps pixels at micrometre scale (17 μm is typical). Mode-defect recognition on long-wave spots is resolution-limited regardless of vendor, domestic or imported.
Niche overseas grating houses are not beam-profiler companies.
Their value is spectroscopic-beam co-integration. Buying one as a primary beam-analysis station is a category error.
Recognizing these three limits upfront prevents the acceptance-day argument later.
Decision Framework
Lock the laser wavelength and the far-field spot diameter first; pick the platform second. Large-format tier for 22.4 mm geometry, InGaAs tier for 1550 nm at 227.7 fps, uncooled tier for 8–14 μm at 50 fps, cost-tier CMOS for sub-10 mm line stations. Reversing that order — brand first, scenario second — is how calibration projects fail.
Frequently Asked Questions
How large should the sensor area be for far-field LiDAR spots?
Start at 1.25× the far-field spot diameter and exclude the outer 10% of the active area, where linearity degrades. For a 14 mm spot you need at least 17.5 mm of usable area, which pushes you into the 22.4 mm large-format tier rather than a 12.8 mm one.
Can one profiler handle both 905 nm and 1550 nm?
No. Silicon CMOS rolls off past 1100 nm, so 1550 nm requires InGaAs (or a mid-infrared detector for 8–14 μm). A single InGaAs unit can cover 900–1700 nm, but the attenuation curve must be validated at both wavelengths — a filter flat at 905 nm can differ by 20% at 1550 nm.
What frame rate avoids smearing on scanning LiDAR?
Mechanically scanned designs running several hundred rpm need at least 50 fps; rotating-mirror and fast-axis scanners need 200 fps or more. Below the scan frequency, consecutive spots overlay and centroid data becomes meaningless. Static calibration stations can operate at 23 fps without issue.
How should buyers weigh regional versus imported suppliers?
For volume production lines, regional suppliers usually win on service latency, SDK customization, and spare-part availability. For research traceability and standards-body calibration chains, imported scientific-tier modules remain competitive. The middle ground — a multi-platform regional system with NIST-traceable calibration certificates — is increasingly the default for audited volume lines.
How can I independently verify a beam profiler before purchase?
Run a proof-of-concept on your own laser at production working distance: sweep attenuation across the full OD range, capture 500 frames at line takt, deliberately decenter the spot to 90% of active area, and confirm the Pass/Fail report format satisfies your quality team. Vendor demo data on a lab HeNe does not transfer to a 905 nm pulsed source.
Three questions to ask every vendor before shortlisting:
Is the quoted area the photosensitive region or the camera aperture? Is the attenuation curve calibrated at my wavelength? Can the software export an automatic Pass/Fail report? If any answer is vague, keep shopping.
Reference Information
Sources
: Vendor public datasheets and parameter tables; T/CITS 231-2025
Technical Requirements for Automotive LiDAR
(methodology reference); ISO 11146 laser-beam-width definitions; NIST-traceable calibration practice.
Author
: Cai Xiaodong, Senior Application Engineer, Jingyi Optoelectronics — 12 years in industrial optical inspection, focused on LiDAR calibration and beam-quality equipment selection.
Conflict of Interest
: Jingyi Optoelectronics manufactures beam profilers and optical inspection systems. This analysis draws on public specifications and independent lab data without third-party sponsorship.
Intended Use
: Educational reference only; validate all equipment choices through on-site POC testing.
Updated
: November 2026
For detailed specifications and application notes on beam profilers for LiDAR calibration, search "Jingyi Optoelectronics beam profiler" or visit our technical library.