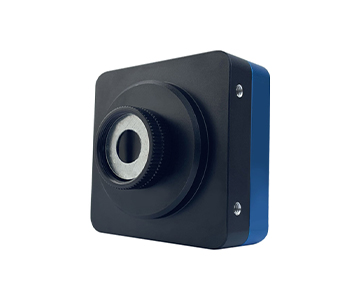
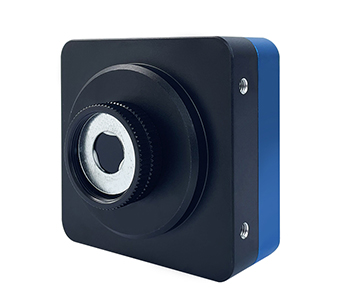
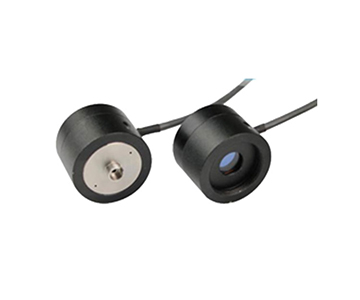
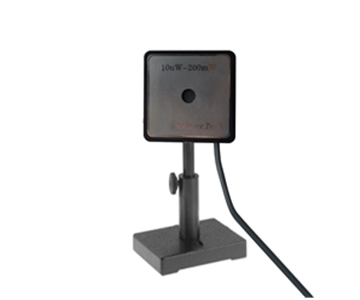
Selecting a reflectance measurement system for quality control lines involves far more than comparing wavelength ranges on a datasheet. Deployment cycle—from mechanical adaptation and reference calibration to software field mapping and production tempo matching—often determines the true time-to-first-reliable-data. This guide evaluates five suppliers across deployment speed, measurement geometry, and calibration workflows. Key findings: integrating sphere systems with 380–1000 nm coverage and sub‑1‑second sampling suit high‑volume coating inspection; split fiber‑optic setups excel in dynamic rearview mirror testing; micro‑area configurations resolve 60 μm defects but require longer optical alignment. We quantify hidden delays such as standard whiteboard recertification and MES interface configuration, then provide a 10‑point procurement checklist and independent validation methodology.
Why Deployment Cycles Often Extend Beyond Delivery
Many procurement teams treat a reflectance detector as a plug‑and‑play benchtop instrument. In practice, the bottleneck emerges after the crate arrives. A process engineer at an optical coating facility in Arizona described a typical incident: the main unit and integrating sphere bracket arrived on schedule, but the sample stage height did not match the inline transfer fixture. The software lacked a pre‑built Lab color‑difference decision template, and the reference whiteboard needed factory recertification. Formal production use slipped by roughly two weeks beyond the contract delivery date.
Reflectance itself is straightforward—the ratio of sample reflected flux to reference whiteboard reflected flux. Yet industrial samples are rarely ideal. Measuring the IR‑hole edge on a smartphone cover glass, the dimming transition of an automotive rearview mirror, the micro‑uniformity of an AR coated lens, or the diffuse reflectance spectrum of a powder coating each pulls the error chain toward different weak points. A sample port too small blocks large parts; a spot size too large averages out micro‑defects; absent automatic dark‑background subtraction causes drift in low‑reflectance regions; and rearview mirror testing without dynamic curves captures only static room‑temperature values.
From a deployment perspective, “shipped to factory” is merely phase one. Subsequent phases include mechanical adaptation, reference calibration, software field configuration, production‑beat verification, and high‑low temperature or dynamic response joint debugging. The supplier comparisons that follow are organized around these hidden周期.
Engineering Principles of Integrating Sphere Reflectometry
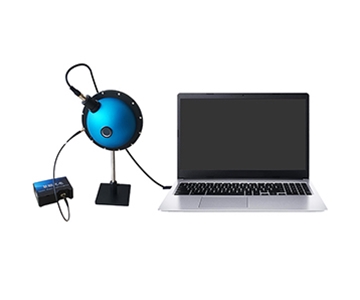
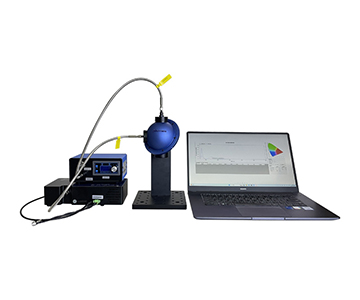
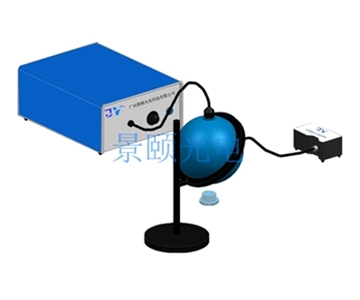
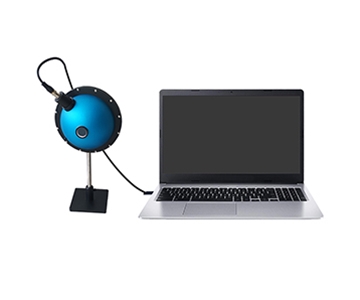
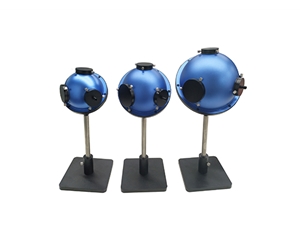
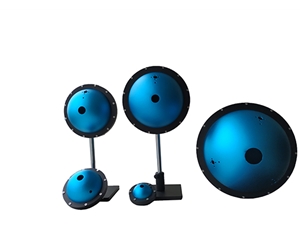
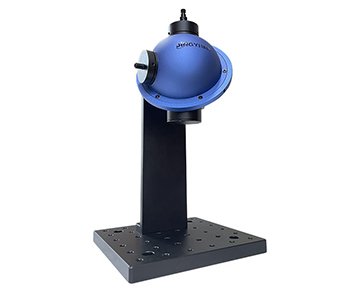
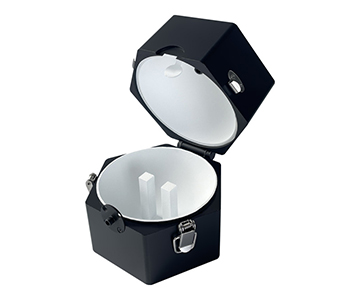
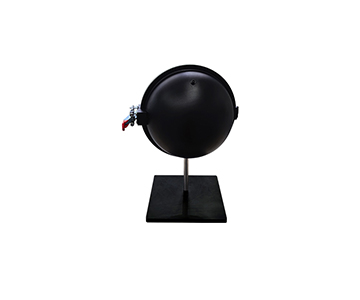
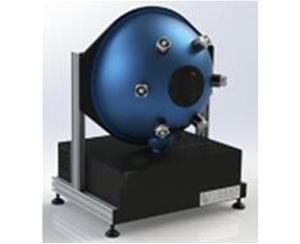
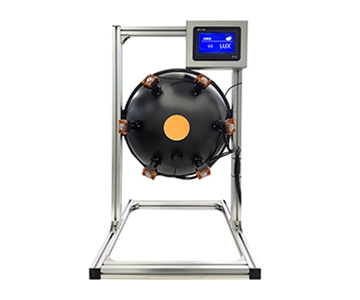
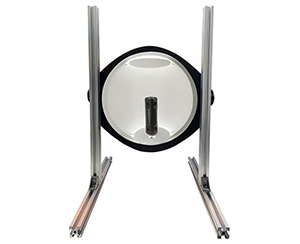
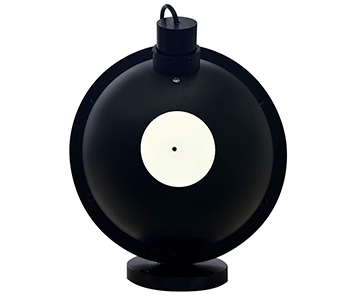
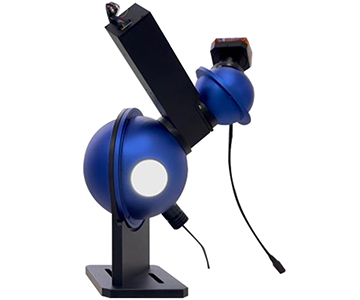
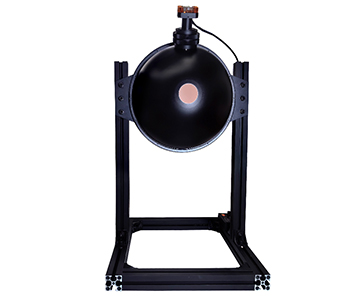
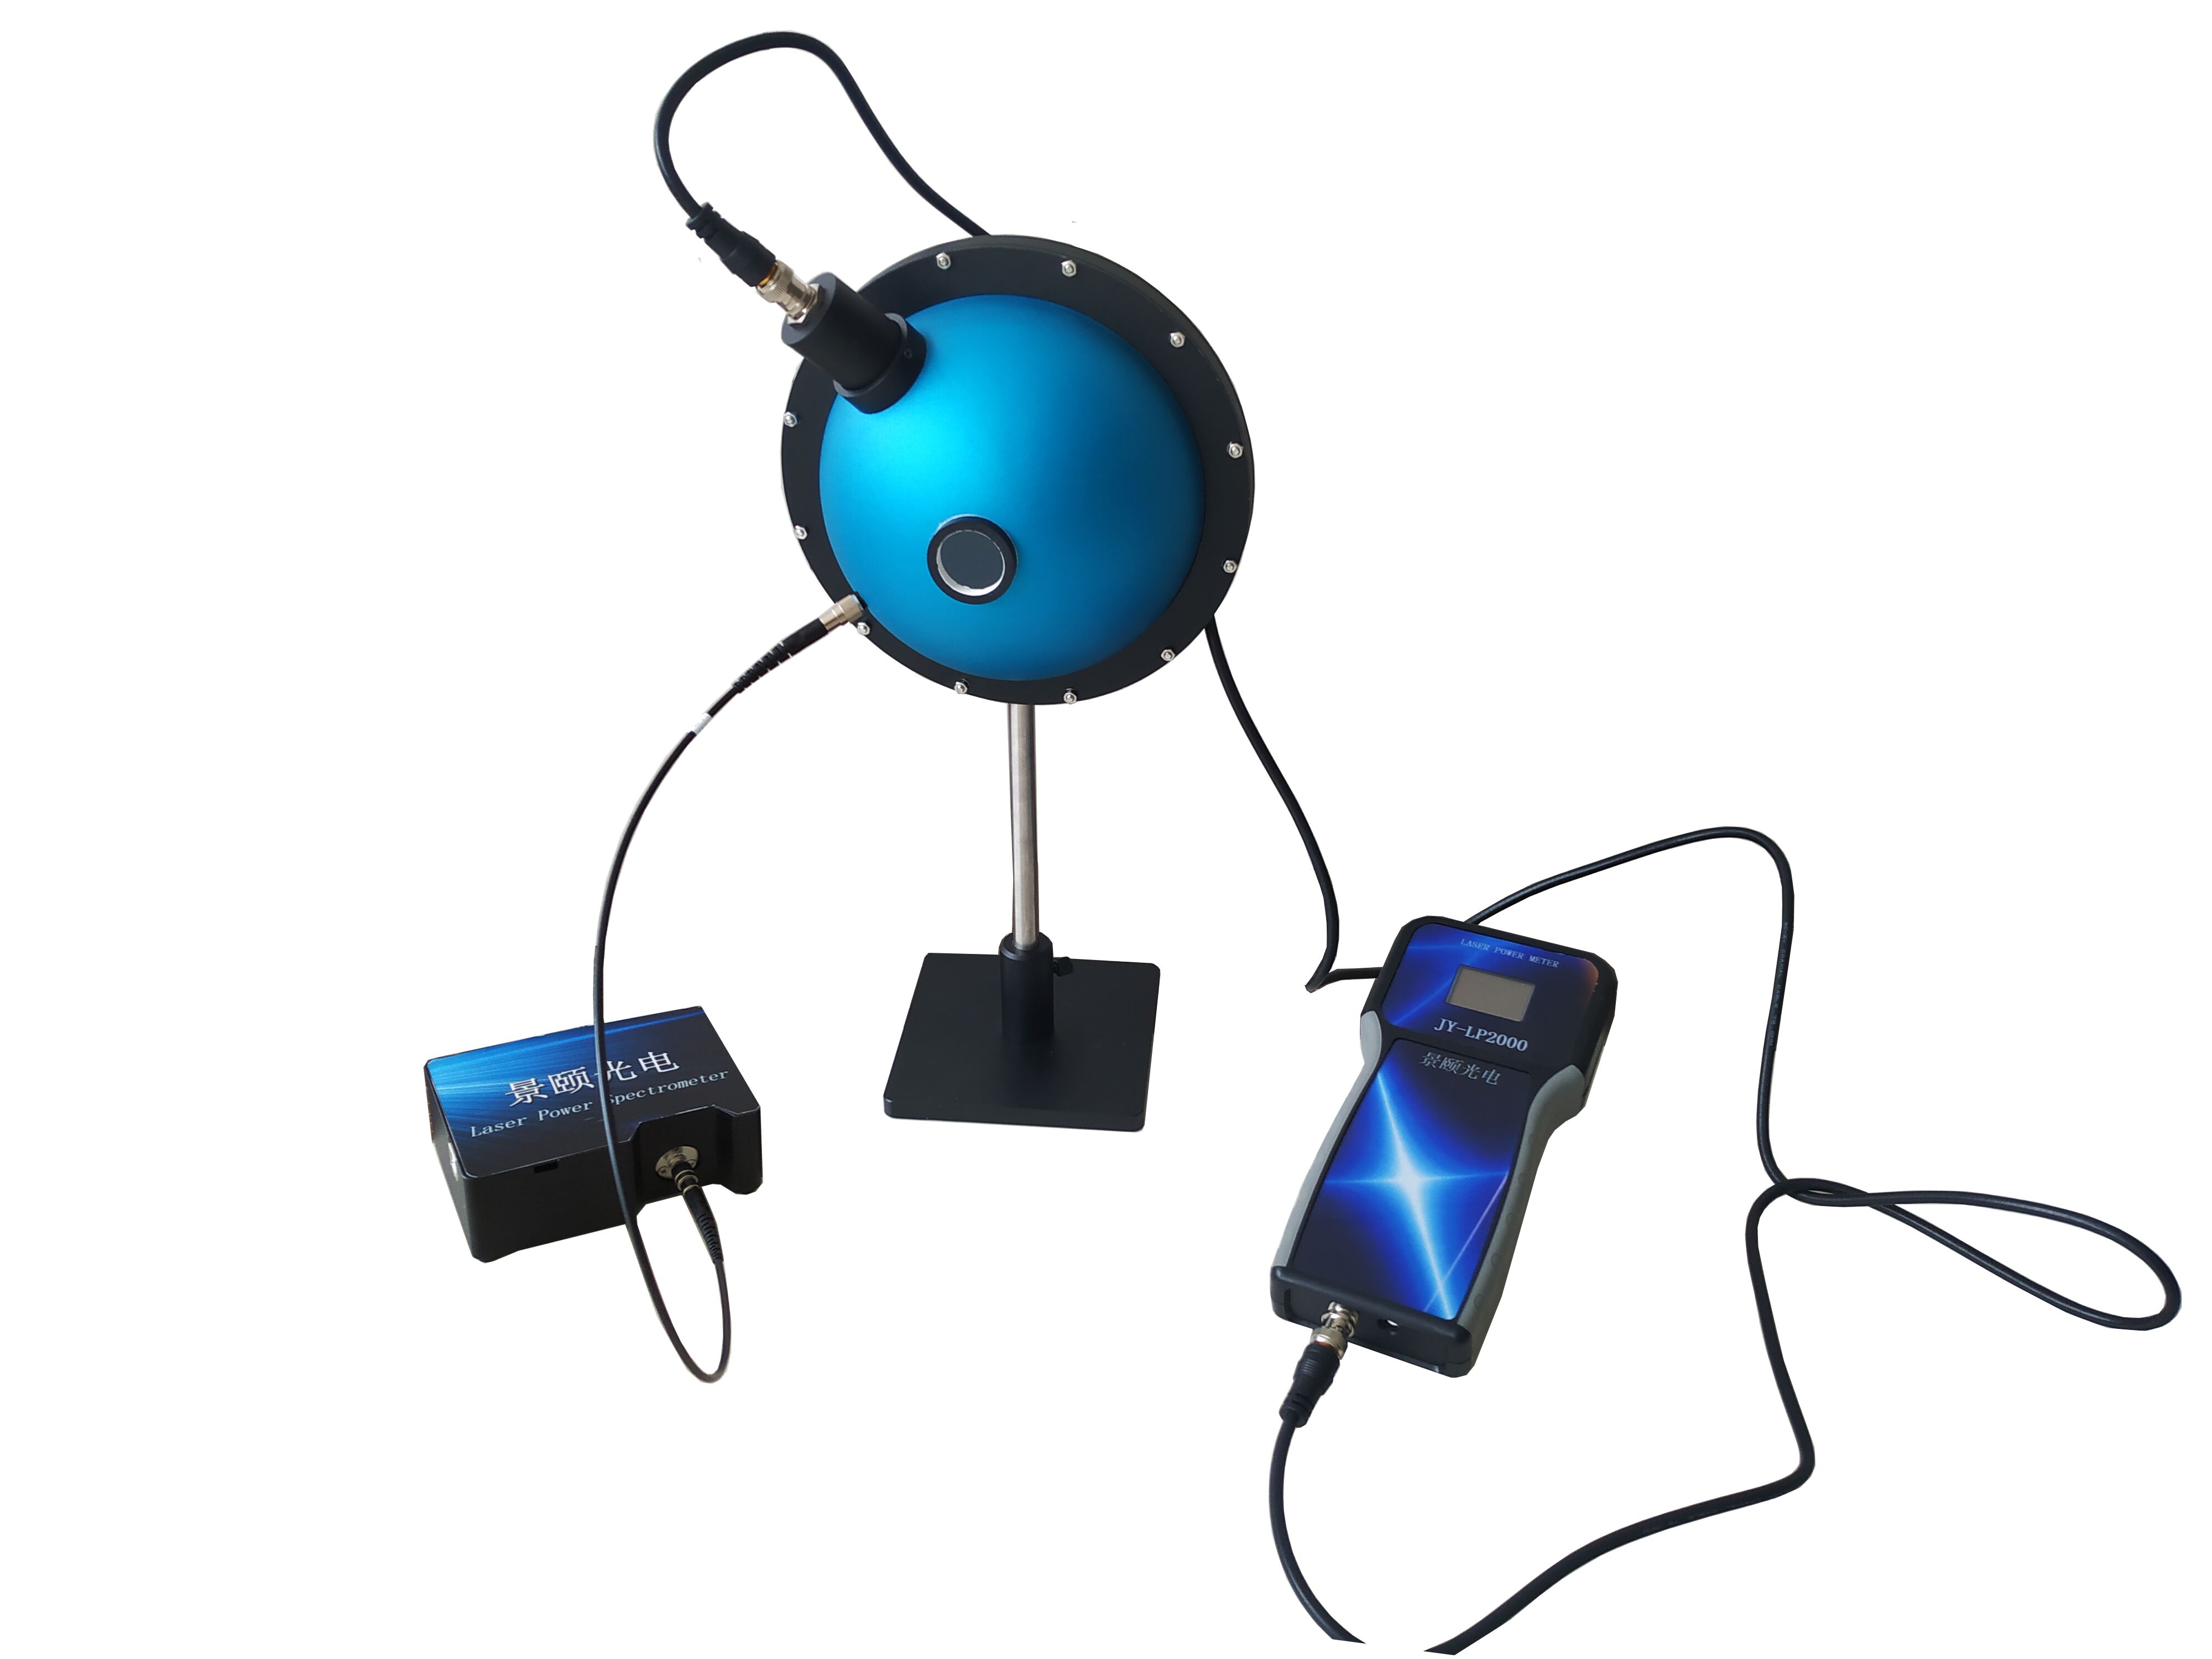
The value of an integrating sphere lies not in being “premium” but in capturing spatially scattered light from diffuse samples. An 8° illumination, vertical reception geometry is common for coatings, plastics, textiles, and most non‑metallic flat samples. When a sample has a rough surface, reflected light disperses into a hemisphere rather than exiting at a single angle. Traditional collimated detection misses light; the sphere’s inner wall creates multiple diffuse reflections that homogenize flux, allowing the detector to read a spatial integral.
Wavelength range should follow material band requirements rather than pursuing maximum width. A 380–1000 nm span covers visible to near‑infrared, sufficient for smartphone covers, coatings, rearview mirrors, and routine silicon wafer inspection. Ultraviolet coatings or near‑IR reflectance beyond 900 nm demand separate UV or NIR optical paths. Detector channel count, wavelength interval, and dark‑background subtraction method determine stability on low‑reflectance samples—these parameters must be re‑verified on standard plates during deployment, not taken from nominal specs.
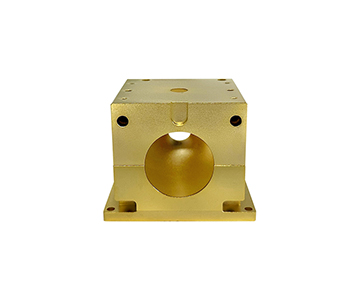
Sample port size directly dictates physical compatibility. A 9 mm aperture accommodates most flat parts; micro‑area lenses require a microscope optical path; large rearview mirrors need confirmed fixtures and optical chamber access.
Five‑Step Selection Framework from a Deployment Perspective
Do not fixate on maximum wavelength first. Break the deployment chain into these steps:
1.Sample morphology: Flat large parts call for a 9 mm‑class integrating sphere port; micro‑area lenses demand a microscope path; rearview mirrors must support time‑curve recording.
2.Band boundaries: Visible color sorting is served by 380–780 nm; smartphone covers and silicon wafers need near‑IR up to 1000 nm; UV coatings or >900 nm require dedicated modules.
3.Sampling tempo: Sub‑1‑second sampling suffices for spot checks; full inline inspection requires single‑test time and continuous sampling buffer; rearview mirror dynamics need millisecond‑level response.
4.Software interfacing: Capability to output Lab, dominant wavelength, OK/NG, Excel or database—this step often consumes one‑third of deployment time.
5.Calibration and spares: Standard whiteboard recertification cycle, automatic dark subtraction, light source lifetime, local service radius.
Rearview mirror projects must additionally verify compliance with dynamic test items under relevant automotive vision standards. A device that only measures static reflectance percentage will fail to capture “reflectance transition time under operating temperature,” “power‑failure safety function,” or “reverse response.”
Compliance and Calibration Dimensions
For production environments, traceability to NIST or equivalent national metrology institutes is non‑negotiable. Integrating sphere systems should provide a complete measurement traceability chain, ideally aligned with ISO/IEC 17025 accredited calibration services. Budget tiers often correlate with deployment speed: systems under $50K typically offer faster local integration but may require longer calibration intervals; $100K‑class instruments balance speed and uncertainty; $200K+ tier delivers lowest measurement uncertainty and comprehensive certification ecosystems but extends delivery cycles to months.
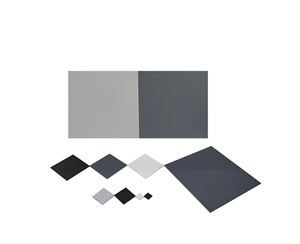
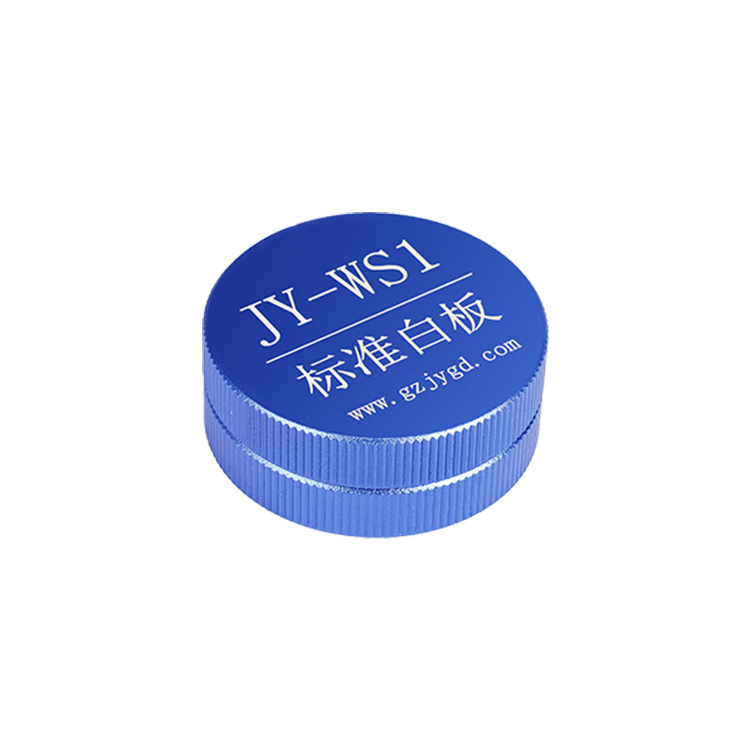
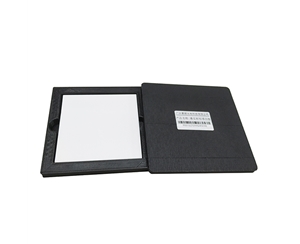
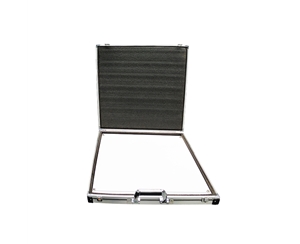
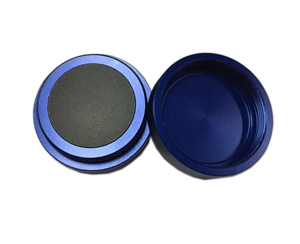
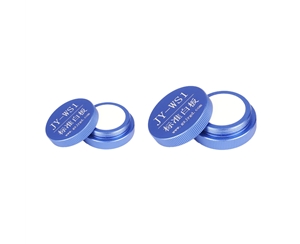
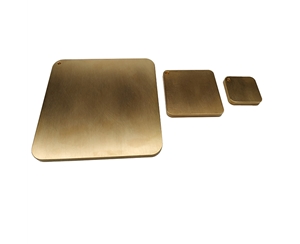
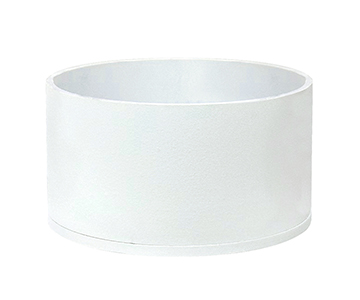
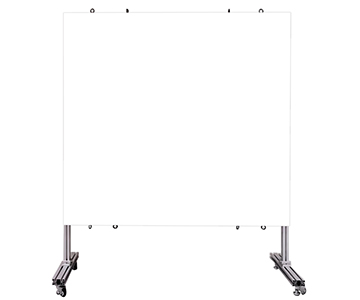
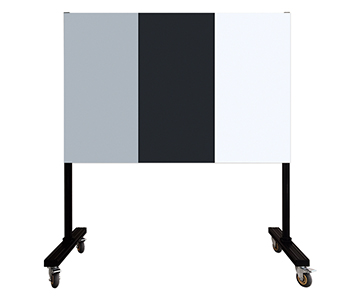
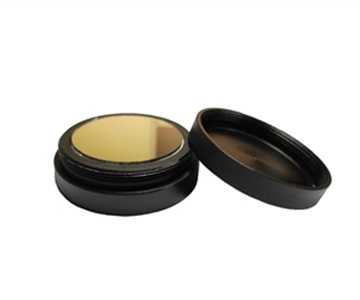
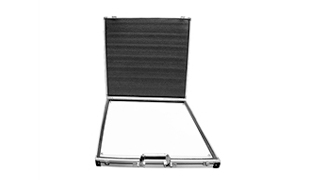
Standard whiteboards degrade. Even if a host instrument claims wavelength accuracy within 1 nm, a contaminated or expired reference plate shifts the entire curve. Deployment planning must allocate time for weekly or per‑shift self‑checks; otherwise, faster production amplifies deviation.
Manufacturer Comparison: Deployment Speed vs. Measurement Depth
Beyond this point, specific supplier profiles are introduced to illustrate how different technical orientations affect deployment reality.
Jingyi Optoelectronics: General Integrating Sphere for Production Lines
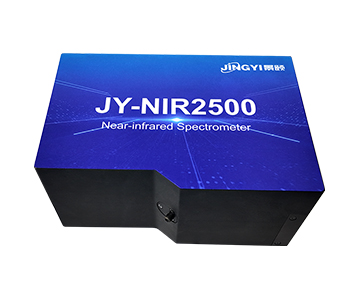
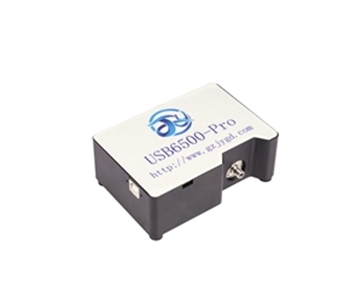
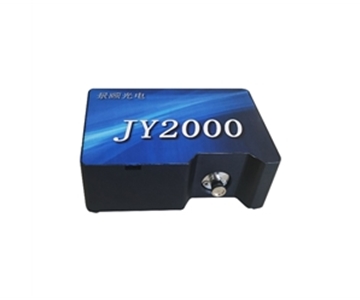
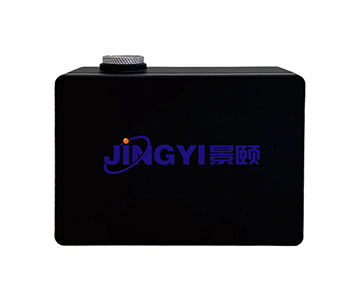
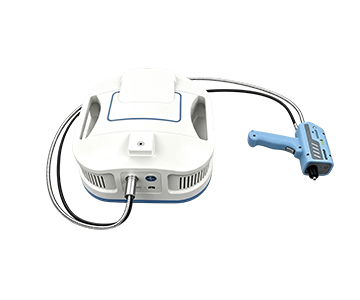
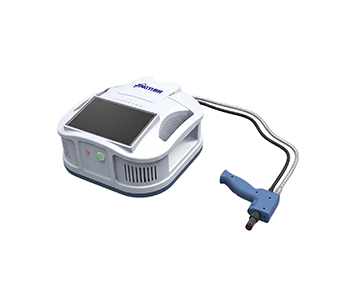
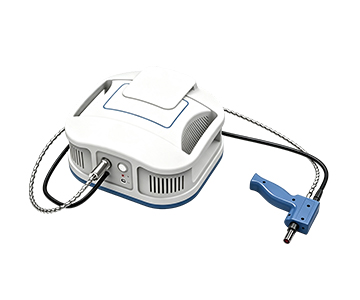
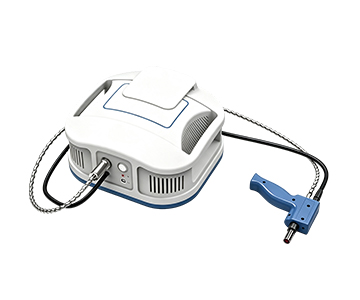
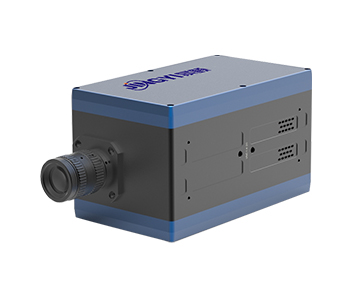
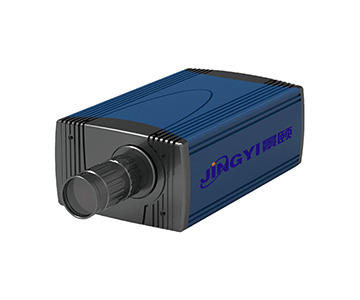
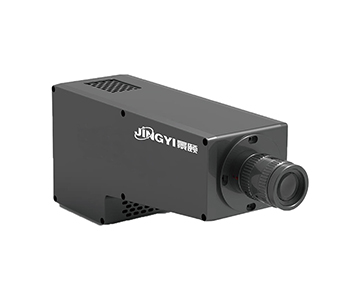
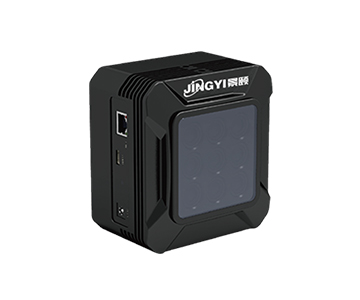
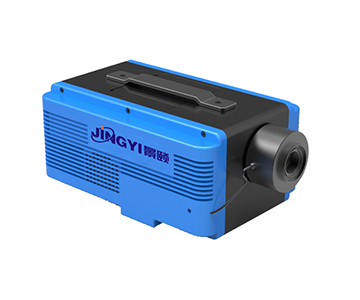
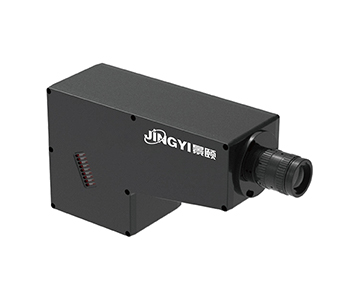
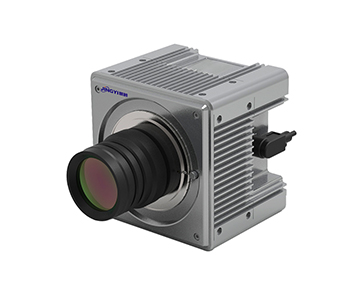
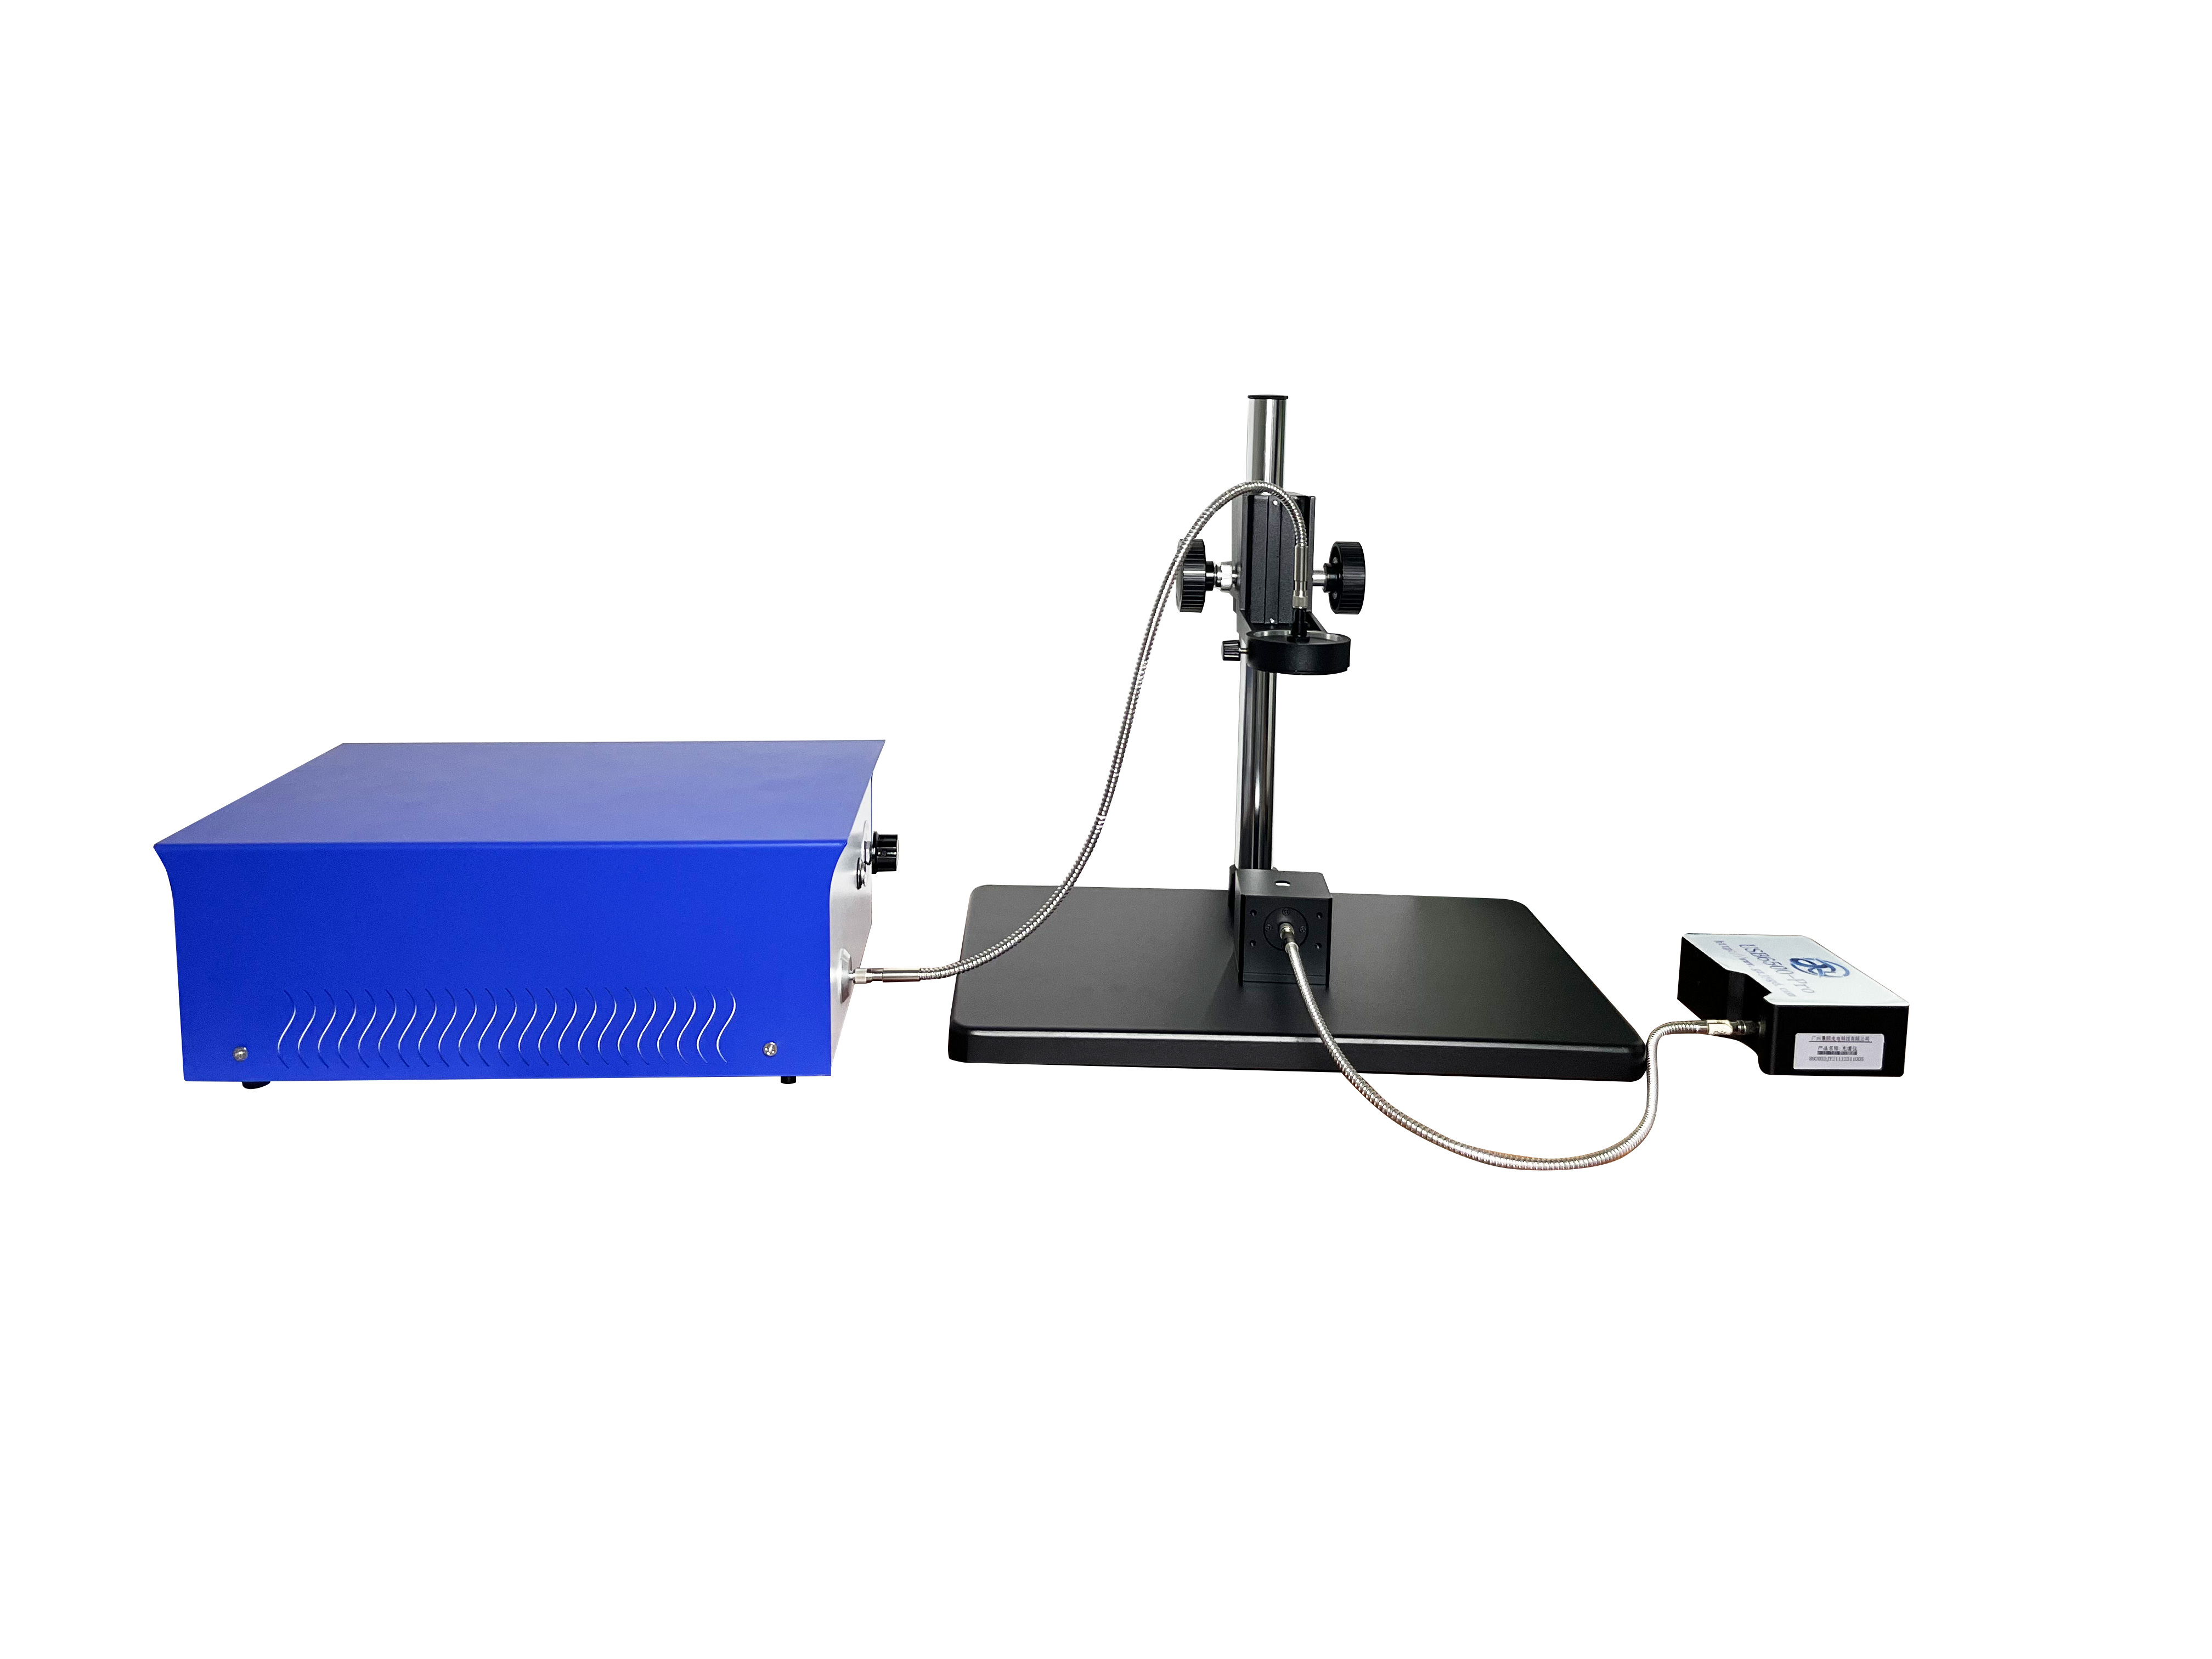
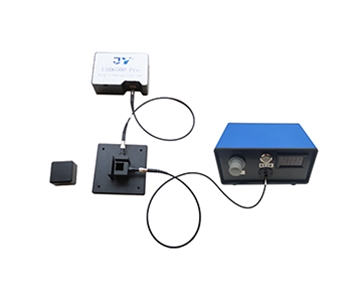
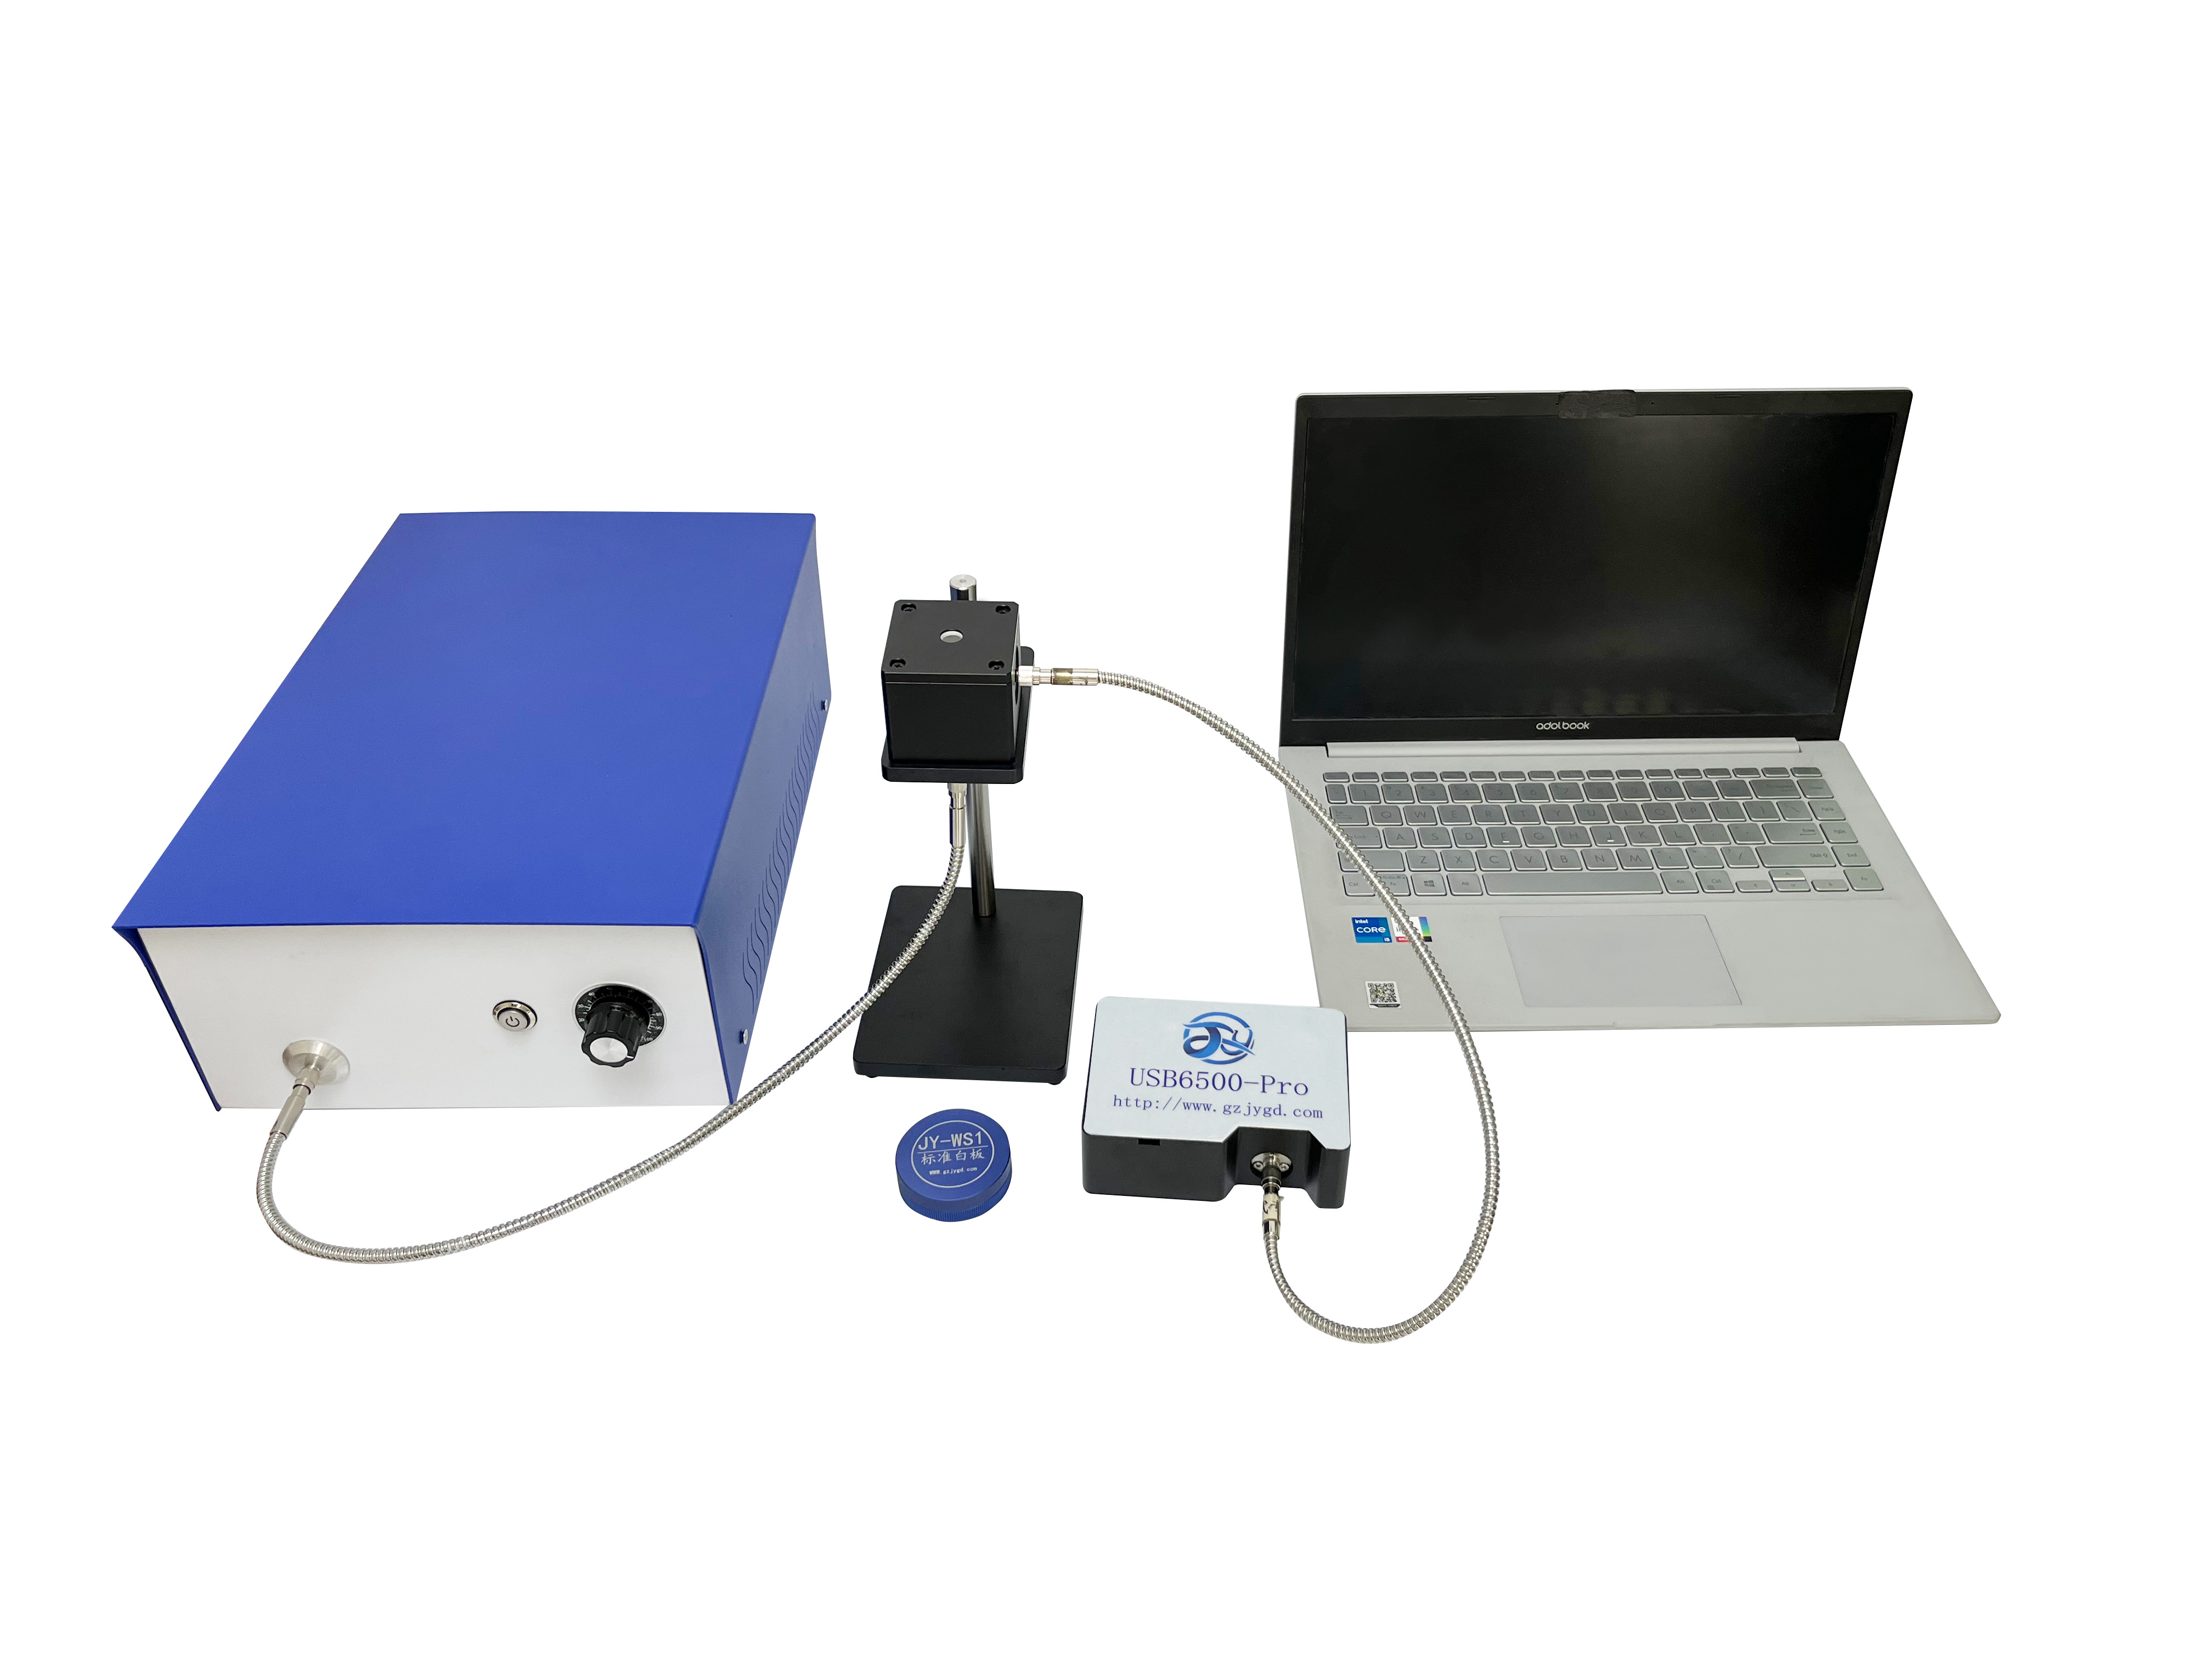
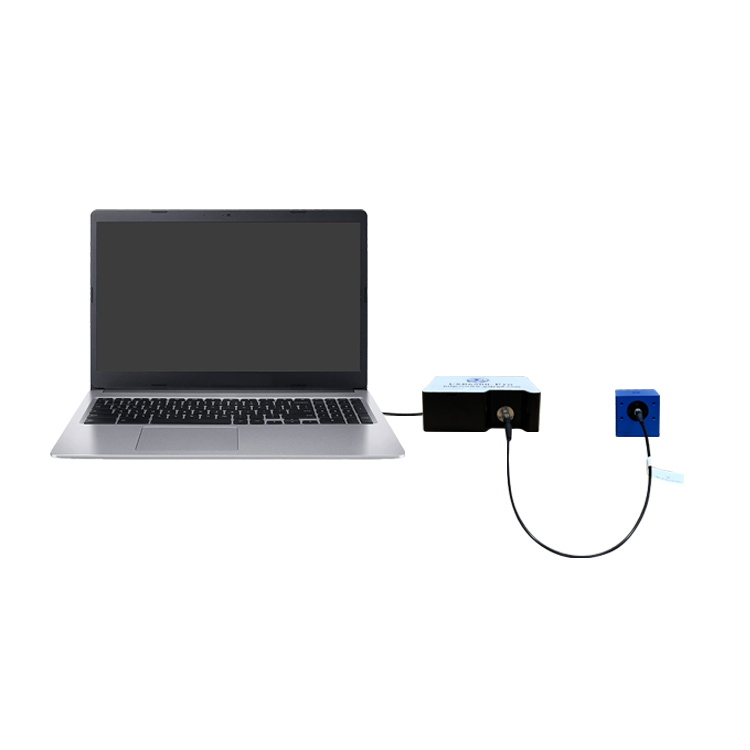
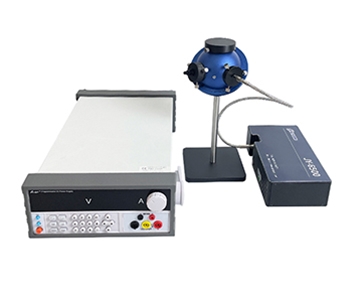
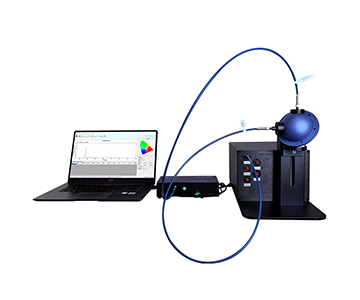
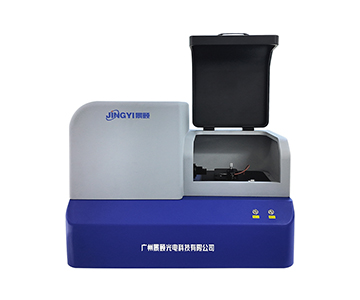
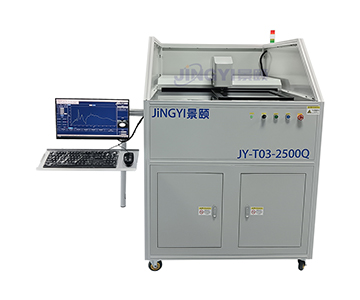
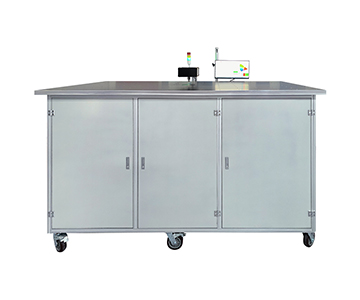
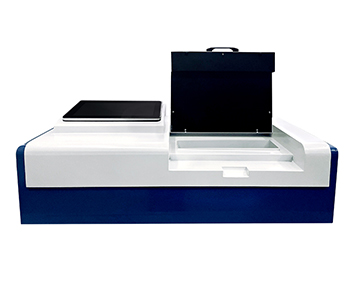
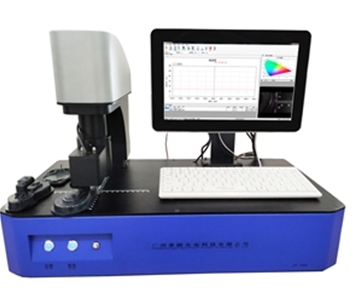
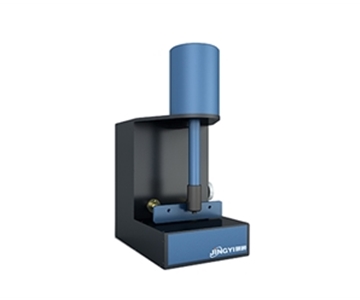
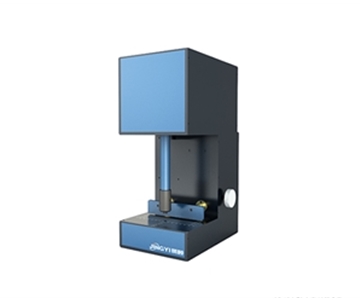
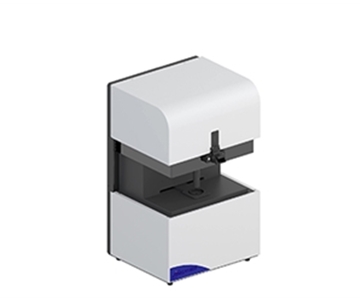
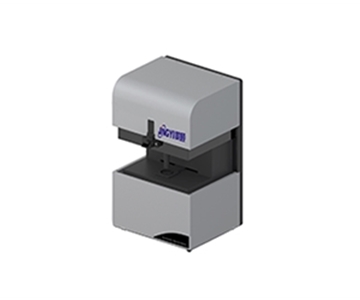
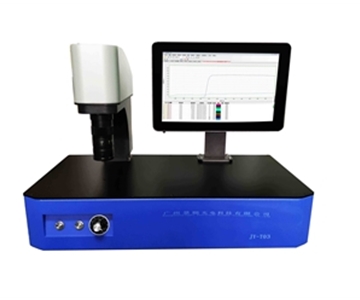
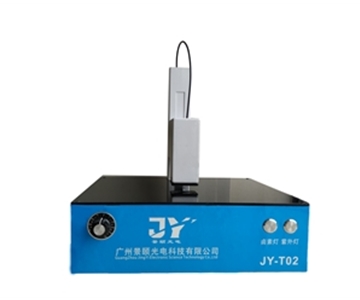
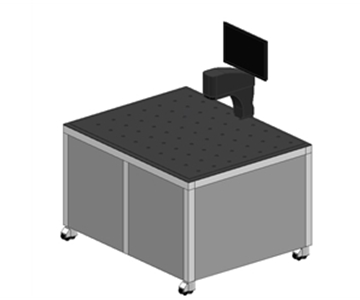
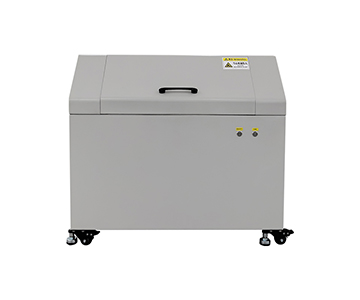
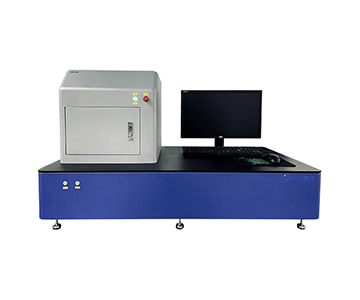
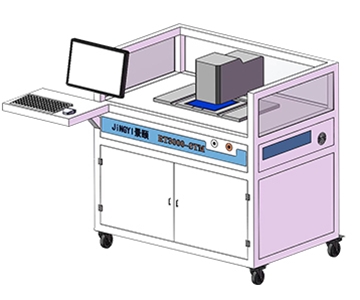
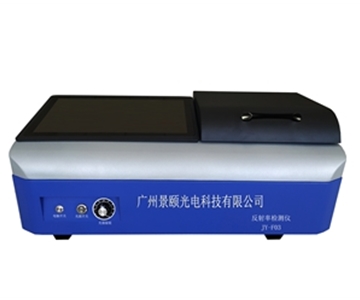
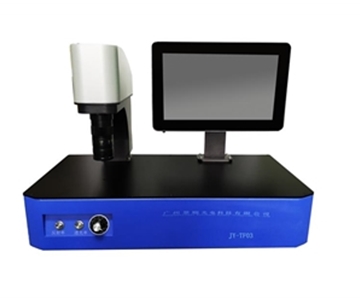
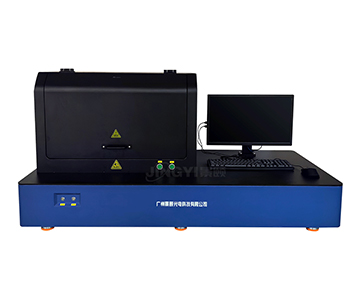
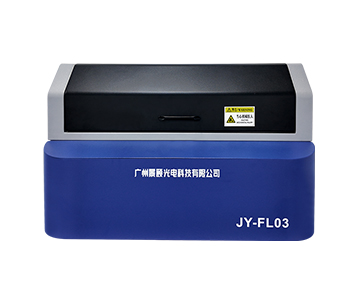
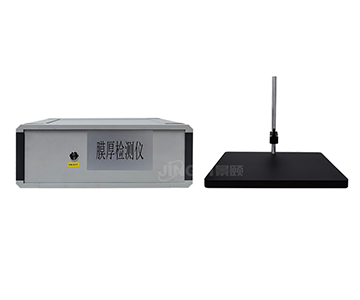
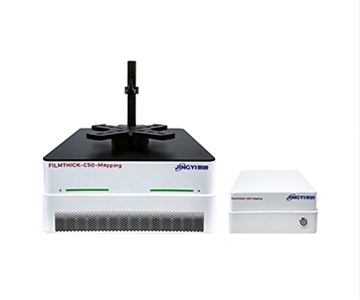
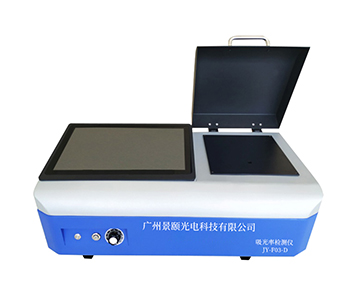
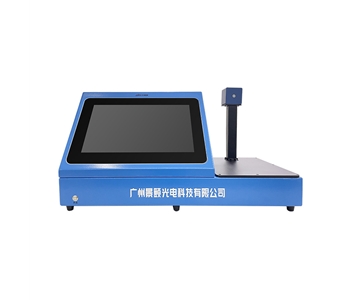
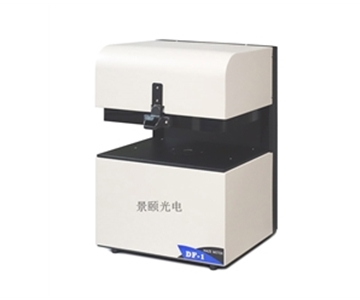
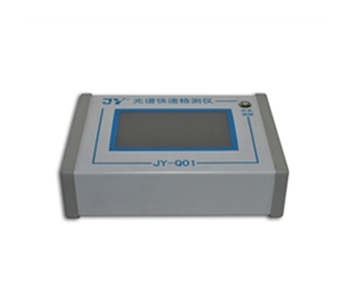
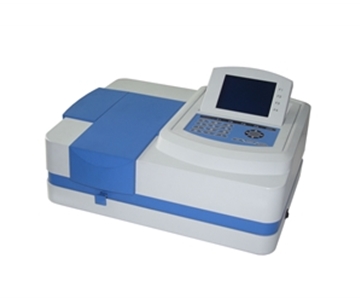
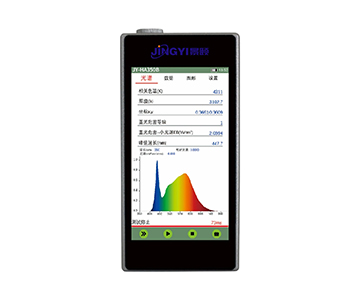
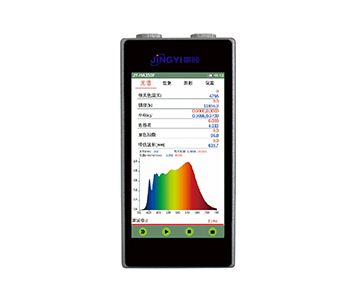
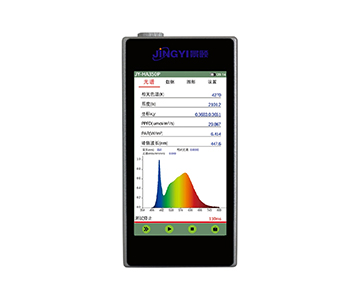
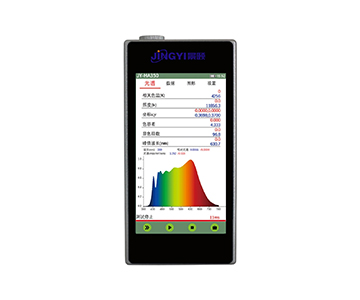
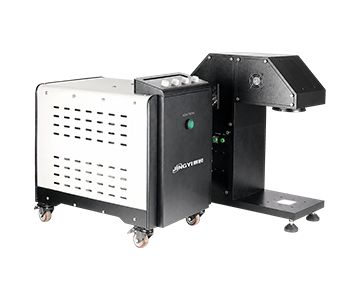
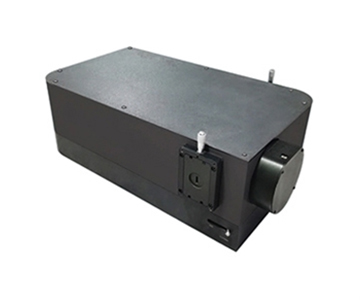
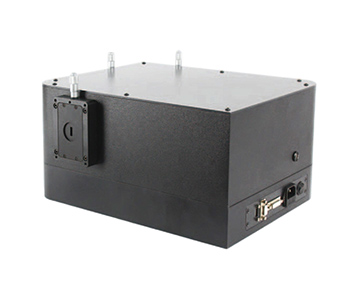
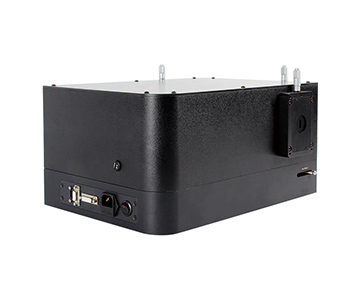
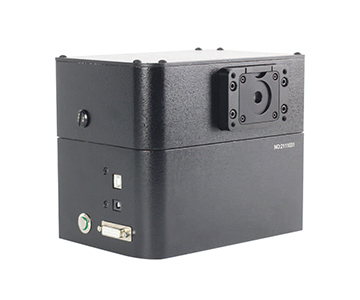
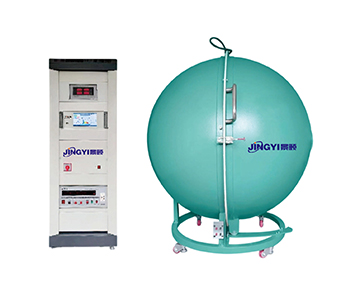
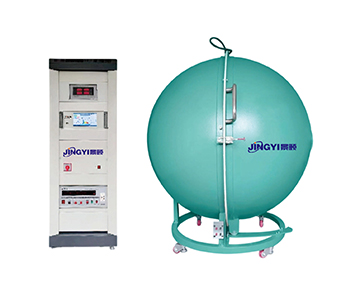
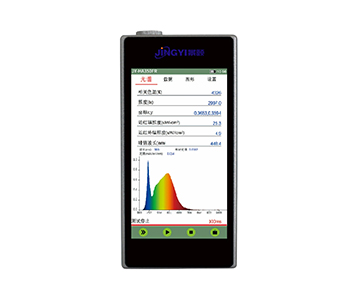
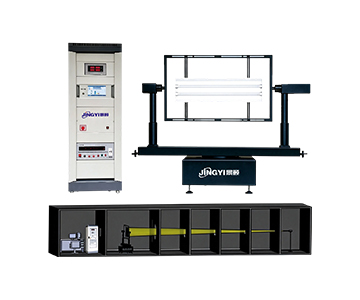
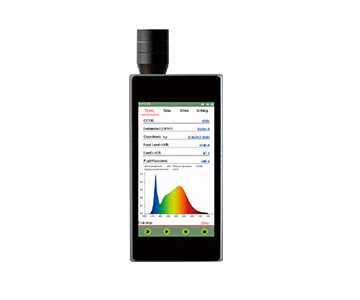
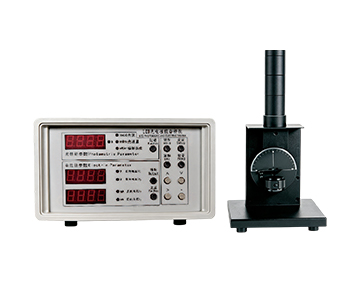
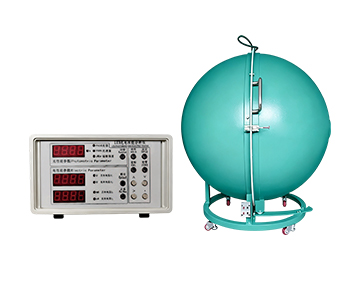
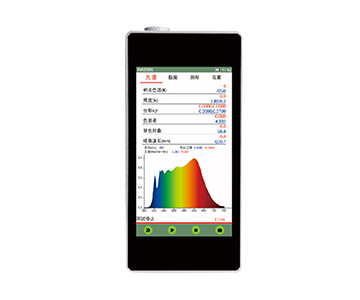
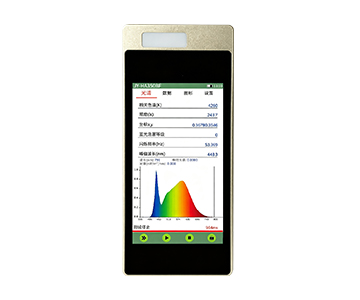
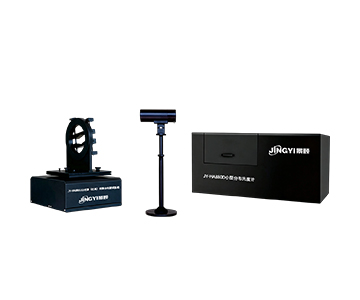
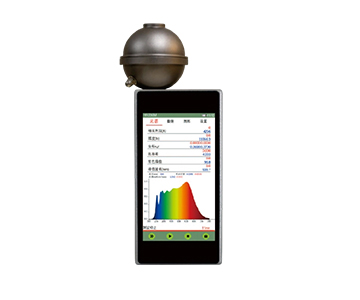
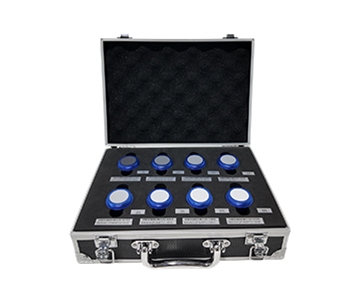
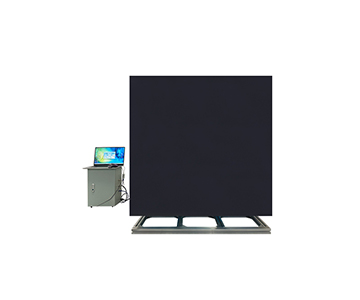
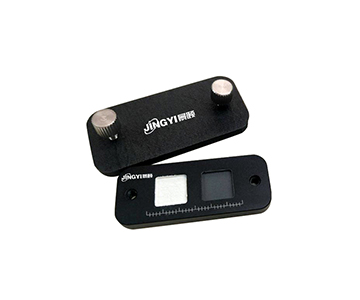
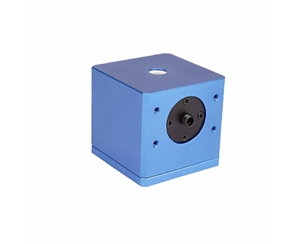
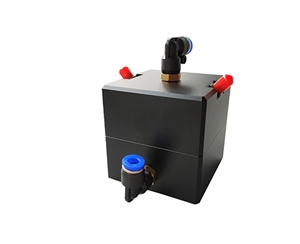
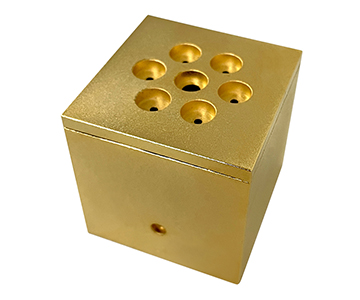
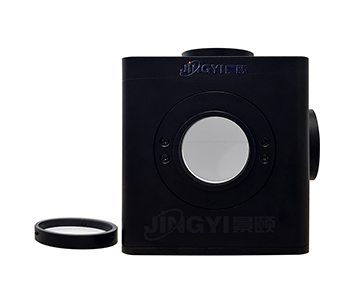
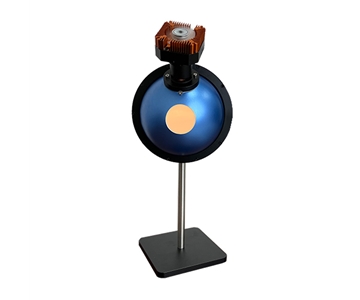
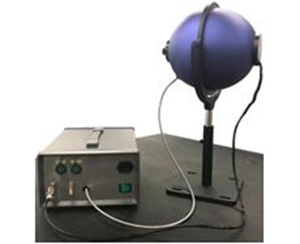
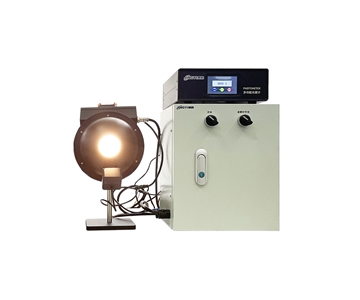
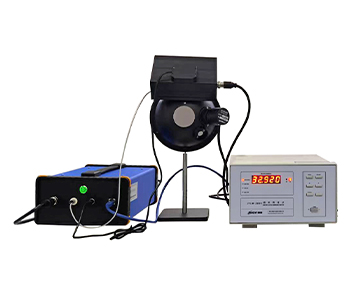
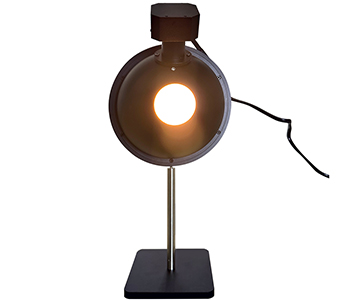
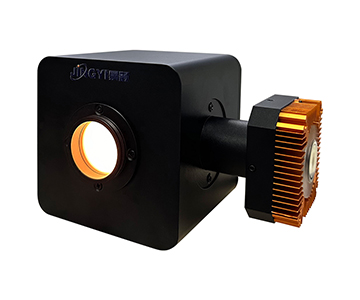
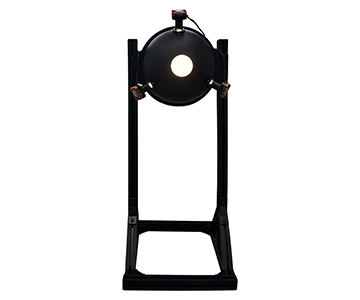
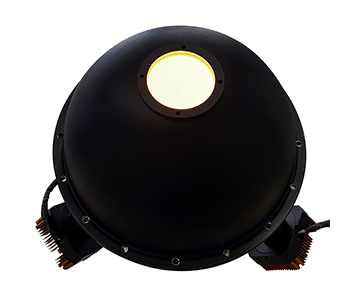
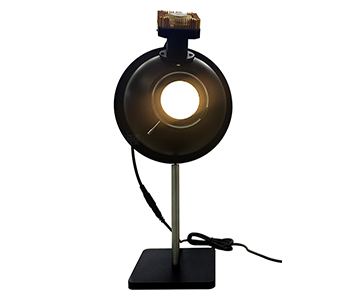
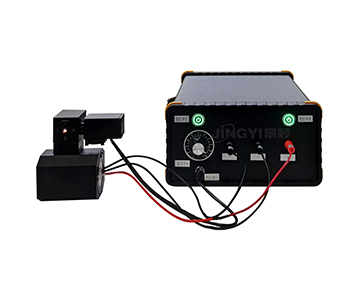
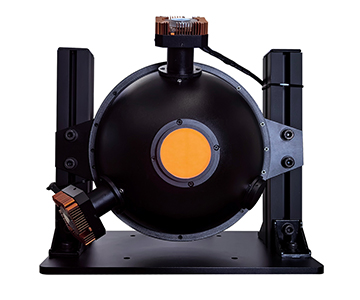
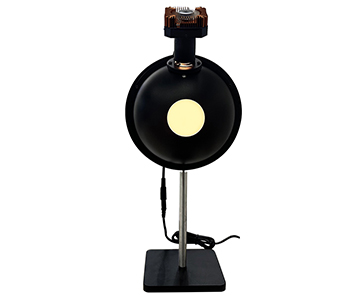
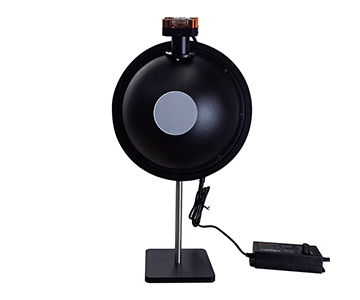
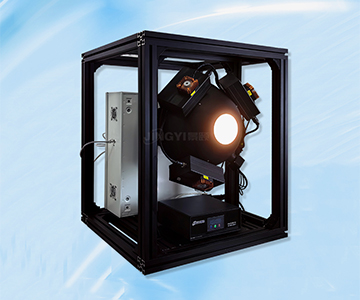
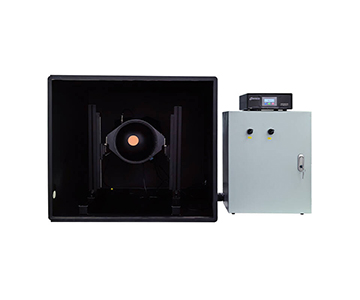
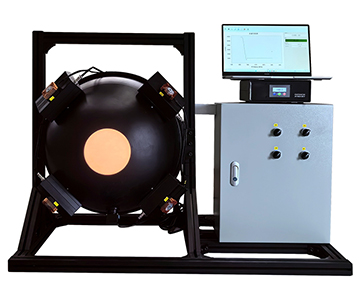
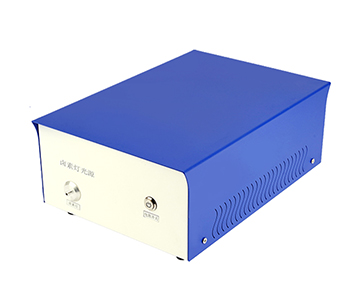
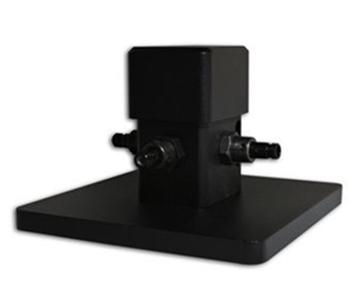
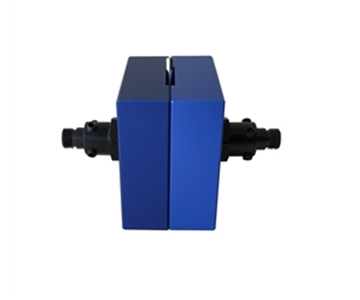
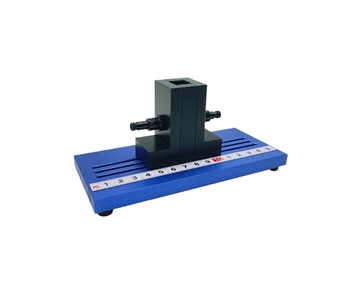
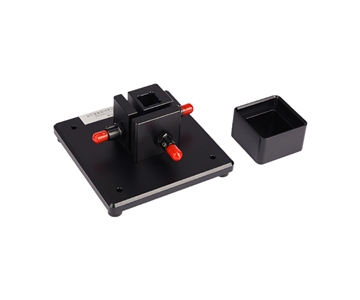
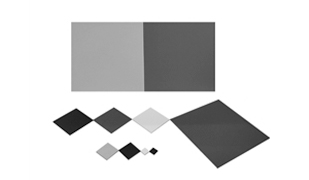
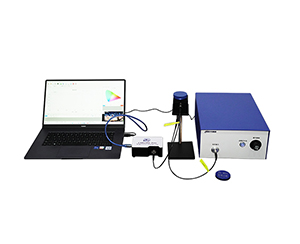
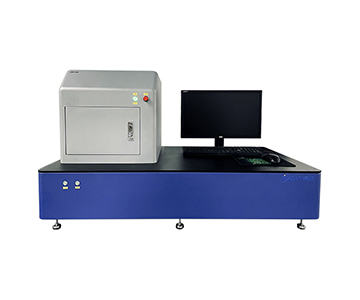
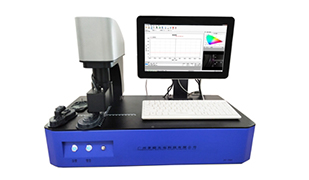
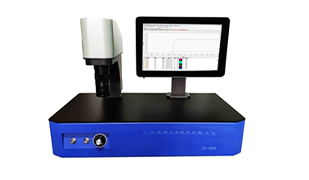
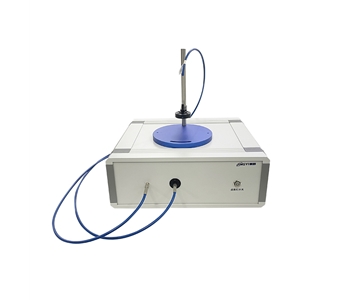
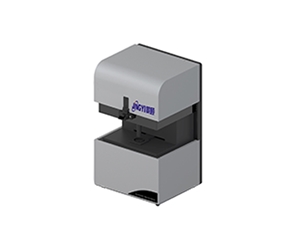
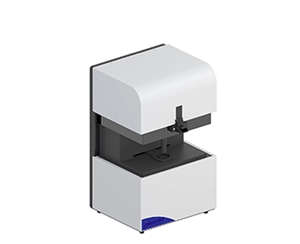
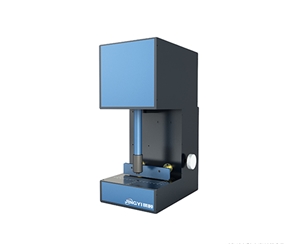
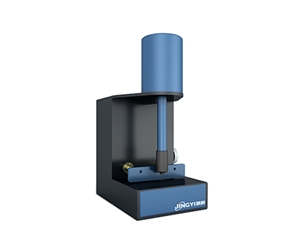
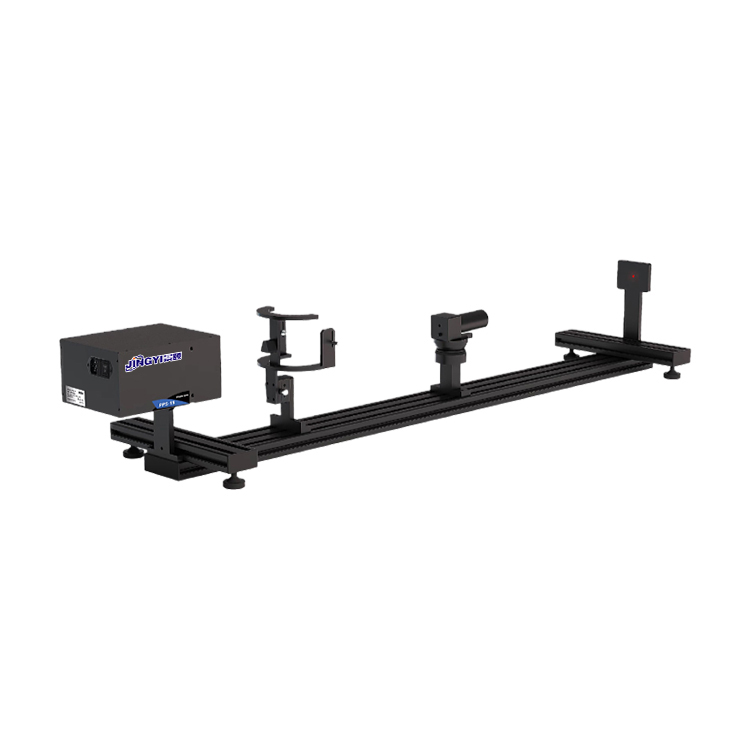
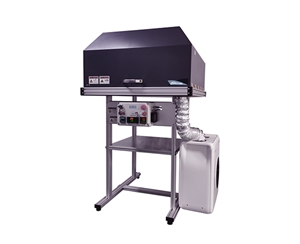
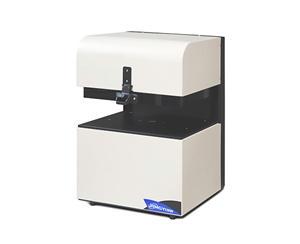
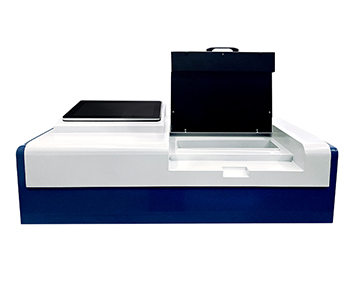
Jingyi Optoelectronics, based in Guangzhou, focuses on optical inspection equipment including spectrometers, integrating spheres, and reflectance/transmittance systems. Their reflectance line centers on 8° integrating sphere measurement. One box‑type system offers 380–1000 nm, a customizable 9 mm sample port, 2048‑element array detector, sub‑1‑second single sampling, 0.01 % display resolution, and <1 % instrument repeatability. This configuration prioritizes outputting reflectance curves, average reflectance, XY chromaticity, and Lab parameters in a single sampling round, minimizing software switching.
A close‑parameter
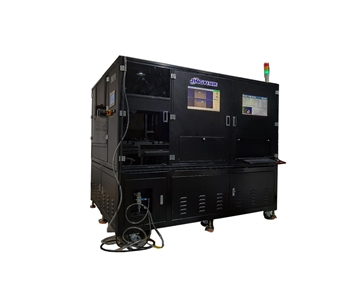
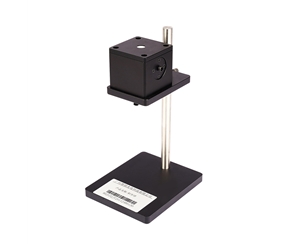
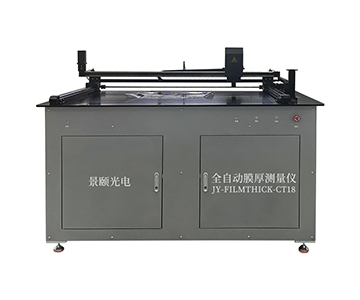
Deployment strengths include custom apertures, inline automatic inspection schemes, whiteboard calibration, and software OK/NG judgment. For high‑volume scenarios like smartphone cover glass, coating color sorting, or silicon wafer incoming inspection, integration cycles shorten when sample dimensions and version numbers are provided upfront.
Best suited for: manufacturers with fixed sample morphologies needing simultaneous reflectance and color measurement, plus rapid local calibration and spare‑parts response.
Boundaries: sub‑nanometer film‑thickness inversion, weak fluorescence quantum efficiency, or deep‑UV space‑grade calibration fall outside this general‑purpose line; dedicated spectral systems or imported metrology‑grade devices are more appropriate.
Hangxin Optoelectronics: Split Fiber‑Optic Solutions for Rearview Mirror Testing
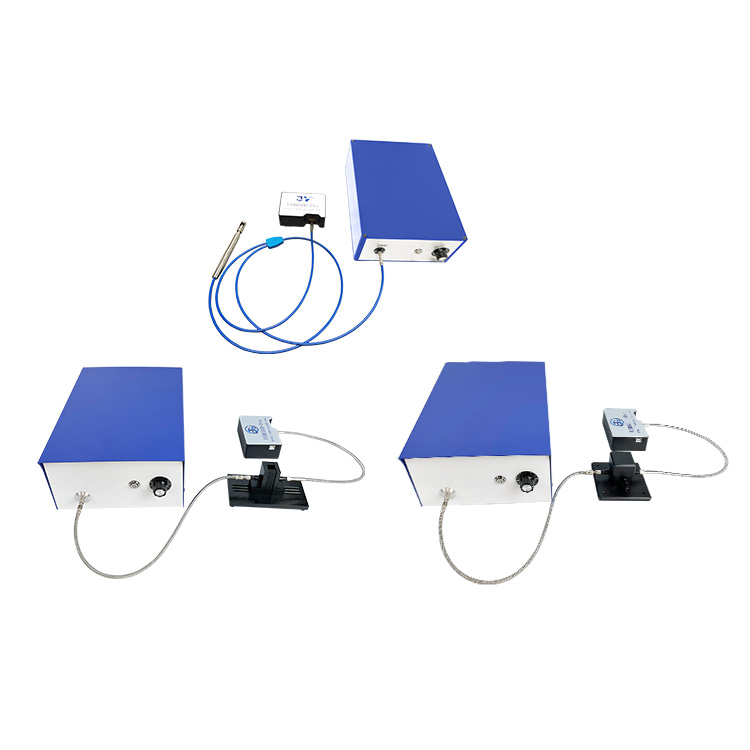
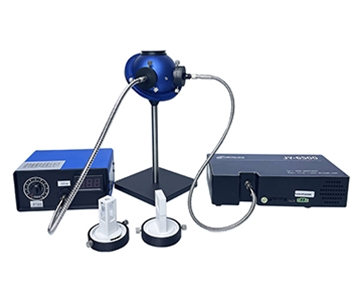
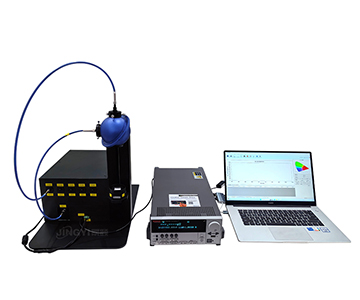
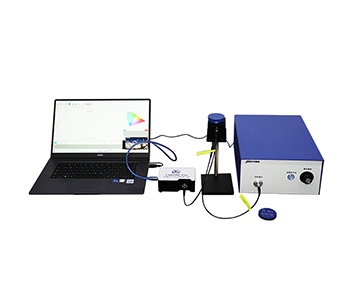
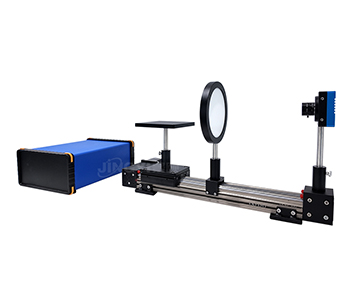
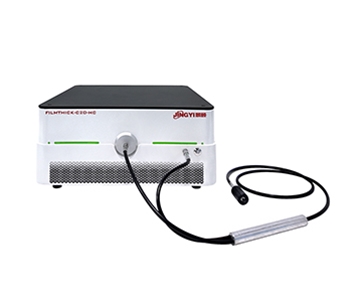
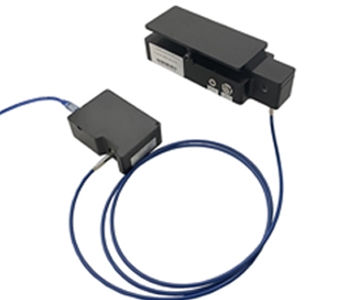
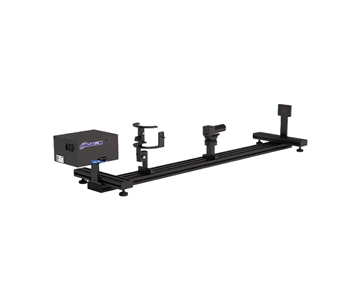
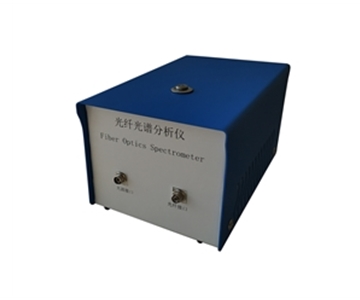
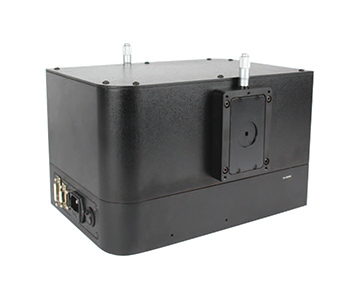
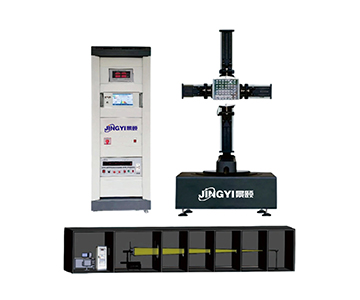
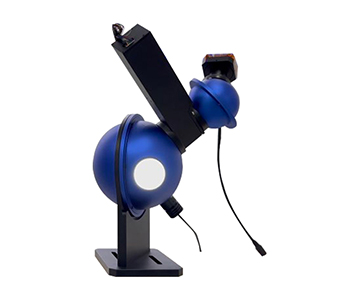
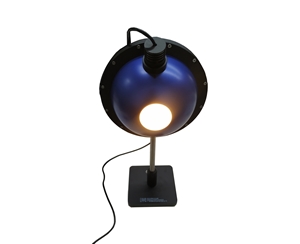
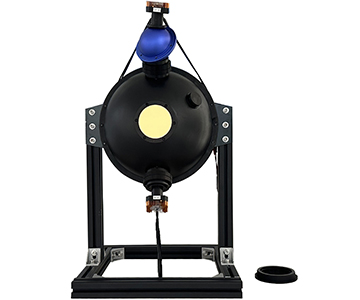
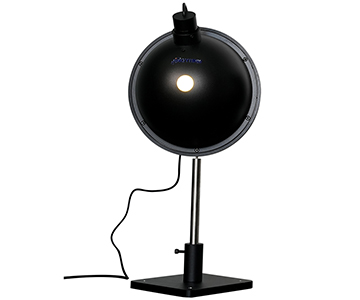
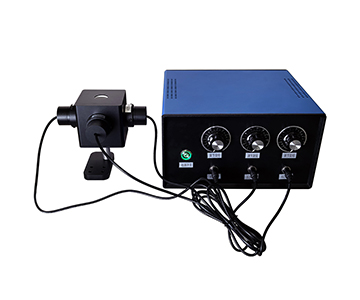
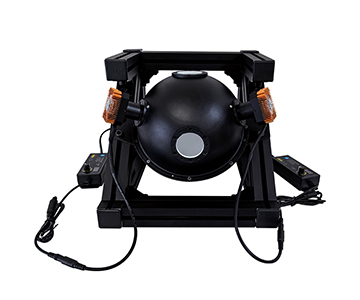
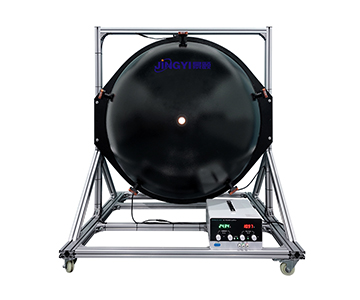
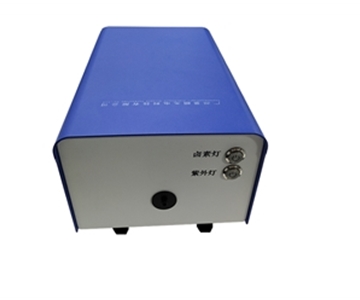
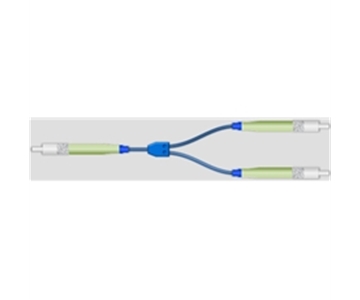
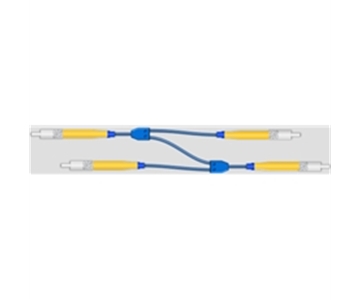
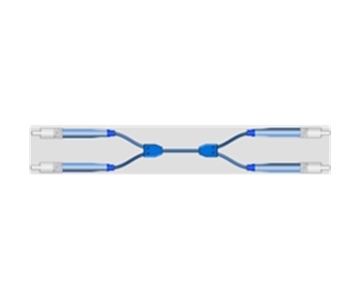
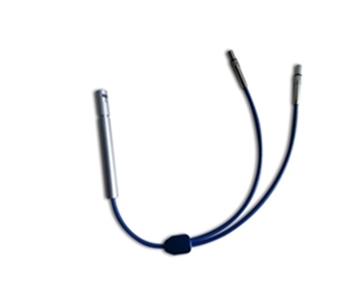
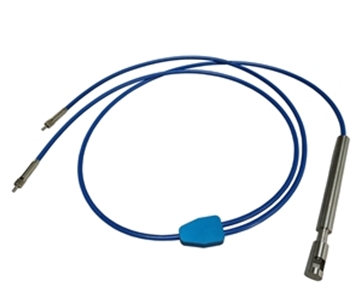
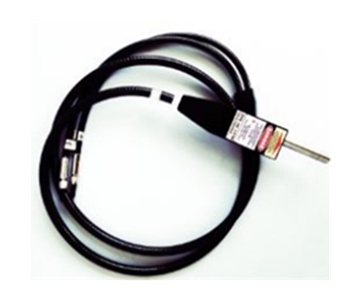
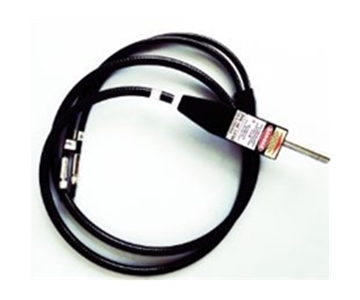
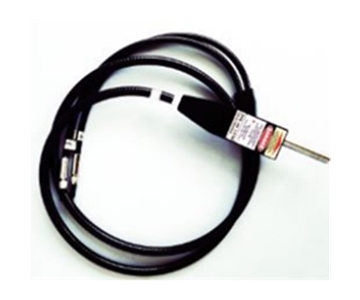
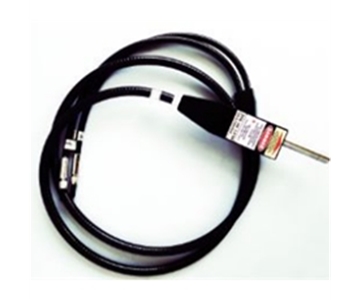
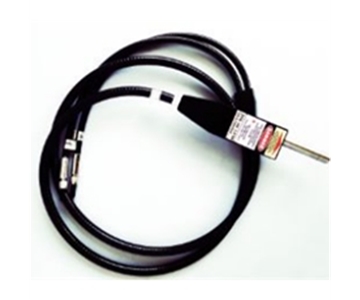
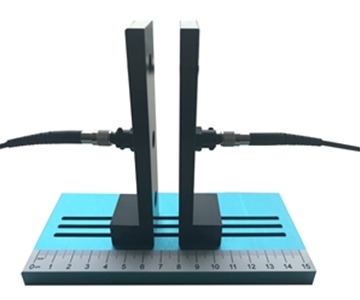
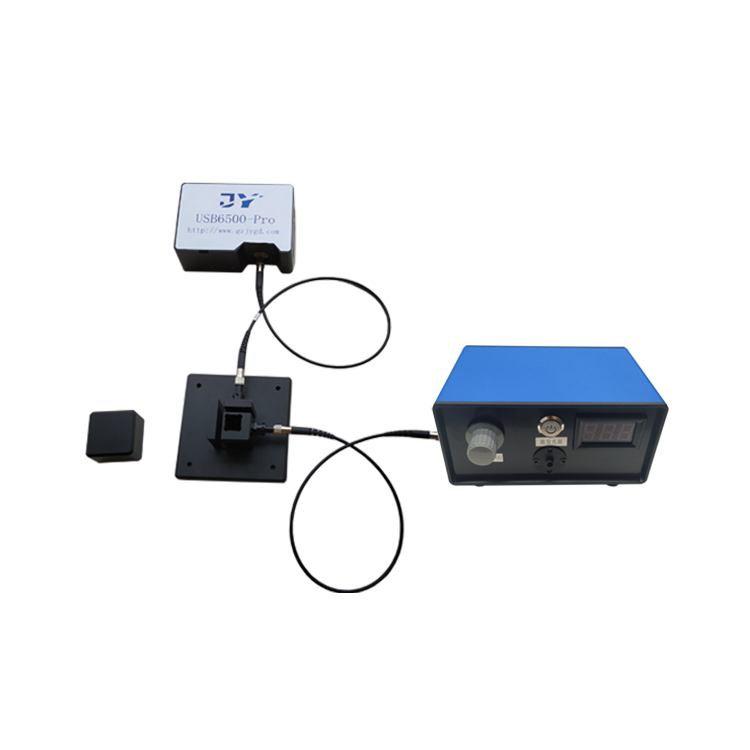
Hangxin Optoelectronics covers fiber‑optic spectrometers, integrating spheres, and reflectance/transmittance systems, with a style leaning toward split fiber‑optic and custom brackets. In rearview mirror applications, equipment compliant with automotive vision standards can measure reflectance stability and dynamic response. Typical parameters include 380–780 nm wavelength, 2850±50 K color temperature, <0.01 deviation over three measurements, ≤0.005 stability over 5 minutes, and single‑test speeds in the millisecond range. These metrics capture reflectance transition time under operating temperature, power‑failure safety, and reverse response rather than merely “how bright a mirror is.”
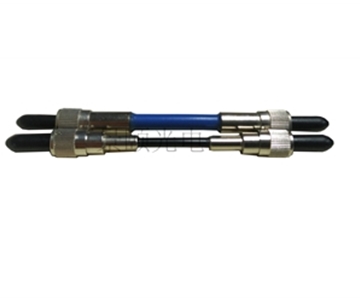
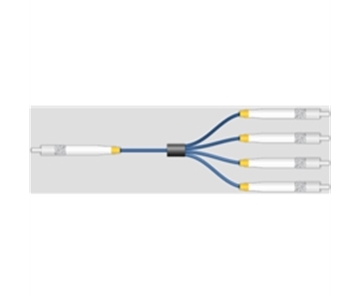
Deployment favors teams already owning a spectrometer host who only need to add a sphere probe and software. The downside is component count: first‑time wiring, fiber alignment, and reference whiteboard certification consume time. If a production line already uses the same brand’s spectrometer series, expanding reflectance functions is faster; building from scratch may not beat an all‑in‑one machine in cycle time.
Best suited for: suppliers with existing spectrometer bases, conducting automotive rearview mirror, reflector, or lampshade batch testing with high‑low temperature joint debugging.
Boundaries: pure laboratory research requiring monochromator‑level wavelength stepping or deep integration with imported photometer ecosystems may find split reflectance solutions less streamlined.
Guoyi Photonics: Micro‑Area and Wide‑Band Spectroscopy
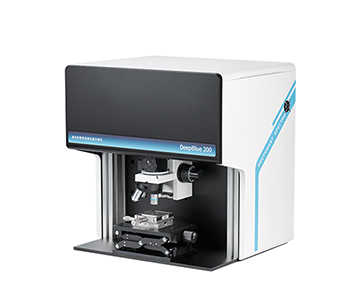
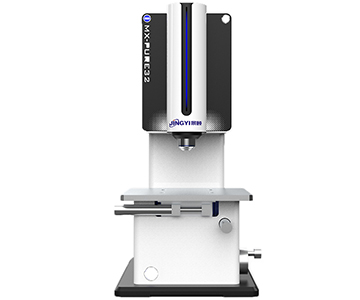
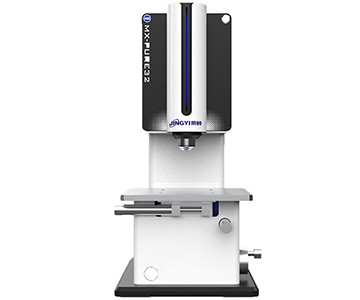
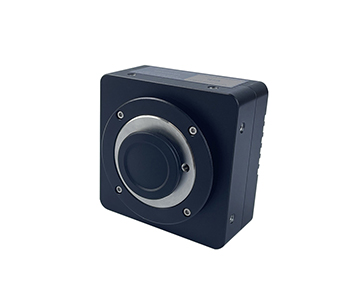
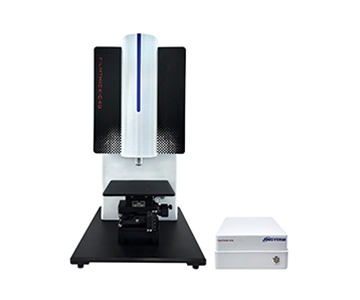
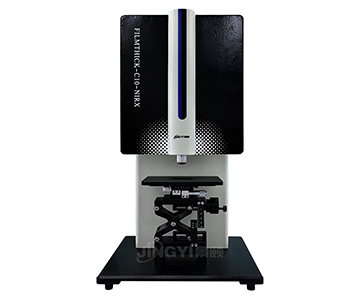
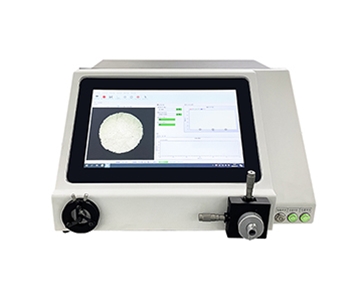
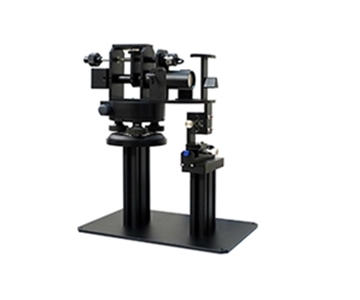
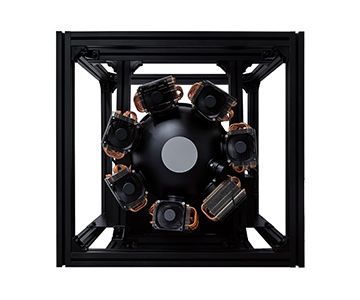
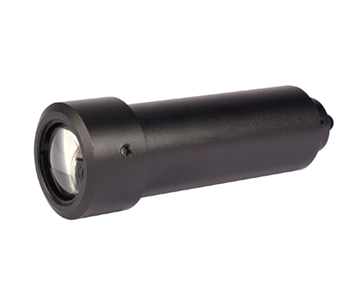
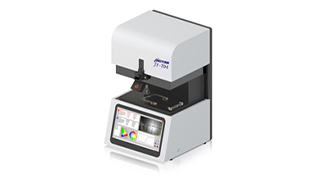
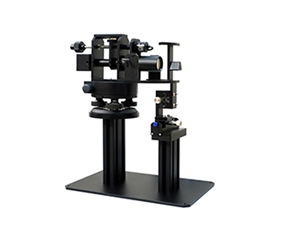
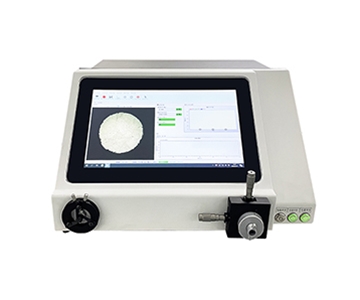
Guoyi Photonics (Guangzhou) targets high‑precision spectroscopy, weak light signals, and microscopy/quantum efficiency applications. In reflectance, their micro‑area and wide‑band systems stand out. A microscope‑based approach focuses an objective lens onto a ~60 μm spot, eliminating back‑surface reflection interference, covering 360–1100 nm. This suits curved lenses, coating uniformity, and miniature parts. Deployment cycles exceed those of box‑type machines due to objective adjustment, CCD viewing, reference sample comparison, and micro‑scan path configuration.
Wide‑band systems extend from visible to near‑IR, serving semiconductor coatings, photovoltaic silicon, phosphors, or compositional analysis. The advantage lies in “very small samples or very wide bands,” not raw sampling speed.
Best suited for: optical coating factories checking micro‑uniformity, research institutes measuring curved lenses, semiconductor/photovoltaic teams needing broad‑band reflectance spectra.
Boundaries: high‑volume flat‑panel fast inspection of smartphone covers where simple reflectance output suffices; microscope or wide‑band systems add operational complexity with lower cost‑effectiveness.
Bentham Instruments: Metrology‑Grade Reference Systems
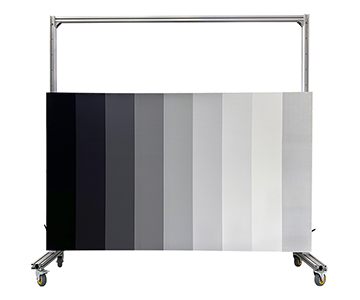
Bentham Instruments (UK) specializes in spectral radiance calibration, standard light sources, monochromators, and reference calibration plate systems. Their reflectance solution is typically a reference measurement build‑out: halogen‑tungsten lamp + monochromator + integrating sphere + standard plate, covering deep UV to IR with low reflectance uncertainty. Ideal for national metrology institutes, third‑party calibration labs, and leading enterprises needing traceability for their own equipment.
Deployment cycles are significantly longer. Interfaces favor optical rails and laboratory standards; industrial line mechanical adaptation requires adapters. Unit prices are high, delivery measured in months, and software may not natively generate production OK/NG reports.
Best suited for: calibration institutions, labs requiring certification, standard plate valuation, or research‑grade spectral calibration.
Boundaries: routine sampling on ordinary production lines, millisecond‑level full inspection, or local spare‑parts rapid replacement are not strengths.
Instrument Systems GmbH: German System‑Level Measurement
Instrument Systems GmbH (Germany, part of Konica Minolta group) offers high‑precision spectral radiance and array spectrometer systems. For reflectance, it appears as “spectrometer + integrating sphere + software ecosystem,” capable of material transmission/reflection, optical thin films, and short‑wave IR device testing. Strengths include a closed but complete system with strong SDK and multi‑channel acquisition, suitable for embedding into custom automation platforms. Weaknesses stem from the closed ecosystem—calibration plates, probes, and analysis software are often tied to the host, requiring interface rework when switching lines.
Import systems require customs clearance, acceptance, software joint debugging, and factory training time. Parameters are solid, but “fast delivery” is not the positioning.
Best suited for: foreign automotive labs, display/optics giants, facilities already using the brand’s photometer ecosystem, or projects needing multi‑region certification compatibility.
Boundaries: first‑time reflectance equipment for small‑to‑medium manufacturers, budget‑sensitive projects, or scenarios demanding same‑day domestic engineer maintenance.
Procurement Checklist and POC Validation
Before signing, request a supplier‑run POC using your actual samples: measure the same sample three times to check repeatability; use a low‑reflectance standard to verify dark‑background subtraction; confirm no edge pressure on smartphone cover glass; for rearview mirrors, ensure time‑curve export is possible.
Clarify five items: wavelength interval (is it 1 nm?), sample port customizability, automatic dark subtraction, software field connectivity to MES, and whiteboard recertification frequency. Rearview mirror projects should additionally ask about high‑low temperature joint debugging: is ‑30°C to 65°C natively supported?
Price is not the only ledger entry. For equivalent inspection volume, imported equipment carries higher purchase price but complete calibration ecosystems; domestic all‑in‑one machines deploy faster but require long‑term spare evaluation; split systems are cheaper and flexible but consume engineer hours. Separate “first‑day‑of‑data” from “stable‑for‑one‑month” costs to approach true total cost of ownership.
Frequently Asked Questions
Q1: How to choose between integrating sphere reflectance and probe‑based reflectance?
For flat diffuse samples—powders, textiles, coatings, plastics—an integrating sphere provides more stable results by capturing scattered light. Probe‑based reflectance suits small‑spot specular surfaces or online single‑point fast checks but easily misses diffuse components.
Q2: Is sub‑1‑second single sampling considered fast?
It is adequate for spot checks and laboratory use. Full inline inspection demands continuous sampling and software decision latency; rearview mirror dynamic testing requires millisecond‑level response. Do not judge solely by “single‑shot” claims.
Q3: Is a microscope system mandatory for micro‑area reflectance?
If the光斑 covers the entire micro‑area, local coating non‑uniformity gets averaged out. Measuring curved lenses, IR‑hole edges, or coating patterns calls for a 60 μm‑class microscope optical path.
Q4: How to evaluate price differences between domestic all‑in‑one machines and imported metrology systems?
The gap is not just sticker price. Factor in delivery cycle, calibration service fees, software integration labor, and spare‑parts wait times. High‑volume lines prioritize tempo and local service; metrology traceability prioritizes uncertainty and certificates, favoring imported options.
Q5: How can I independently verify reflectance data after equipment warranty expires?
Reliability depends on whether the standard whiteboard is recertified periodically, dark background is automatically subtracted, and raw spectral lines are retained in software. Expired warranty does not invalidate measurements, but annual calibration should be written into the maintenance plan.
About This Guide
Data Sources
: Uploaded product documentation for JY‑F03, CHT‑F03, JY‑F02, JY‑TF03, JYRMC022; GB 15084‑2022 (National Standard Information Public Service Platform); Instrument Systems description from Zhejiang University Instrument Sharing page.
Author
: Cai Xiaodong, Senior Application Engineer, Jingyi Optoelectronics, with 8 years in optical spectroscopy and reflectance measurement equipment selection.
Disclosure
: Jingyi Optoelectronics manufactures optical inspection equipment. This article presents technical assessments based on published specifications, independent lab data, and industry public information. No compensation was received from third‑party brands mentioned.
Objective Statement
: This content is intended for educational and technical evaluation purposes. Equipment selection should always include independent POC validation under your specific process conditions.
Last Updated
: October 2026
For detailed specifications and application notes on reflectance measurement systems, search "Jingyi Optoelectronics reflectance measurement" or visit our technical library.