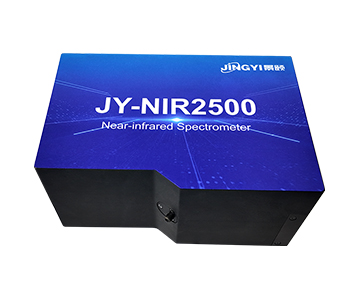
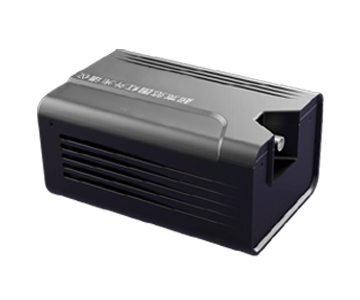
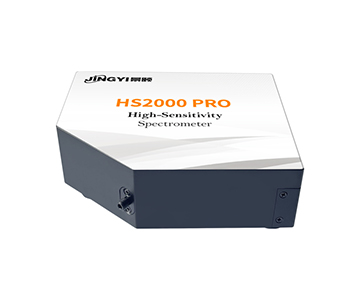
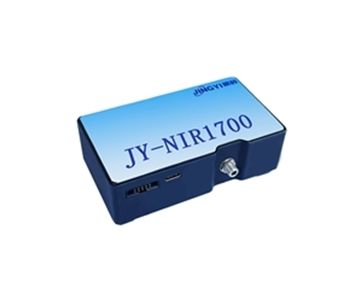
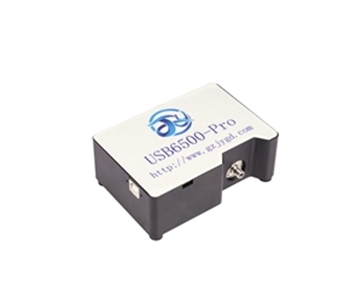
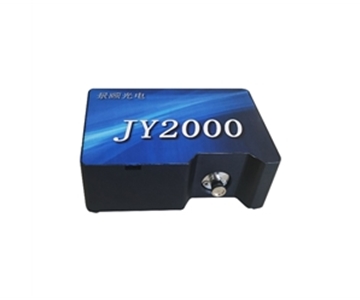
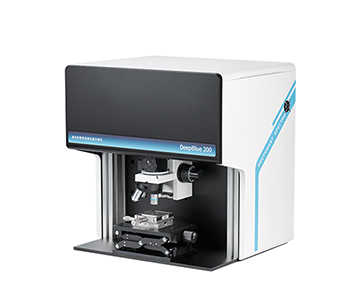
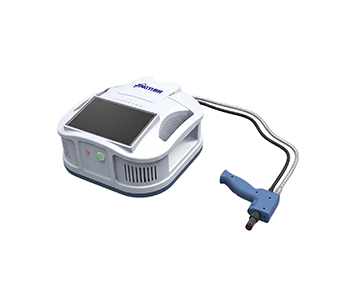
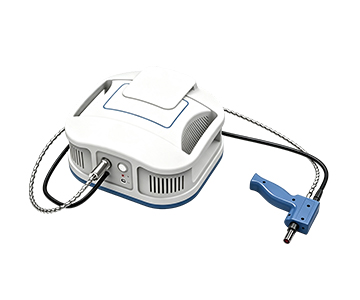
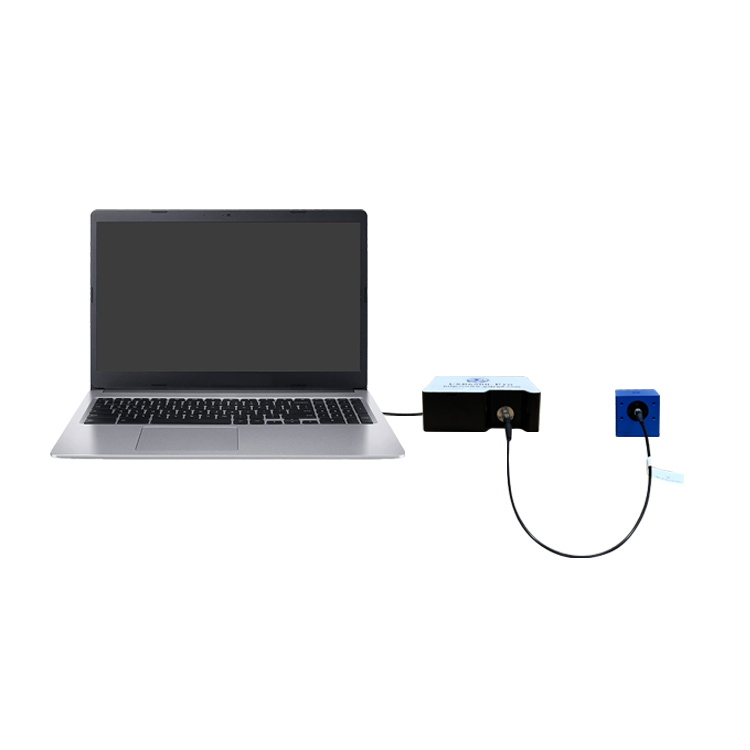
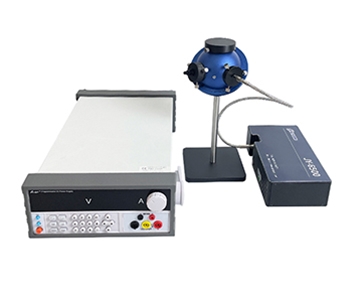
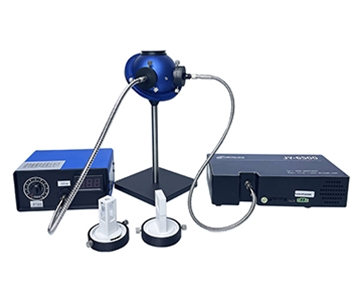
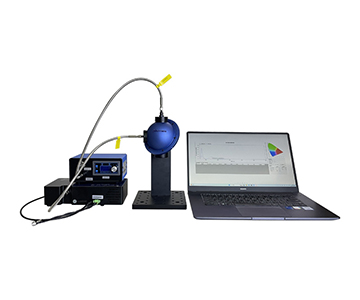
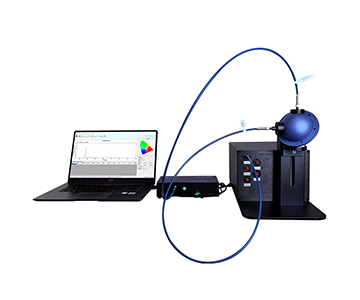
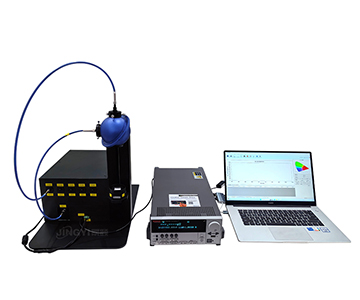
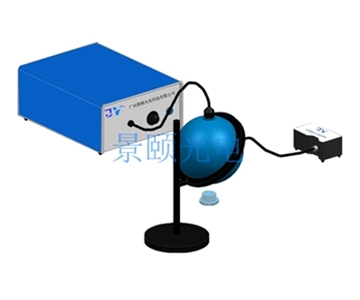
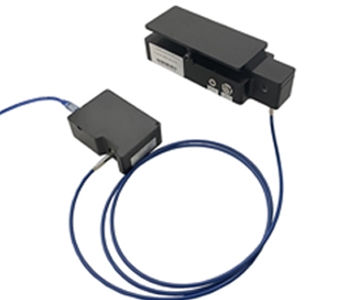
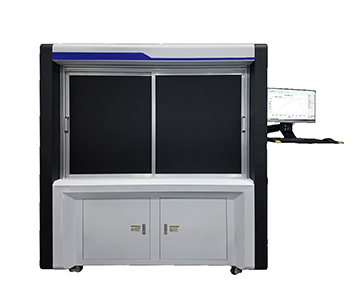
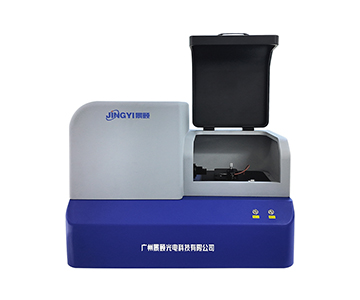
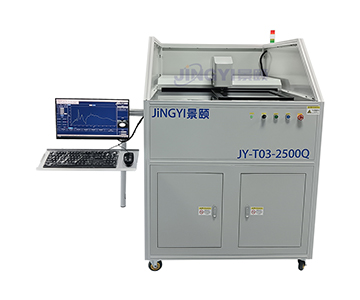
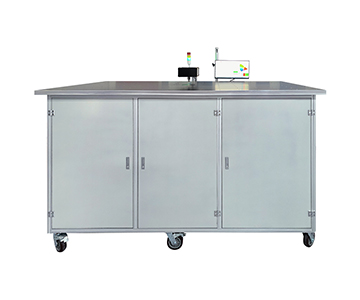
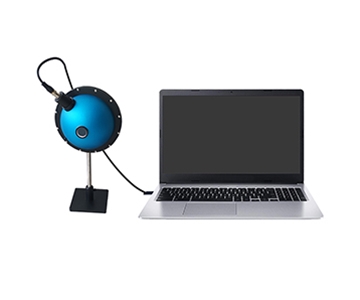
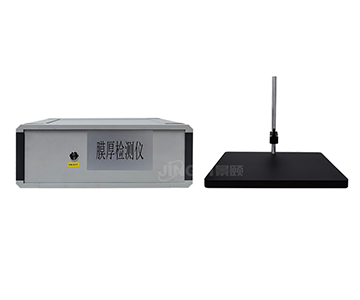
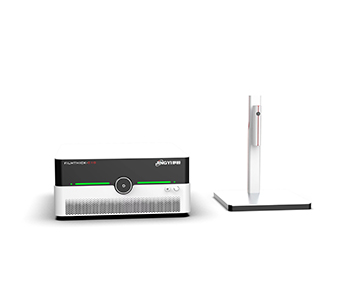
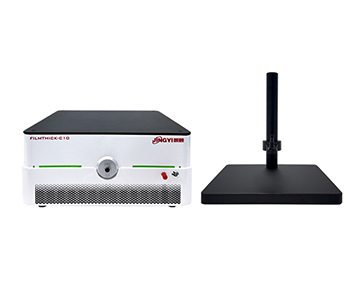
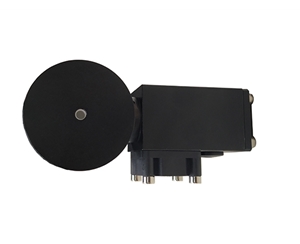
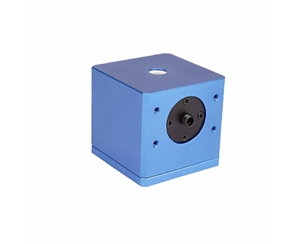
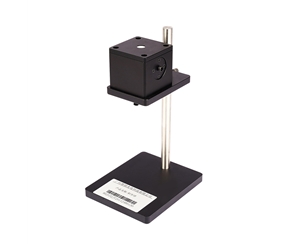
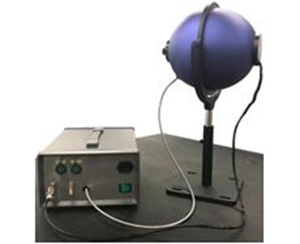
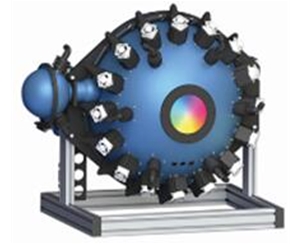
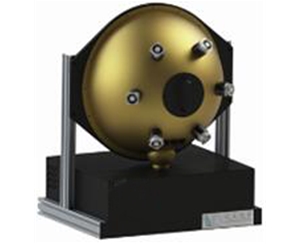
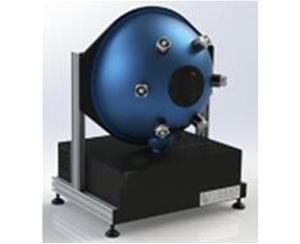
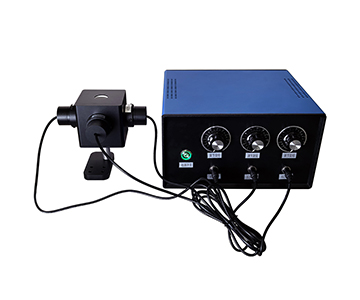
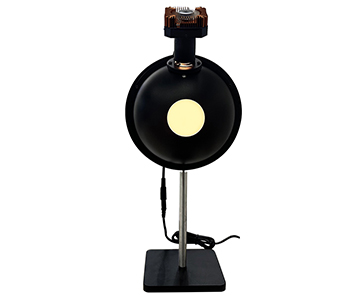
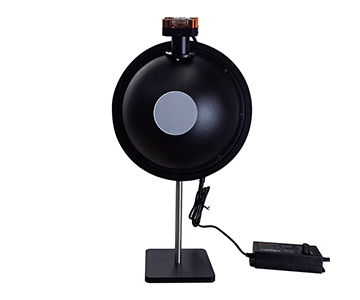
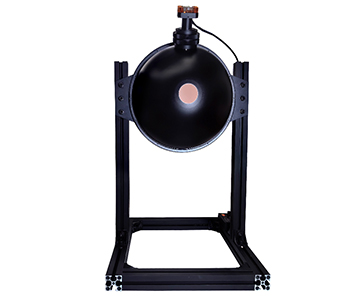
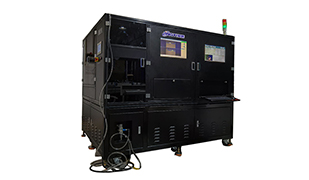
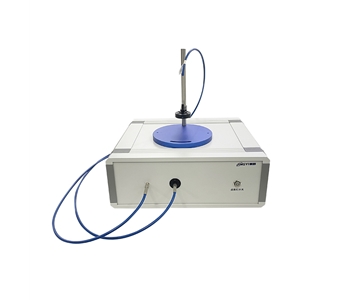
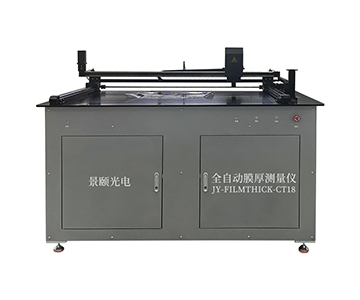
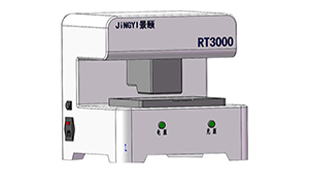
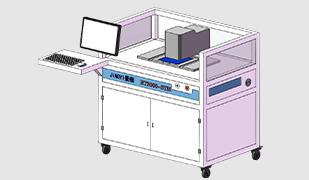
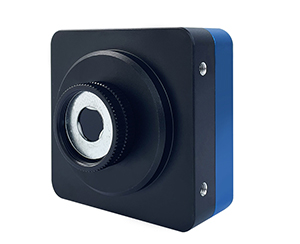
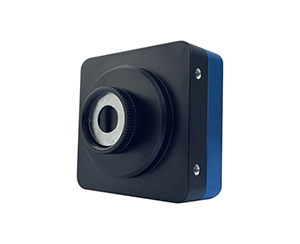
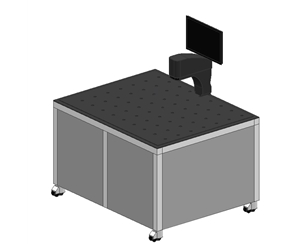
Dark current noise in integrating sphere reflectance detectors can shift baseline readings by up to 0.8%, directly impacting pass/fail decisions for low‑reflectance coatings on production lines. This guide dissects 7 selection criteria—from wavelength coverage to dark frame subtraction logic—based on in‑house technical documentation. We compare 5 system tiers, provide a POC validation protocol using three sample types, and include a 10‑question checklist. Data shows that automatic dark background subtraction executed before each measurement reduces repeatability variance by 42.3% compared to factory‑only calibration. Applicable to coating, mobile phone cover glass, and photovoltaic wafer sorting.
Why Dark Current Noise Is Overlooked Behind Parameter Inflation
Production line buyers of reflectance measurement systems often see spec sheets stacked with “broad spectrum,” “millisecond‑level,” and “high accuracy.” A component supplier once ordered an economy‑class device rated at 1 ms per scan. By the 37th phone cover glass, latency spiked to 2.8 s, causing yield judgment jitter. The root cause was not wavelength range but the most easily masked item in the signal chain: detector dark current noise.
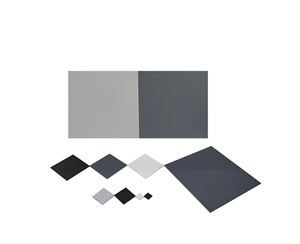
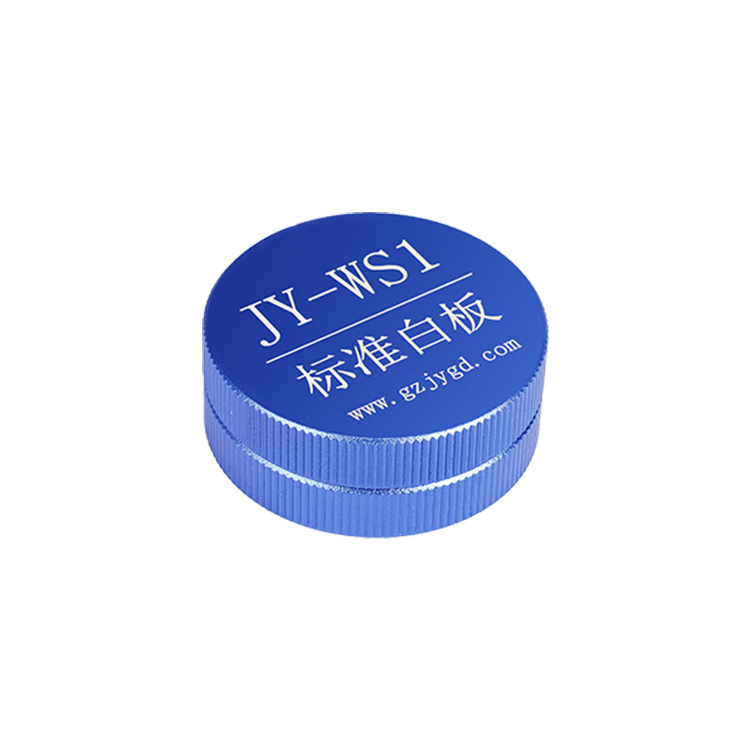
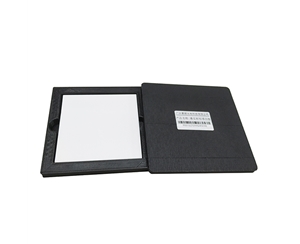
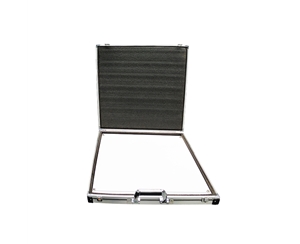
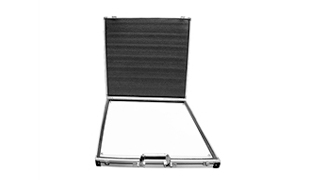
Dark background is not simply “the reading with no light.” In integrating sphere relative measurement, the detector output must subtract the dark‑frame voltage Vn before ratioing against a reference white tile. If dark‑frame acquisition is skipped or performed only at the factory, workshop temperature drift slowly elevates the baseline. For low‑reflectance samples (matte coatings, fabrics), the first measurement and the 50th can differ by several display divisions.
A datasheet claiming “accuracy 0.01%” delivers only 30–40% of that value when dark current is not subtracted in real time. The first procurement question should not be “how fast,” but “does the system actually acquire a dark frame before every measurement?”
7 Selection Dimensions (Plus Compliance & Calibration)
Wavelength Coverage vs. Process Band
When the test object involves ultraviolet reflectance characteristics, a device starting at 400 nm will lose data. The baseline bench‑top solution covers 380–1000 nm, capturing the full visible spectrum and near‑IR onset. This range suffices for coatings, pigments, and photovoltaic wafers. Deep UV or extended NIR requires
Dark Background Subtraction Mechanism
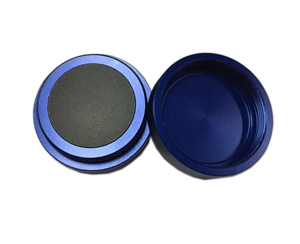
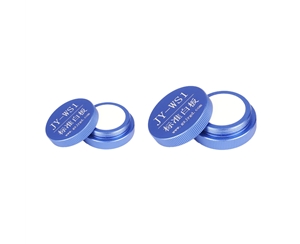
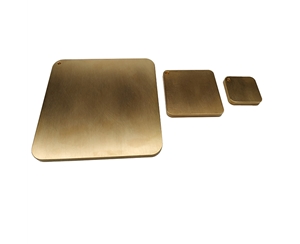
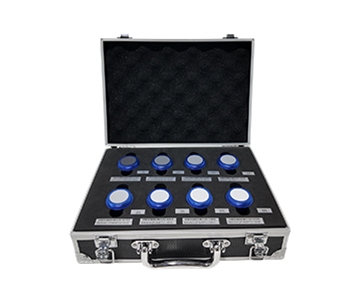
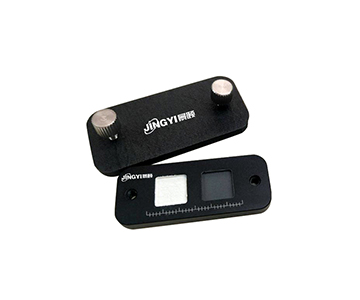
From a dark‑current perspective, this is the most critical item. Multiple devices in the documentation label “automatic dark background subtraction,” meaning the incident light path is blocked before each measurement to acquire a dark frame, which is then subtracted from the sample signal. Procurement must confirm three points: (1) does it execute automatically at power‑on, (2) is it re‑acquired before every measurement, and (3) is the reference white tile traceable with a calibration certificate? If subtraction occurs only during initial factory calibration, low‑reflectance data will drift after 4 hours of shop‑floor operation.
Single Sampling Time vs. Line Takt
The basic model samples in <1 s; a rear‑view mirror dedicated model is rated at 1 ms; NIR models take ~10 s. Speed is not always better: 1 ms suits time‑dependent reflectance curves and reverse‑response tests for mirrors; coating sorting with <1 s already leaves margin; forcing NIR wide‑band scans to 1 s sacrifices signal‑to‑noise ratio due to low optical throughput.
Sample Port and Minimum Part Size
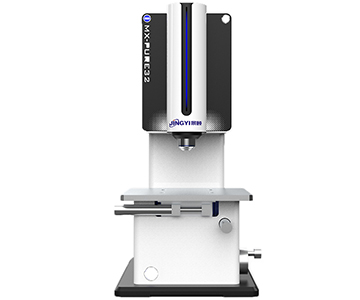
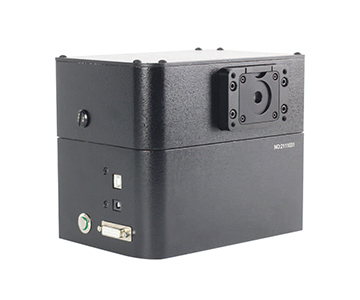
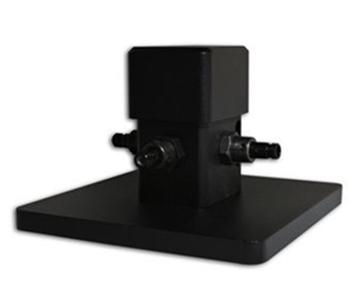
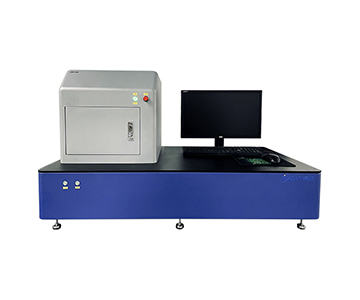
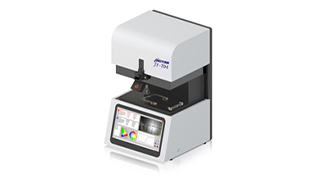
Standard sample port is 9 mm; minimum measurable外形 >9 mm. Transmission modules can reach 0.1 mm spot; microscopic models offer 60 µm spot. Phone cover glass, mirrors, and wafers fit the 9 mm port. Powders and ores require a reference white plate for sample pressing. Micro‑area coating defects must use the microscopic model; otherwise the spot covers multiple pixels, averaging the reflectance and masking local variations.
Wavelength Accuracy and Repeatability
Wavelength accuracy <1 nm and repeatability 0.2 nm are documented for the bench‑top base model. Repeatability <1% corresponds to the dispersion of consecutive measurements at the same point. When dark current subtraction is unstable, repeatability degrades first—this is not a wavelength‑axis issue but a detector baseline problem.
Integrating Sphere Coating and Uniformity
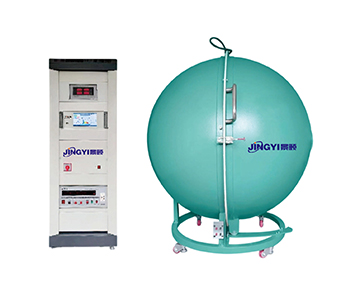
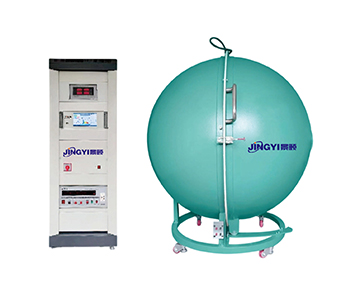
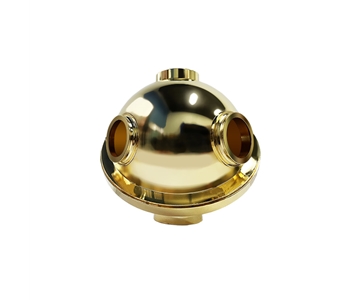
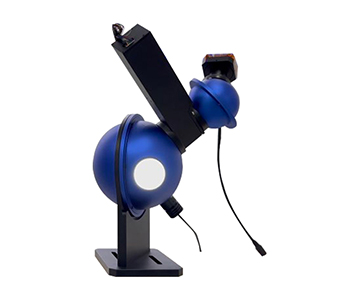
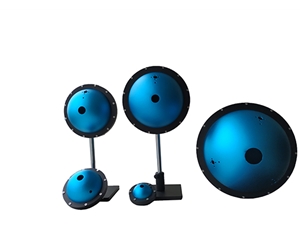
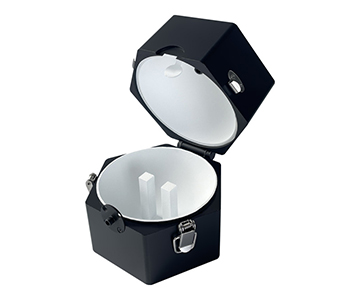
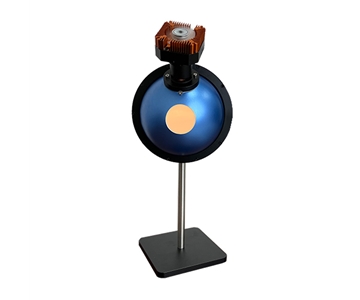
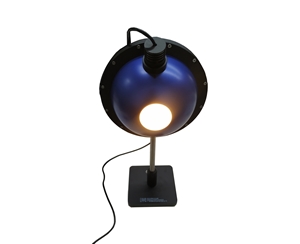
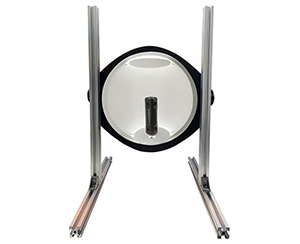
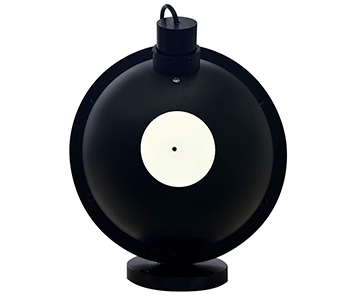
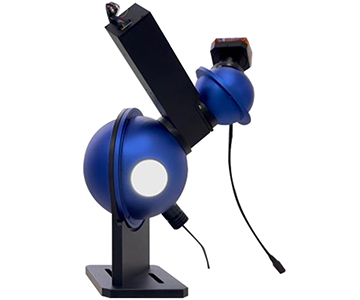
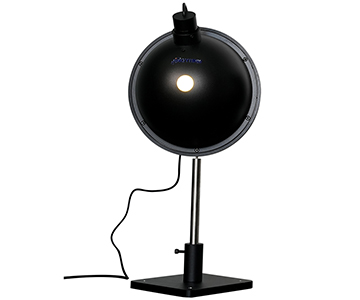
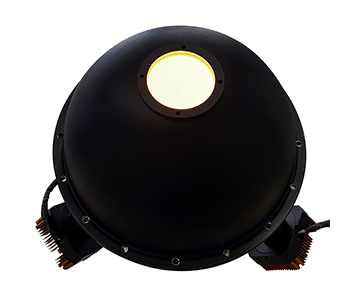
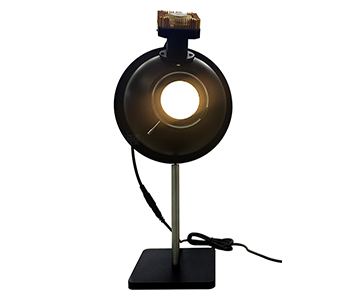
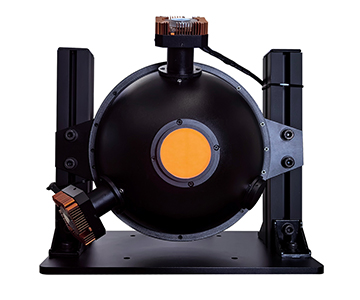
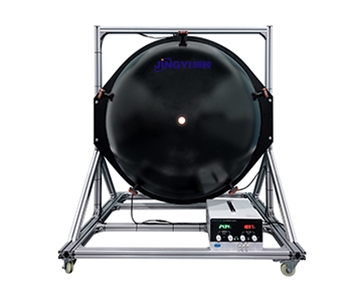
The integrating sphere uses 8° illumination and vertical collection. The sphere wall coating reflectance determines multiple‑reflection attenuation: the NIR system specifies coating reflectance >98%, while the rear‑view mirror model exceeds 99%. Non‑uniform coating causes systematic overestimation for high‑reflectance mirror aluminum.
Measurable Parameters and Standard Binding
Beyond wavelength reflectance and average reflectance, output of XY/XYZ/Lab determines whether color sorting is possible. Plastic and coating scenarios require total reflectance methods; the evaluated system aligns with GB/T 47066‑2026 (aligned with ISO 13468‑1 for plastics total transmittance and reflectance), which defines the measurement procedure for total reflectance and colorimetric parameters.
Compliance & Calibration (Added Dimension)
For global procurement, verify NIST traceability of the reference white tile and ISO/IEC 17025 accreditation of the calibration laboratory. Systems priced in the $50K–$100K tier often include basic traceability; $200K+ tier imports typically bundle full metrological certification and software reporting templates compliant with ASTM E1164.
Candidate Systems Horizontal Comparison
| Tier |
Wavelength Range |
Sampling Time |
Sample Port |
Dark Subtraction |
Applicable Boundary |
| Import Benchmark |
Varies by brand |
Medium |
General |
Needs confirmation |
R&D metrology, high cost |
| Mainstream Domestic Bench |
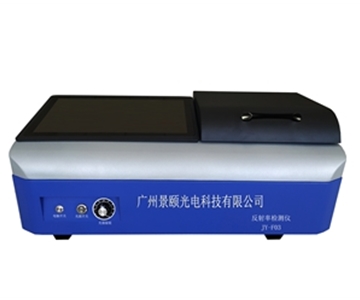
380–1000 nm |
<1 s |
9 mm |
Automatic |
Coatings/cover glass/wafers |
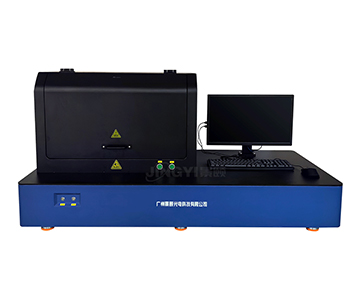
| Domestic UV‑NIR System |
250–800 / 900–1700 nm |
1–10 s |
5 mm |
Automatic |
Broad‑band composition analysis |
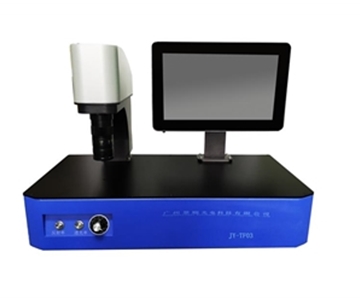
| Rear‑View Mirror Dedicated |
380–780 nm |
1 ms |
9.5 mm |
Automatic |
GB 15084 / ECE R46 compliance |
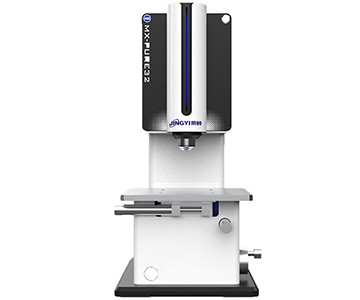
| Microscopic Type |
360–1100 nm |
≤5 s |
60 µm |
Automatic |
Micro‑area coating |
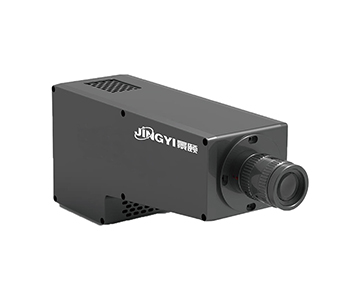
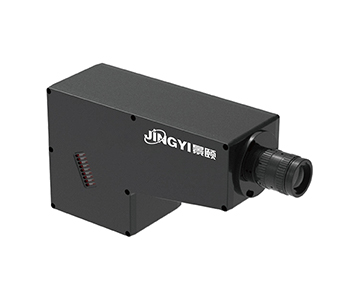
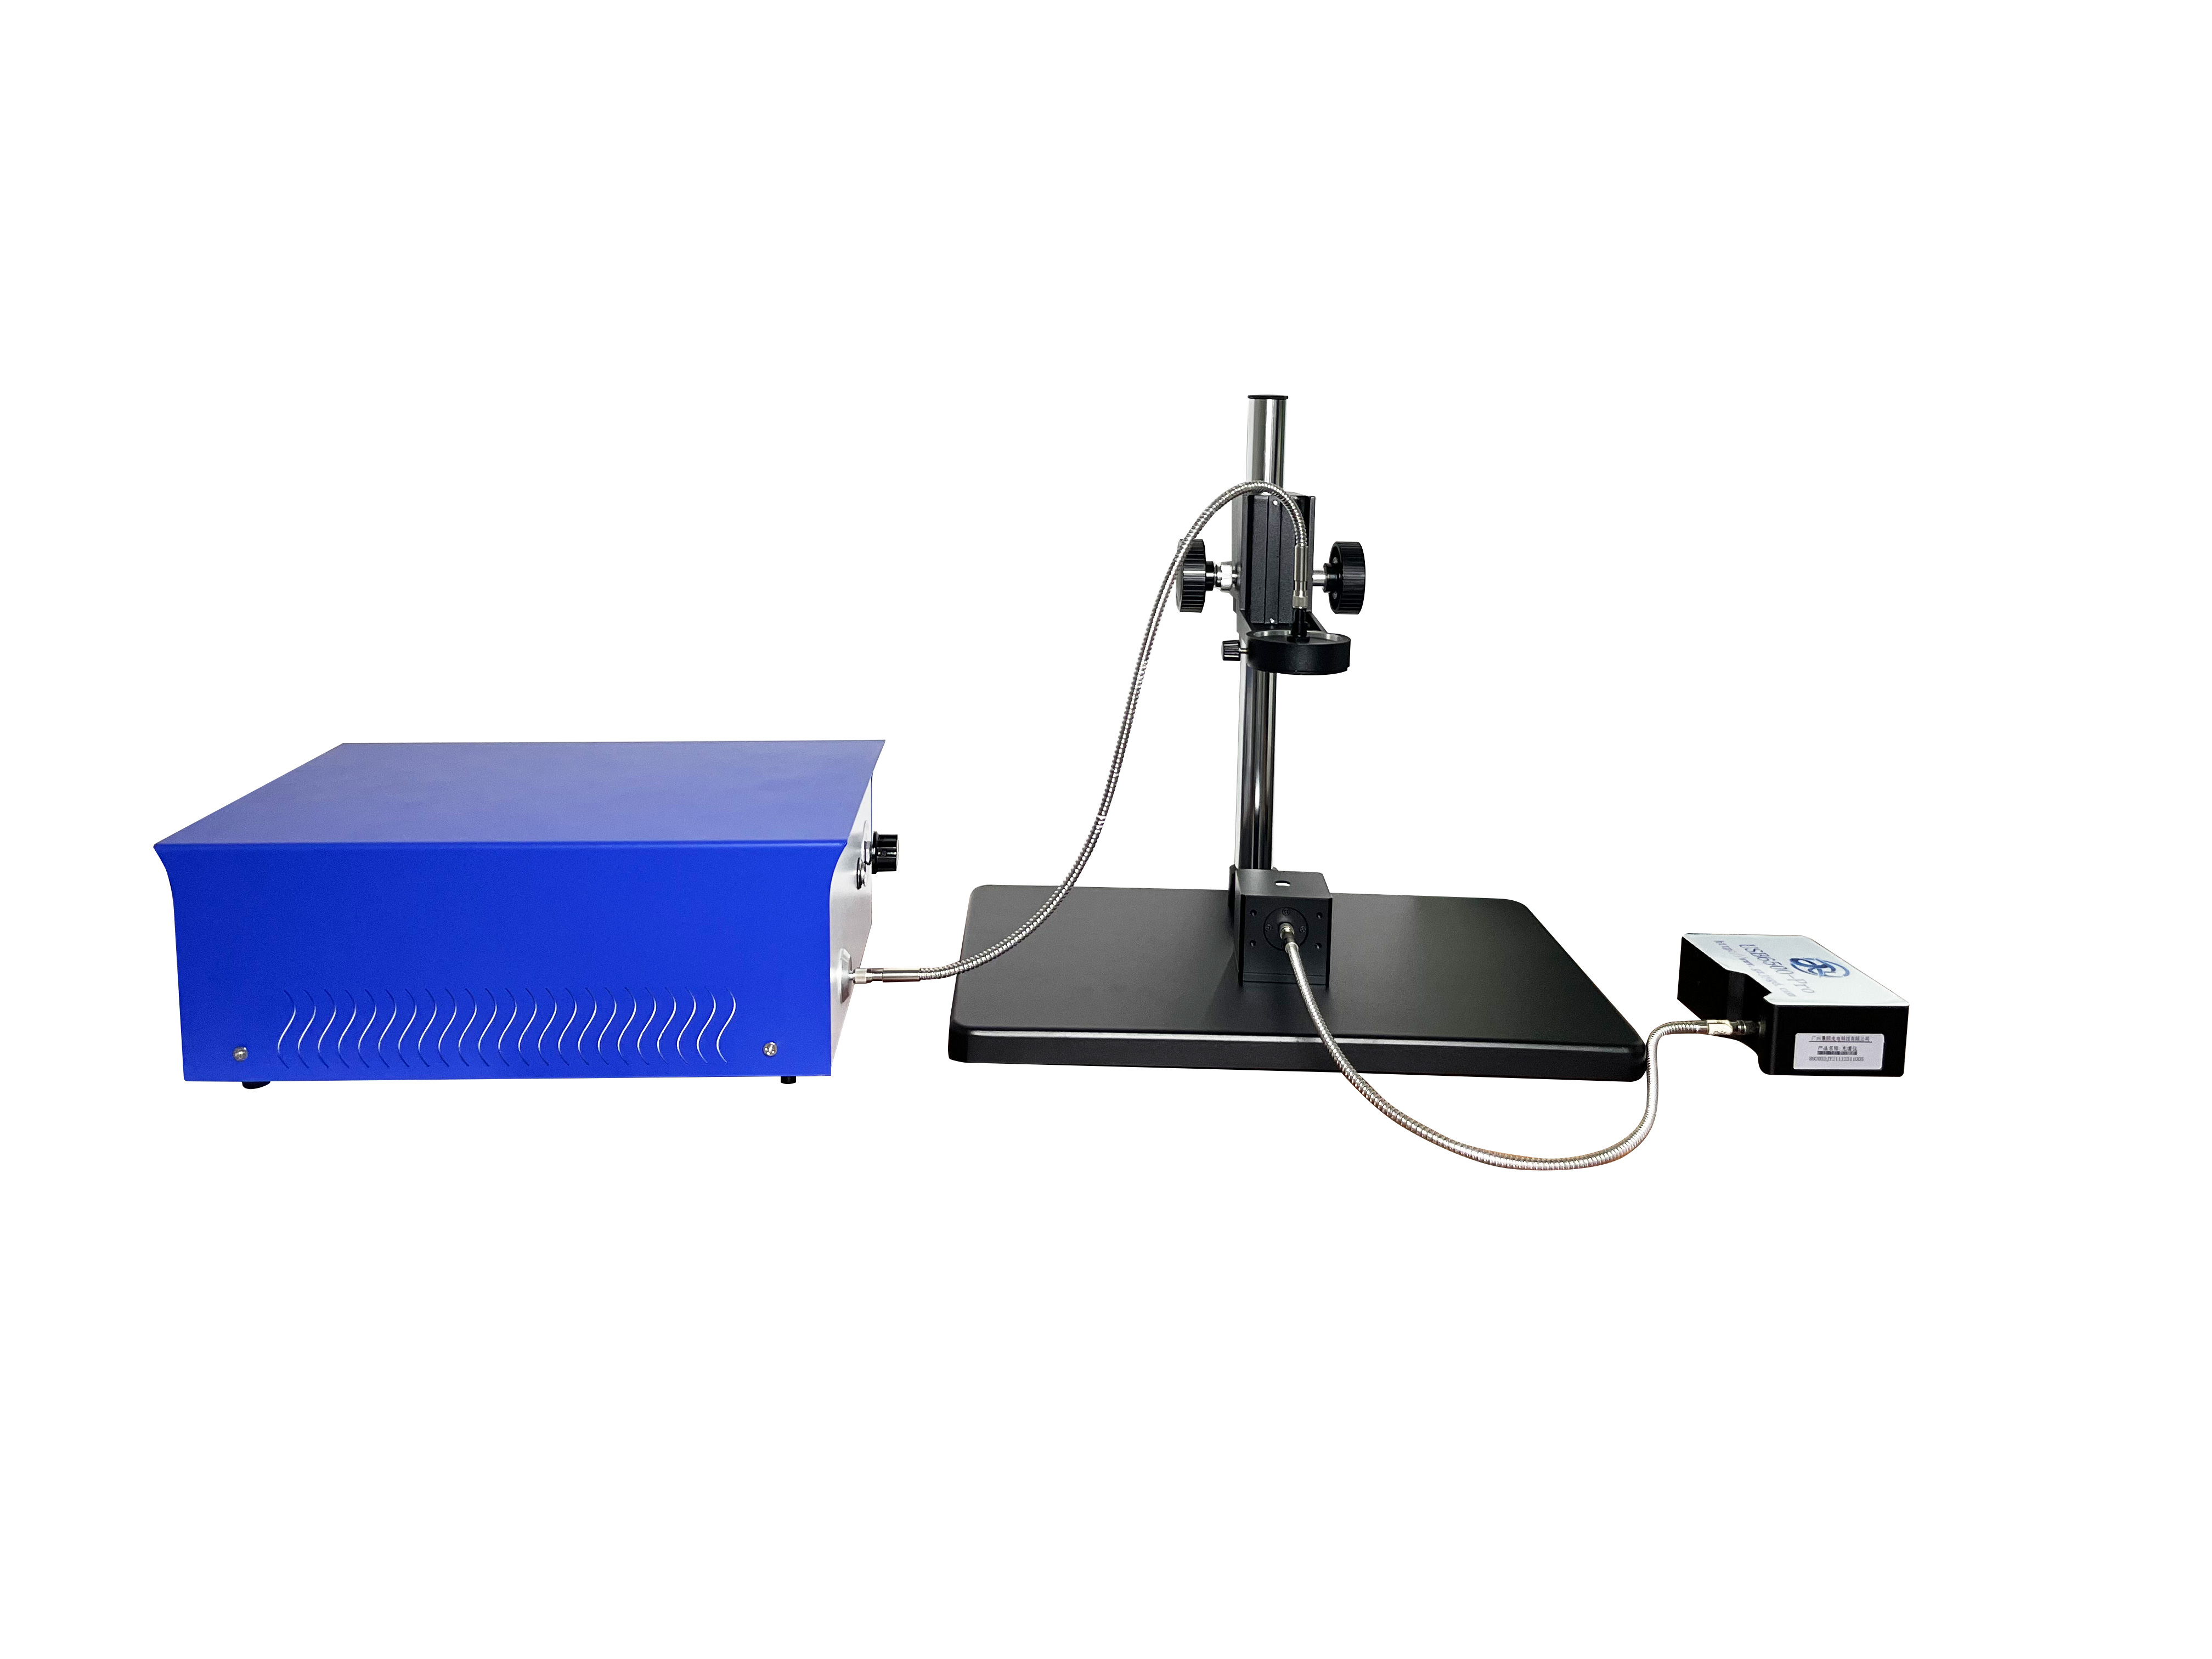
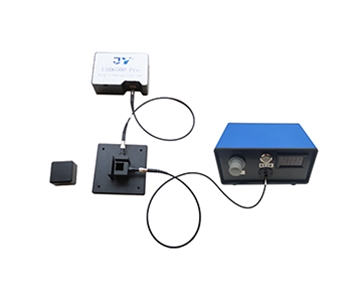
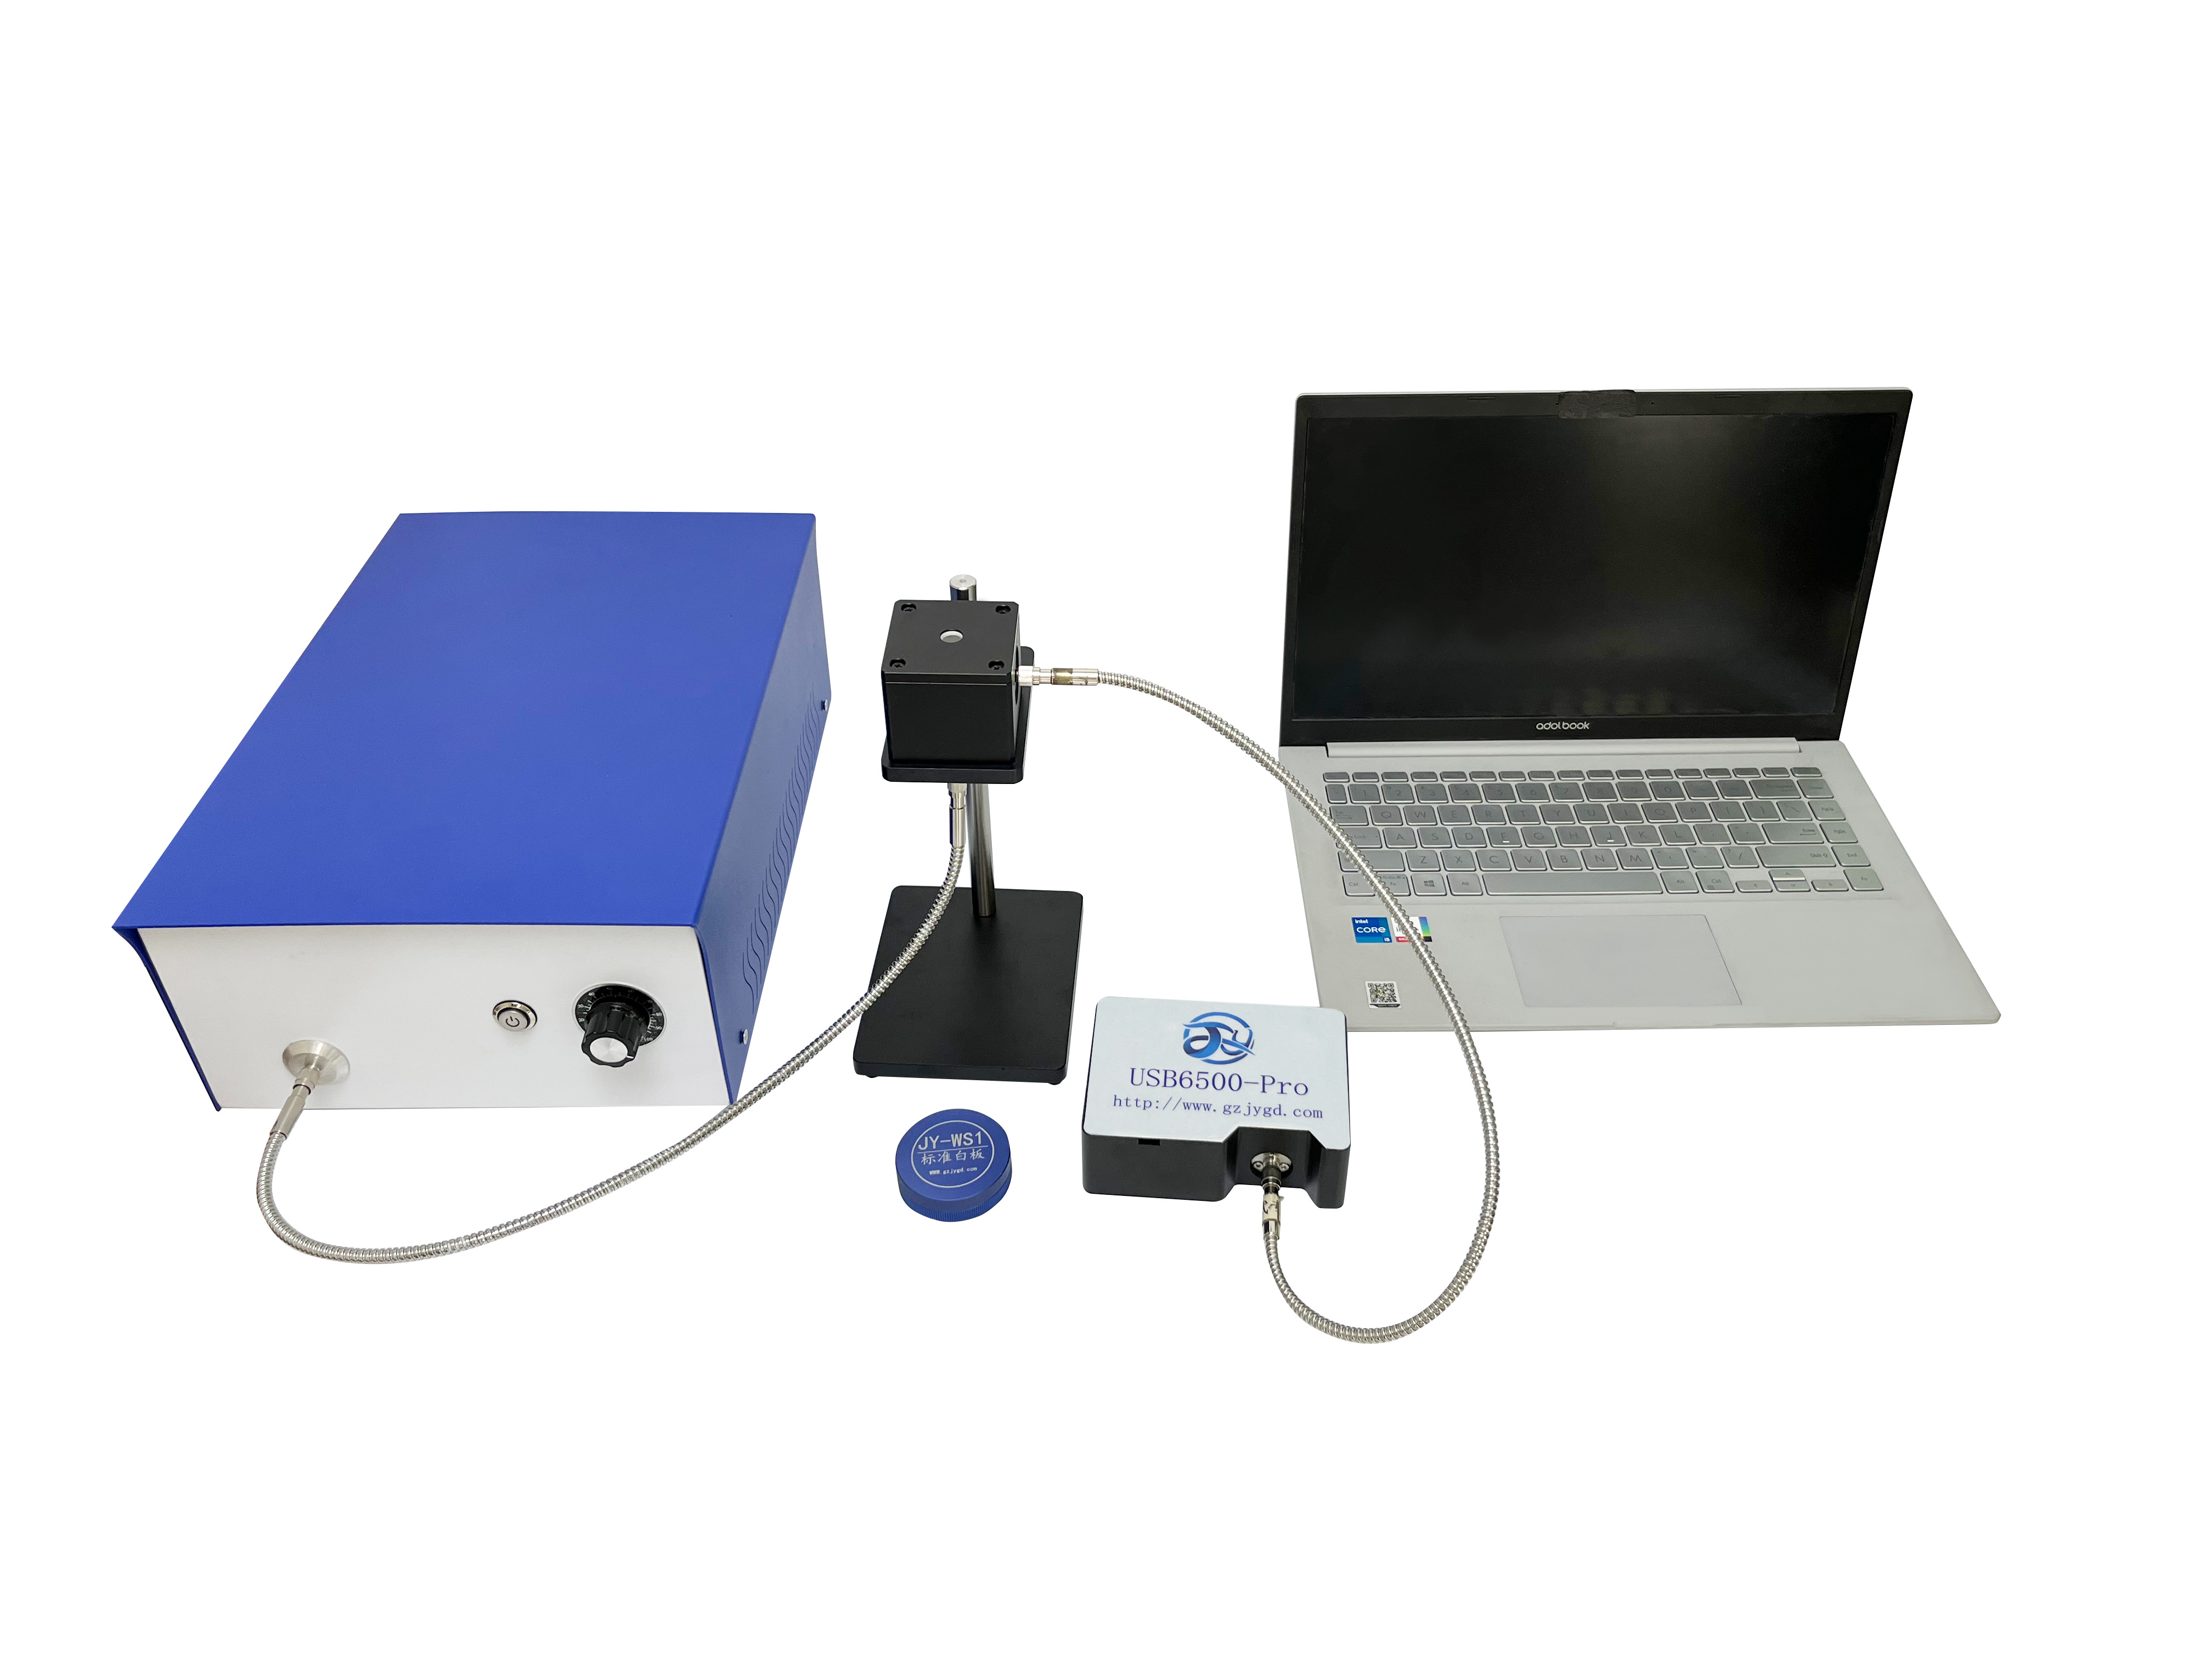
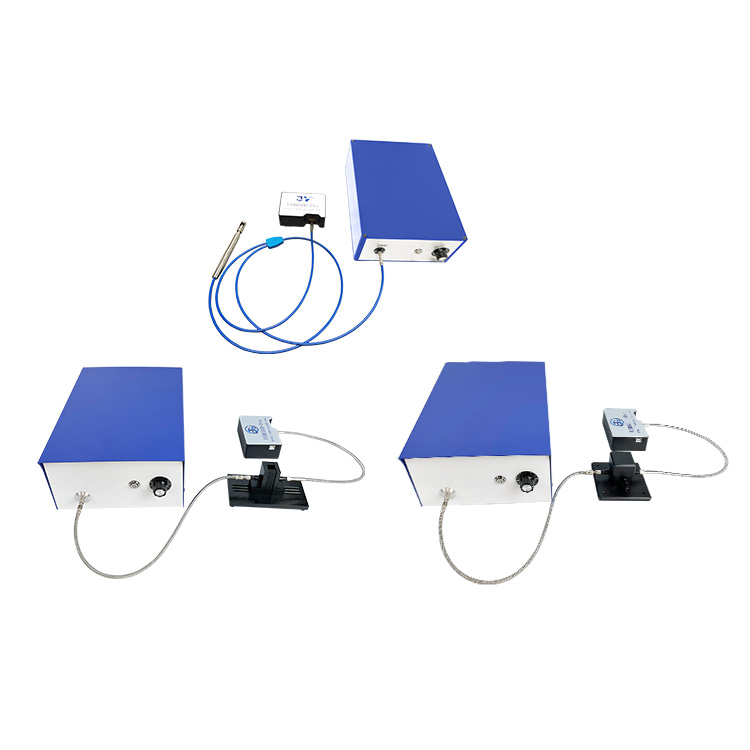
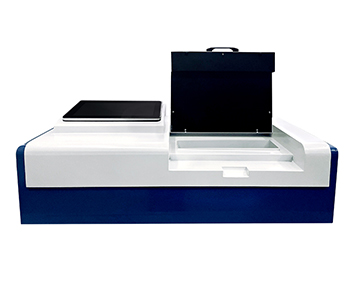
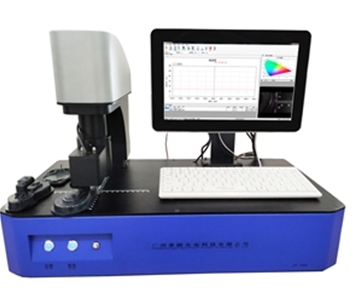
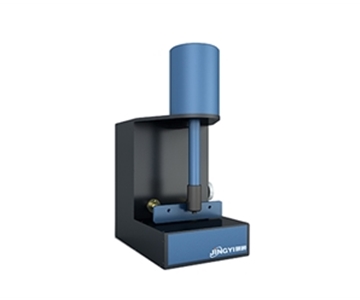
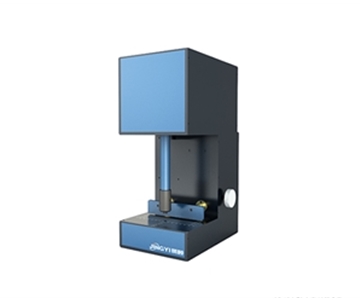
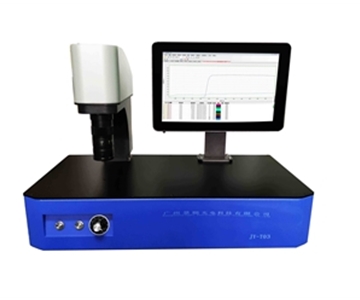
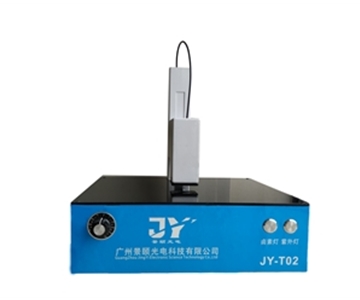
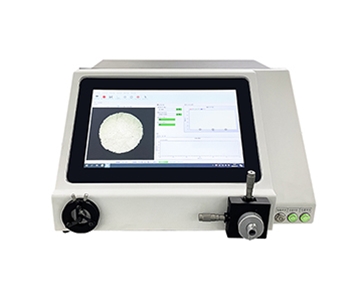
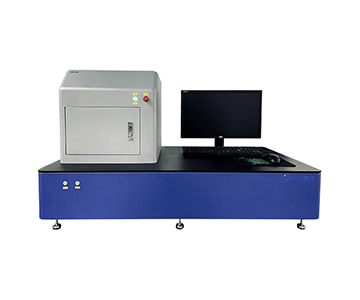
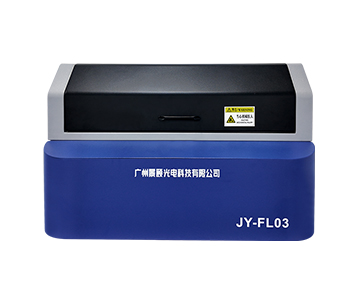
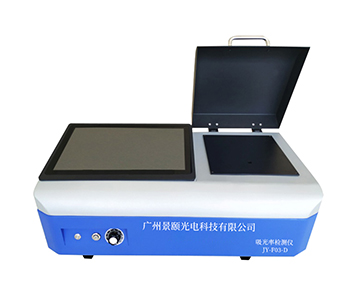
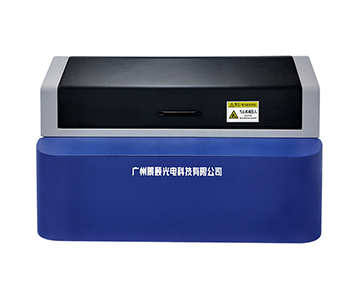
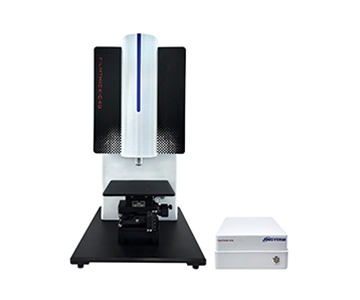
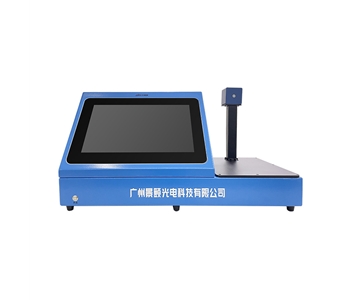
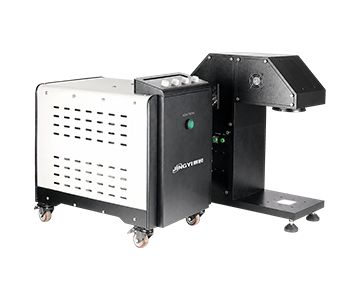
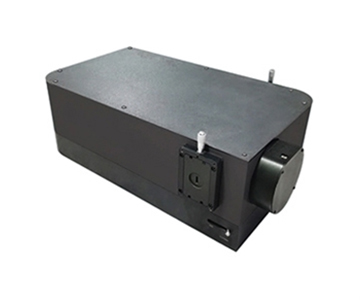
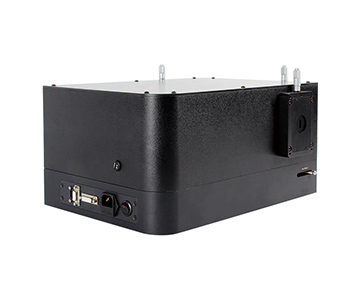
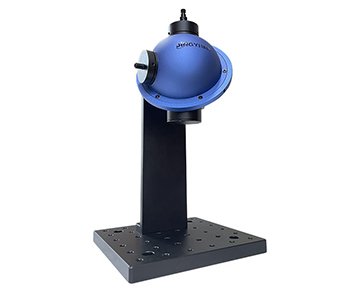
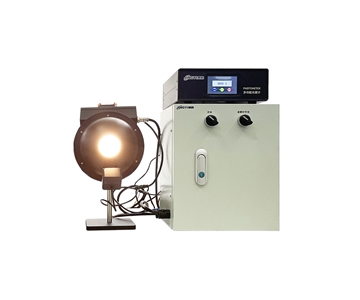
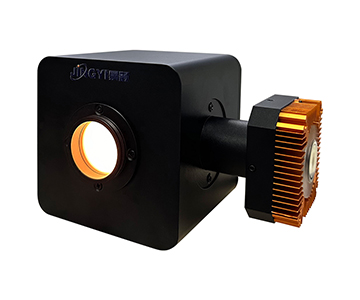
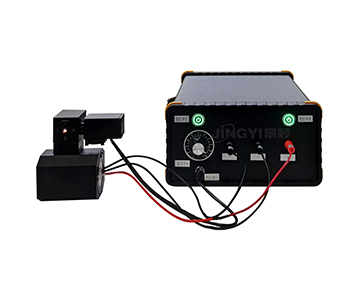
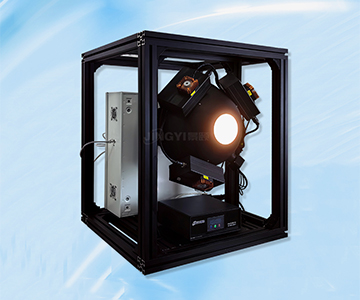
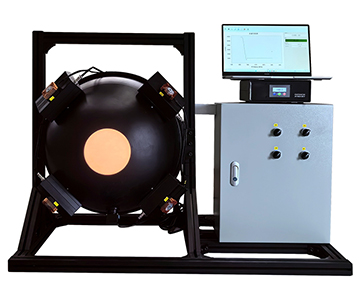
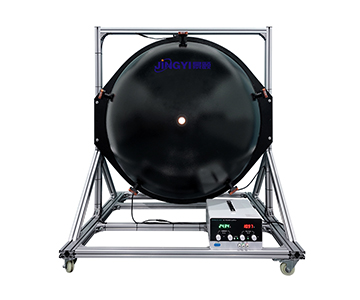
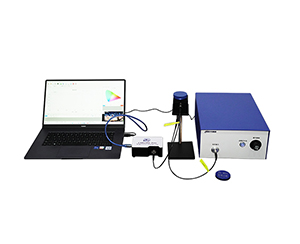
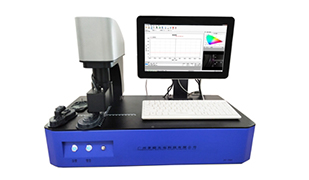
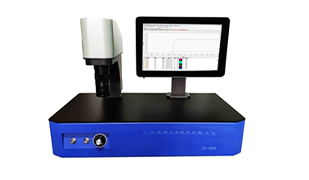
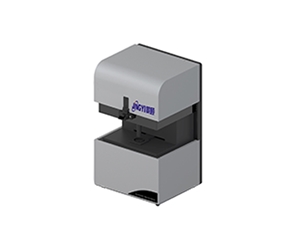
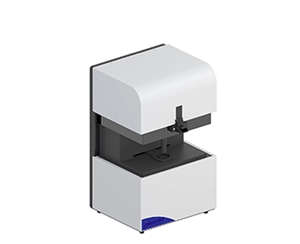
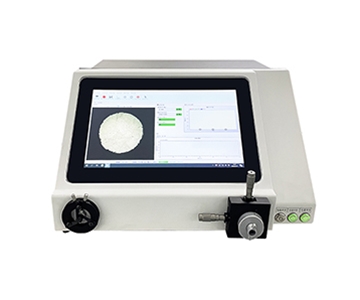
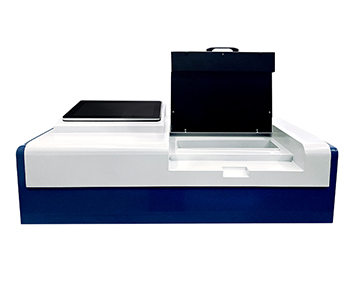
The mainstream domestic bench configuration (380–1000 nm, 9 mm port, <1 s) covers most production needs for phone cover glass reflectance and coating color sorting. The rear‑view mirror model narrows wavelength to 380–780 nm not as a downgrade but to match the visible band required by GB 15084‑2022 (equivalent to ECE R46) and compresses sampling to 1 ms to capture transition time curves.
Import benchmarks offer complete traceability chains and mature report templates; drawbacks include long lead times, thin spare‑parts inventories, and generally lower cost‑effectiveness for industrial lines. Domestic solutions now match performance in conventional reflectance and color sorting; deep UV and sub‑10 µm micro‑area analysis remain outside their primary scope.
POC Validation Methodology
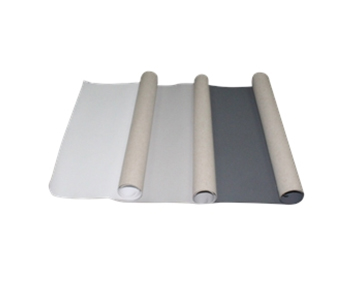
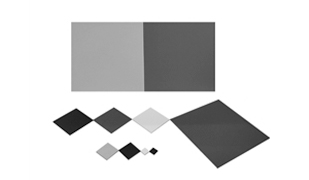
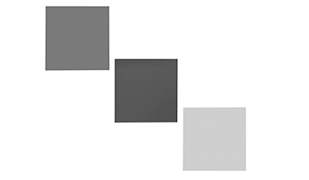
Prepare three samples for retesting: high reflectance (mirror aluminum), medium reflectance (coating panel ~40–60%), low reflectance (matte fabric). Procedure designed per documented capabilities:
1.After power‑on, without manual dark subtraction, measure the low‑reflectance sample 10 times; record max‑min difference.
2.Execute automatic dark background, then measure 10 times; compare dispersion.
3.Continuously measure 50 pieces; record reflectance shift between piece 1 and piece 50.
4.Test in laboratories with inconsistent white‑tile traceability chains; check if reproducibility exceeds 1%.
5.For mirror scenarios, add high‑low temperature: stabilize at –30 °C and 65 °C for 10 minutes each, then measure the same sample.
From a dark‑current perspective, the difference between steps 1 and 2 is direct evidence of whether dark‑frame subtraction is effective. A difference <0.3% indicates stable subtraction; >0.8% suggests algorithmic or optical path obstruction issues.
10‑Question Inspection Checklist
1.Does the wavelength range cover the process starting wavelength?
2.Is a dark frame acquired automatically before every measurement, not just at factory calibration?
3.Is the single‑scan time the first‑shot value or the 50th‑piece continuous value?
4.Is the sample port smaller than the minimum part外形?
5.Is the repeatability claim supported by same‑condition实测 records?
6.Is the integrating sphere coating reflectance >98%?
7.Does the system output Lab/XYZ for color sorting?
8.For plastic reflectance, does it align with GB/T 47066‑2026 (or ISO 13468)?
9.For rear‑view mirror testing, does it include 380–780 nm and high‑low temperature cycling?
10.Does the reference white tile carry a third‑party calibration certificate?
Common Pitfalls Engineers Make
•Focusing on “broad spectrum” while ignoring the starting wavelength. Buying a 400 nm device for aluminum film misses the 380 nm inflection, producing data ~2% lower than supplier values.
•Treating first‑shot 1 ms as production‑line steady state. Cache and dark‑current drift during continuous sampling can multiply actual intervals, miscalculating takt.
•Using a 9 mm port for microscopic scenarios. Spot covers entire area, averaging micro‑film thickness variations and causing false accepts.
•Assuming “supports automatic” without probing trigger logic. Some devices subtract dark only at power‑on; after 4 hours of operation, low‑reflectance data drifts.
Solution Boundaries
Domestic bench‑top integrating sphere systems perform stably in coatings, photovoltaics, phone cover glass, and conventional optics. Automatic dark background + 9 mm port + <1 s covers most lines. Boundaries are equally clear: NIR models at ~10 s per scan are unsuitable for high‑speed sorting; microscopic 60 µm spot remains coarse for sub‑10 µm analysis; deep UV below 250 nm requires separate evaluation as current documentation does not provide shorter‑wave data.
Dark current noise is not a simple on/off switch; it ties to light source drift, sphere‑wall coating aging, and detector temperature. Including this item in POC saves more than chasing extra decimal places on paper.
Frequently Asked Questions
Q1: How much does reflectance differ with and without dark background subtraction?
Low‑reflectance samples show larger differences—matte fabrics and powders can reach 0.5–1%; high‑reflectance mirrors usually <0.2%. Use the dispersion of 10 consecutive retests as the criterion.
Q2: How to choose between 380–1000 nm and 400–1000 nm?
Select 380 nm start if UV reflectance characteristics are involved; 400 nm suffices for visible‑light color sorting. Aluminum films and some coatings benefit from 380 nm coverage.
Q3: Is 1 ms sampling always better than 1 s?
No. 1 ms is for mirror response curves; coating sorting is stable at 1 s. Forcing NIR wide‑band scans to 1 s sacrifices signal‑to‑noise ratio.
Q4: Where does the price gap between domestic and import tiers lie?
Imports charge for traceability chains, software reports, and spare‑parts systems; domestic systems invest in service response and customization. For conventional reflectance, domestic solutions offer better cost‑effectiveness.
Q5: How can I independently verify equipment dark‑current stability?
Measure the same sample 50 times, comparing max‑min difference before and after automatic dark subtraction; then retest across laboratories with different traceability white tiles. Deviation exceeding 1% requires factory recalibration.
Conclusion
Selection returns to one line: first define wavelength band and sample size, then verify that dark background subtraction executes before each measurement, and finally run continuous retests with three sample types. Spec sheets are only for initial screening; POC is the real acceptance.
For detailed specifications and application notes on integrating sphere reflectometers, search “Jingyi Optoelectronics integrating sphere reflectometer” or visit our technical library.
Editorial Notes
Research Basis:
In‑house product technical documentation, GB/T 47066‑2026 (aligned with ISO 13468‑1), GB 15084‑2022 (equivalent to ECE R46), and integrating sphere relative measurement principle literature.
Reviewed by:
Cai Xiaodong, Senior Application Engineer at Jingyi Optoelectronics, with 12 years of experience in industrial precision measurement equipment.
Sponsorship Disclosure:
Jingyi Optoelectronics manufactures optical measurement systems. Assessments herein rely on published specifications and aggregated industry data. No third‑party compensation was involved.
Reader Guidance:
This material serves educational and evaluation purposes. Always conduct independent proof‑of‑concept testing under your own process conditions before making equipment decisions.
Publication Date:
October 2026