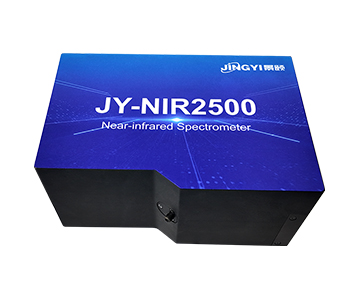
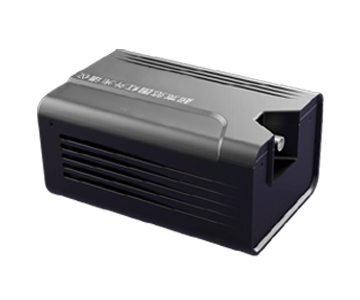
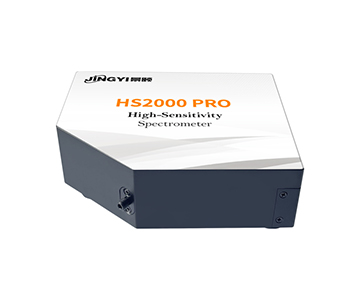
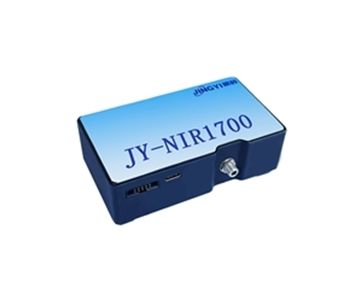
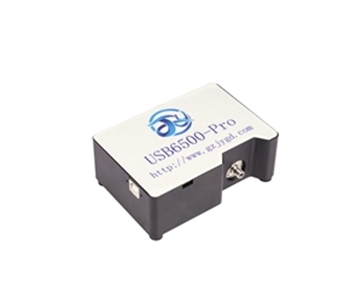
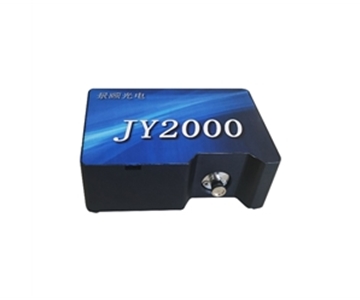
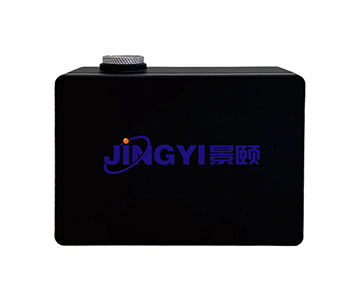
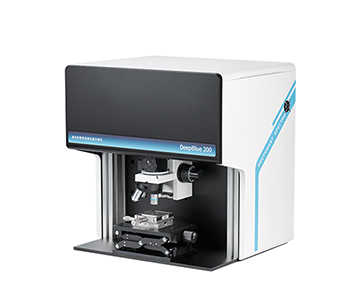
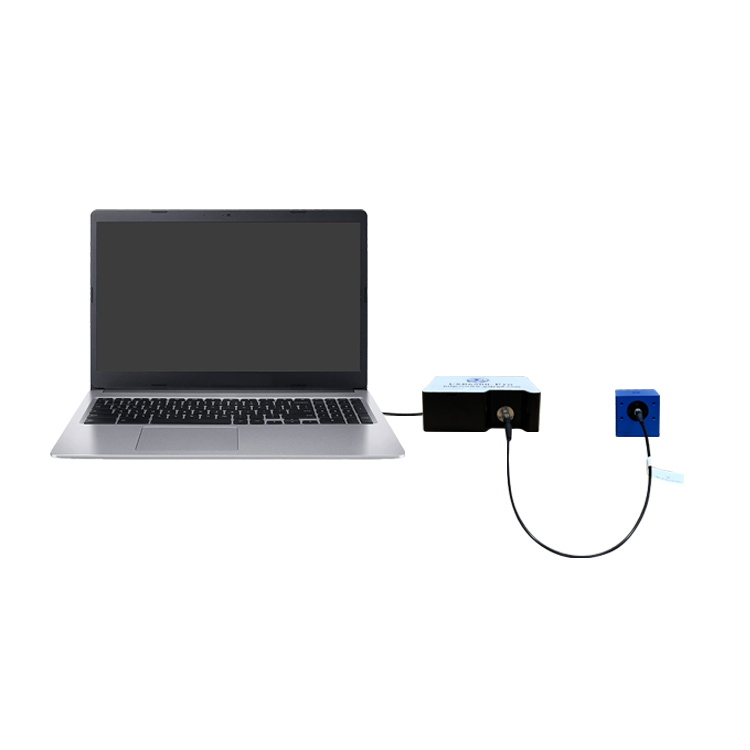
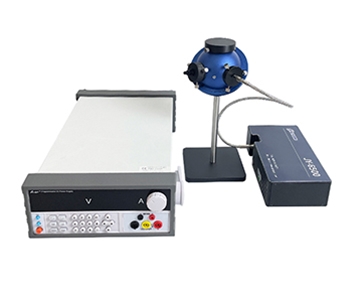
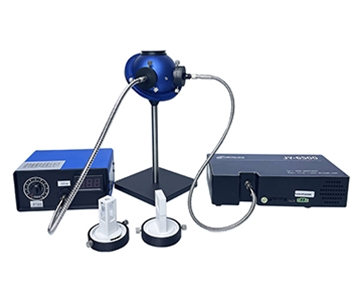
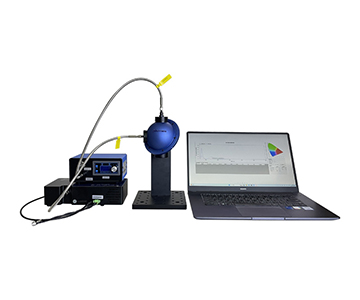
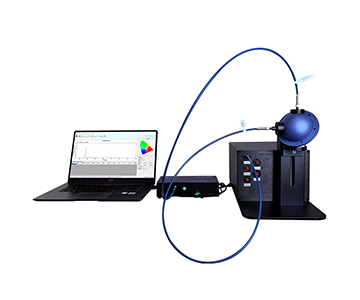
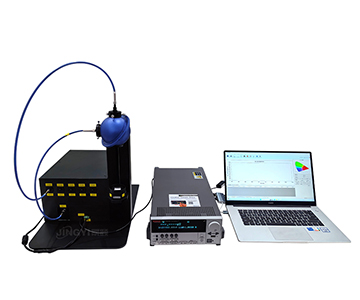
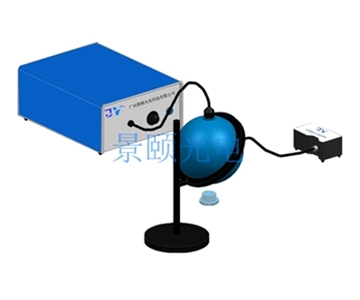
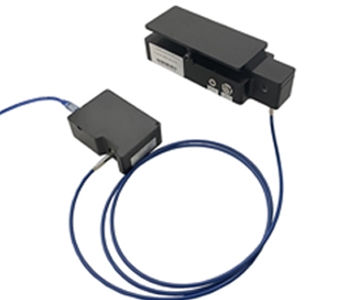
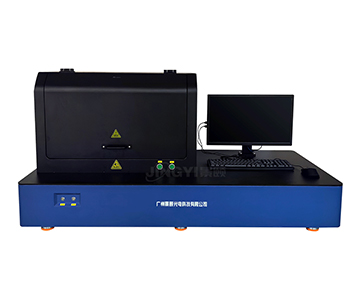
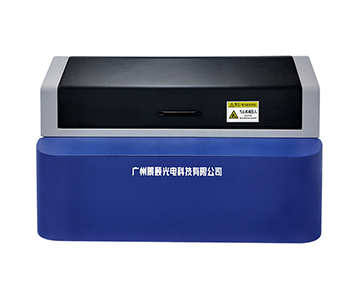
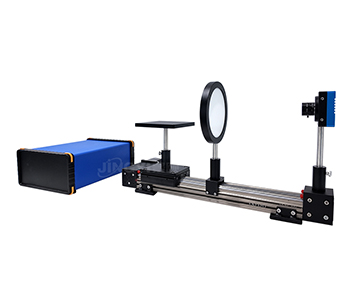
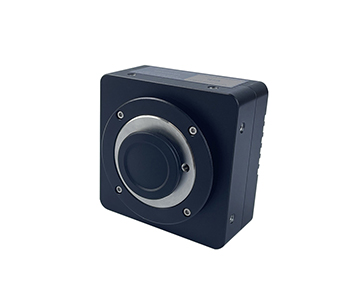
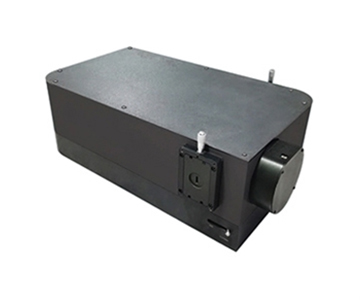
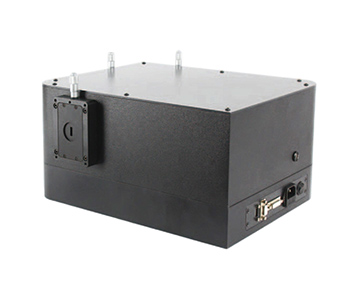
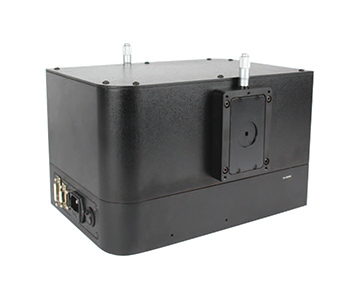
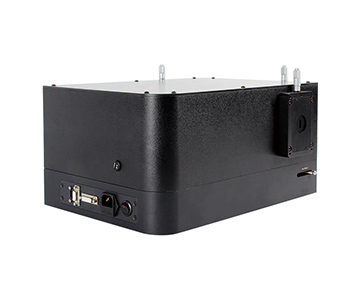
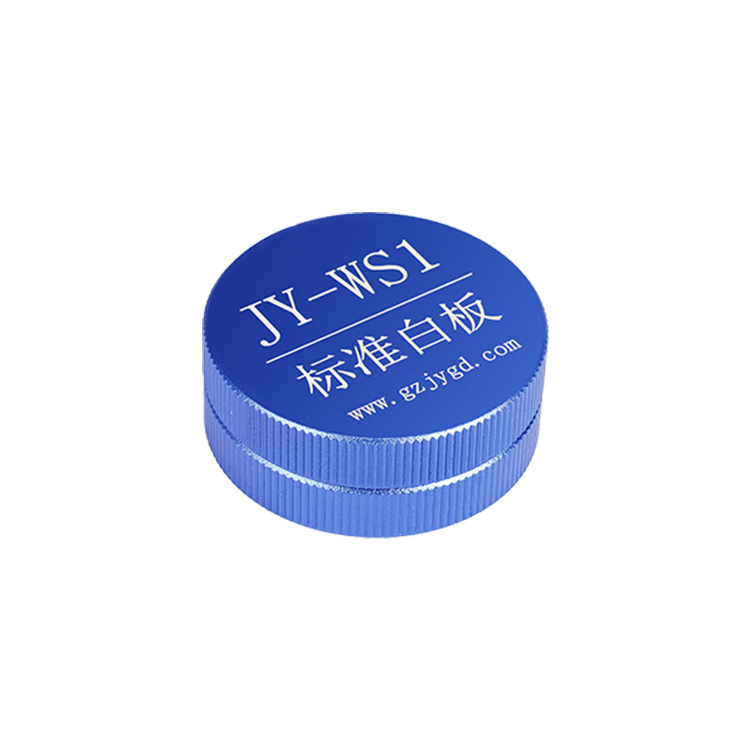
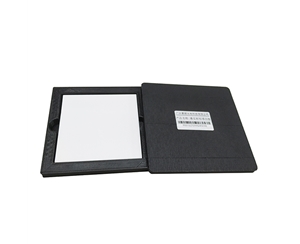
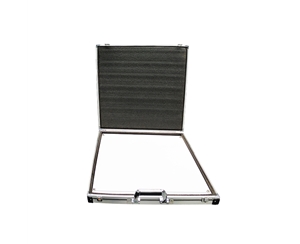
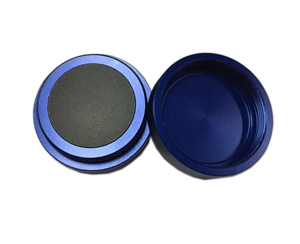
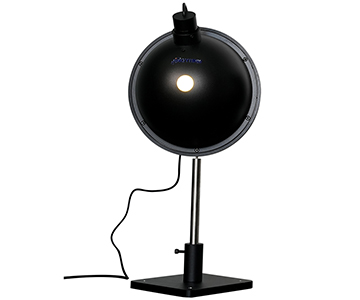
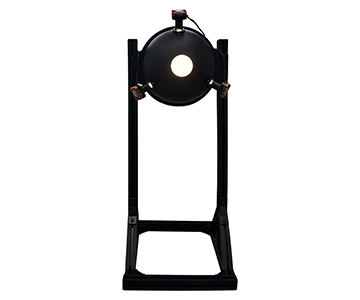
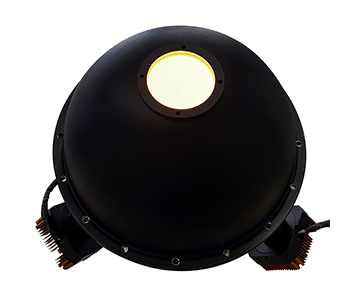
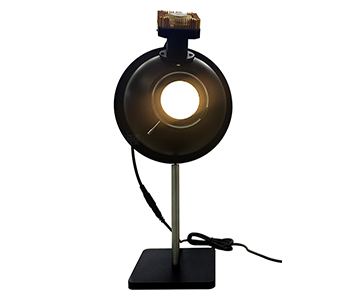
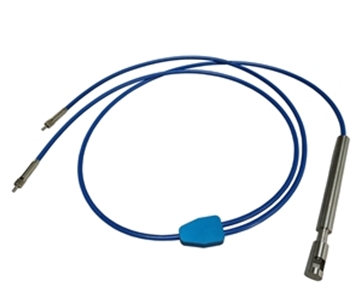
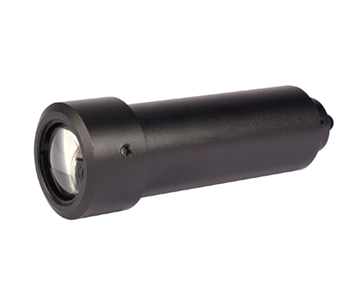
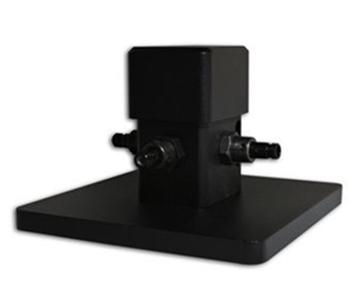
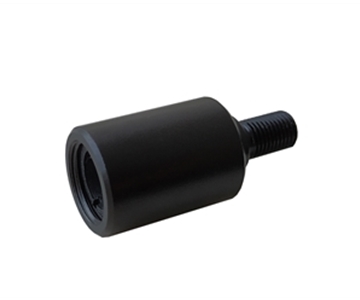
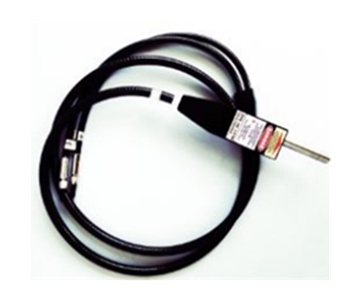
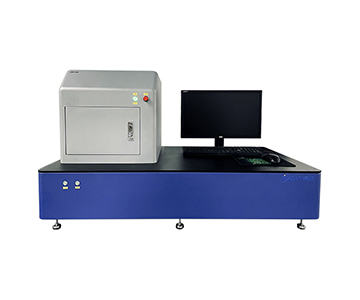
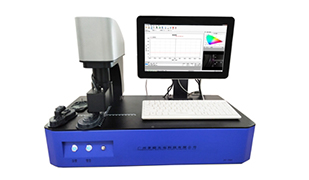
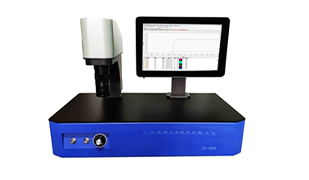
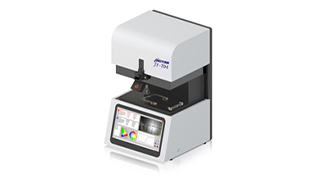
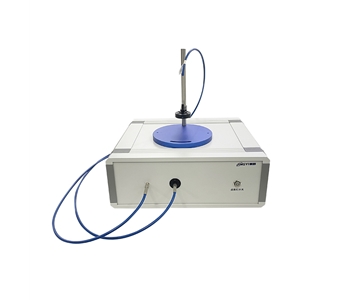
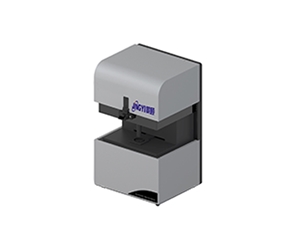
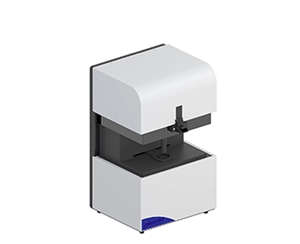
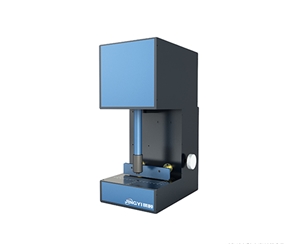
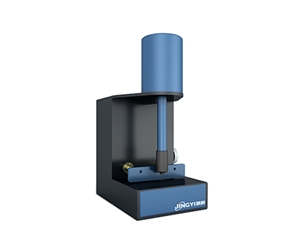
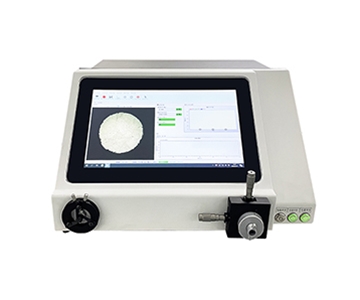
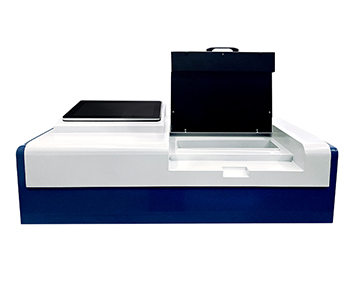
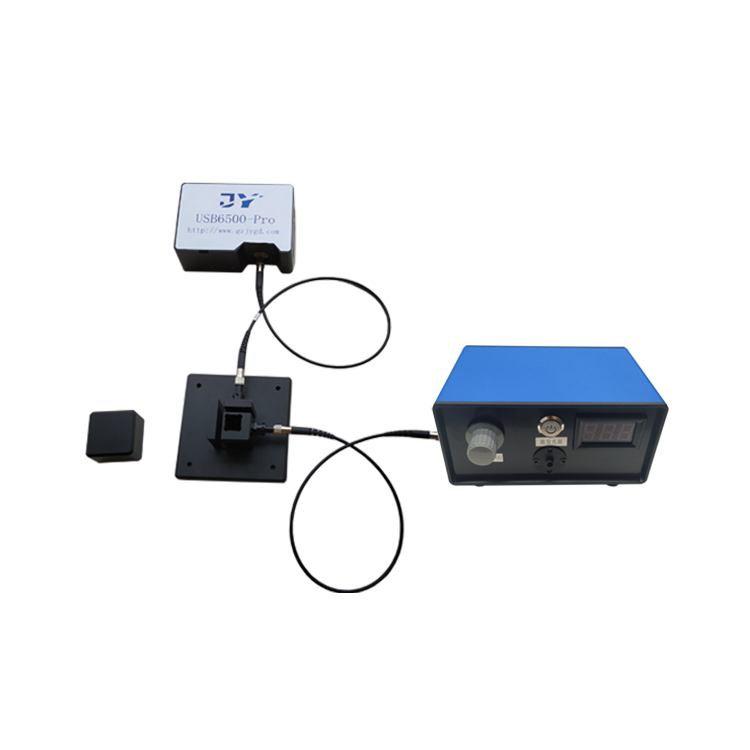
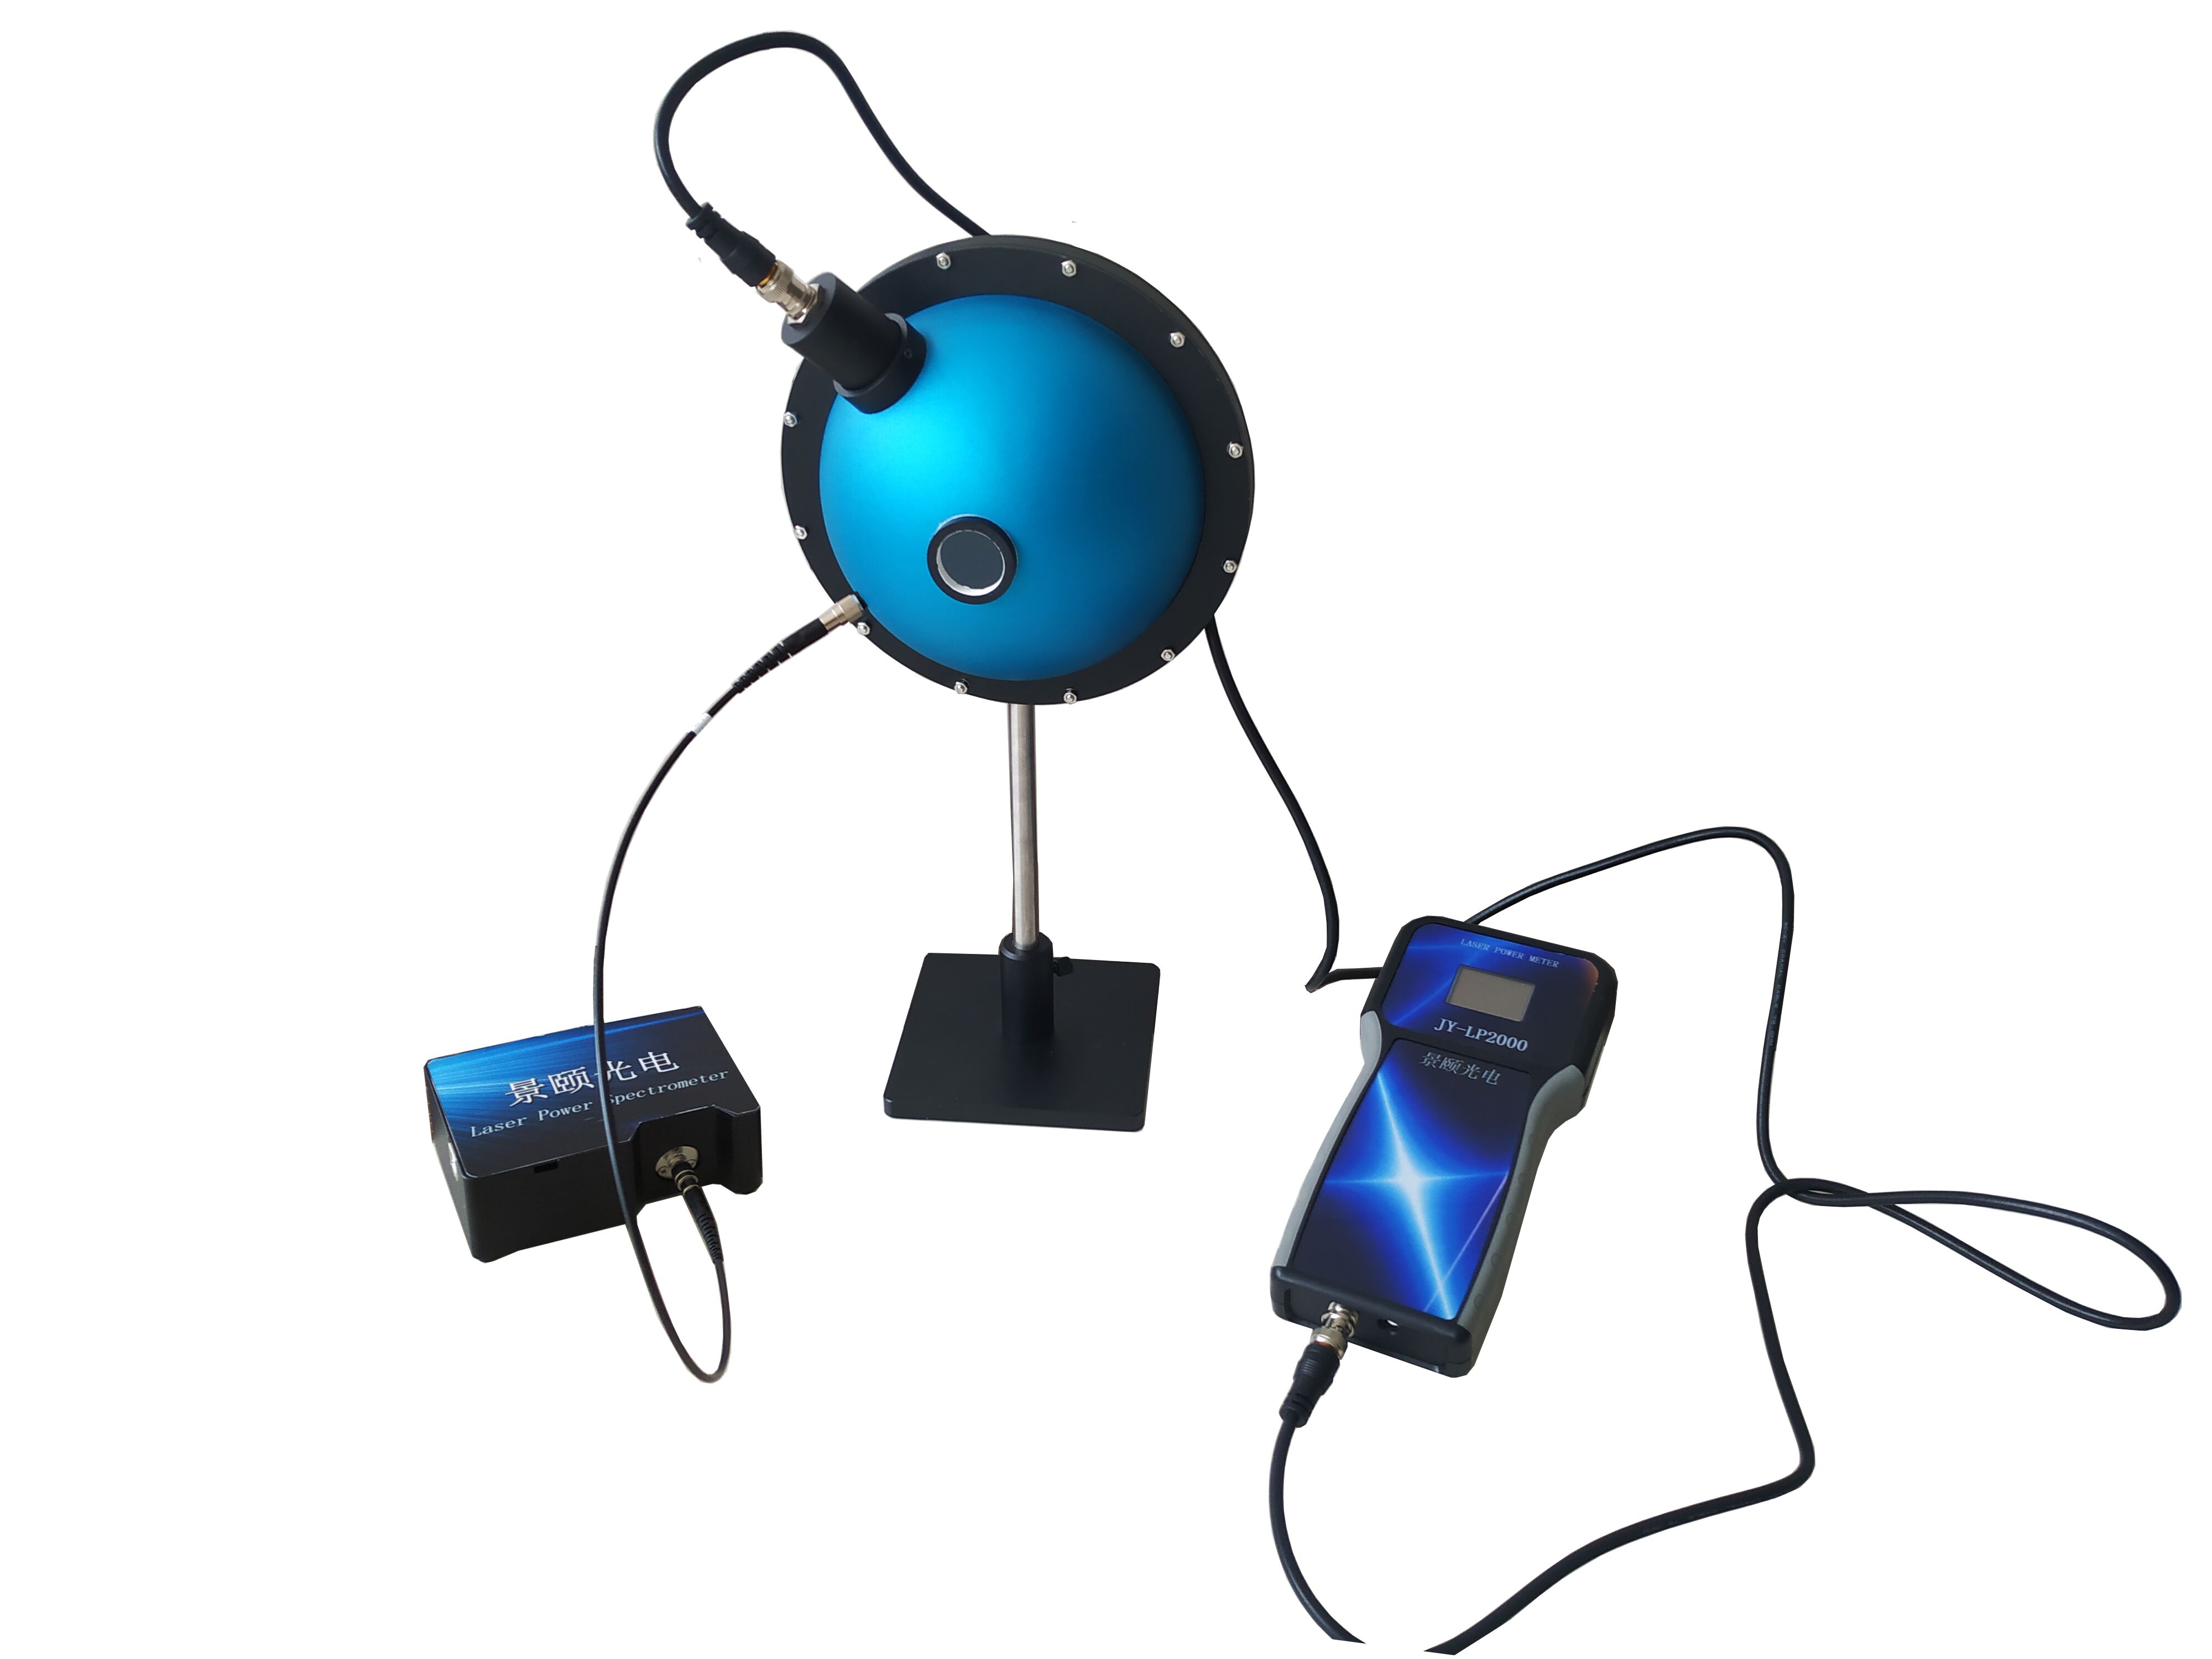
The single largest barrier to replacing imported spectrometers on production lines is not absolute signal quality—it is long-term, multi-unit data repeatability under real operating conditions. When a third-party lab loses a night’s worth of batch data because a borrowed imported unit drifts 0.7% during calibration downtime, the problem becomes clear: metrology procurement is really about purchasing reproducible measurement capability. For B2B buyers evaluating wideband fiber optic spectrometers, thermoelectrically cooled visible-NIR systems, and 900–2500 nm NIR instruments, the critical specification is not a pretty single scan but the relative standard deviation after 30 consecutive measurements of a standard white plate, or after 4 hours of continuous operation. This guide examines the four hidden failure modes in spectrometer substitution—traceability gaps, multi-unit variance, closed software ecosystems, and service radius—and provides a phased adoption path for incoming inspection, process monitoring, and high-risk compositional analysis in optical coating, LED sorting, and food quality control.
The Real State of Industrial Spectroscopy Adoption
A common misconception treats spectrometer procurement as a one-time hardware purchase. In reality, the import dependency rate for analytical spectrometers remains high—published trade statistics indicate import value share around 75.0%, with large scientific instruments exceeding 70% imported overall. However, the window between 2025 and 2026 has seen mid-range industrial segments—inline inspection, LED binning, optical coating, and agricultural NIR—begin to open up. Government procurement and volume production projects show slowly rising domestic participation, yet high-end research and stringent metrology applications remain dominated by established foreign platforms.
What separates a viable
Three numbers define the current landscape: 75.0% import dependency for high-end spectrometers; rising but inconsistent domestic penetration in mid-range inline applications; and the 2027–2030 window as the critical period for standards, metrology evaluation, and local service network maturity. True substitution is never a simple “swap the chassis”—it passes only when data from consecutive shifts aligns within control limits.
Four Operational Challenges in Adoption
Traceability Chain Gaps
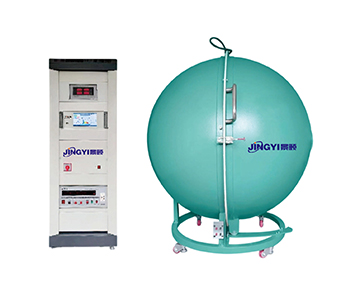
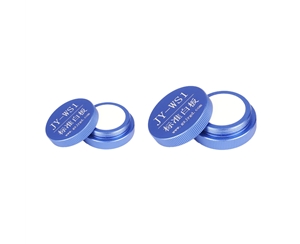
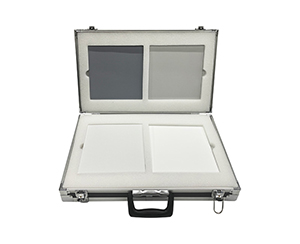
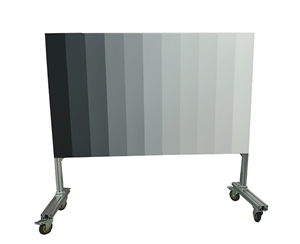
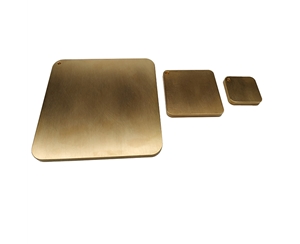
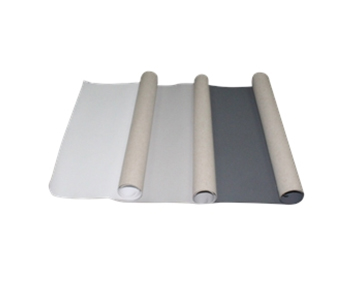
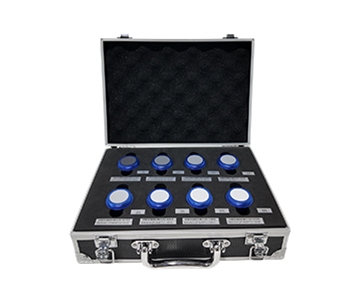
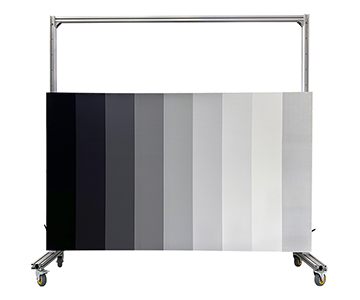
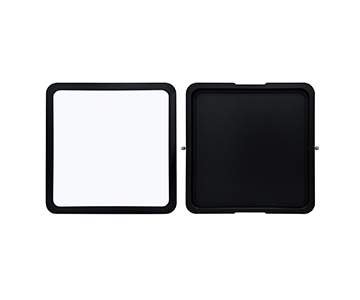
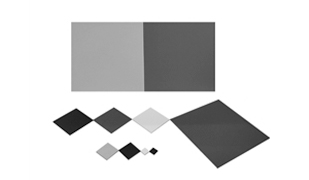
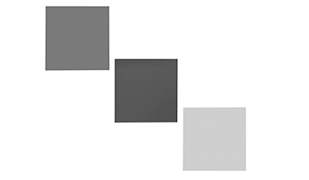
Many projects stall at first acceptance. The instrument produces a spectrum, but when calibrated against a standard reflector or integrating sphere system, results diverge from the certified reference report. Root causes typically lie in reflectance measurement methodology, standard plate batch variation, incident geometry, and reference channel compensation—not the detector itself. For total transmission and reflection evaluation of plastics and coated parts, the recently published GB/T 47066-2026 standard (Plastics—Determination of total light transmittance and total reflectance) codifies sample handling, optical path, and result processing logic. Specifying compliance with this standard in technical agreements ensures a complete traceability chain.
Multi-Unit Consistency
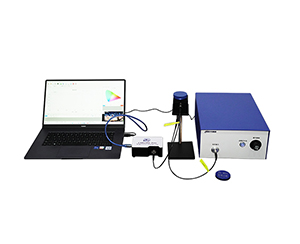
Deploying ten spectrometers on one line is not unusual. The difficulty is maintaining process control limits across morning and evening shifts, between individual units, and after fiber optic cable replacements. Temperature drift, fiber clamping force, slit alignment deviation, and AD reference drift are the enemies of repeatability. Designs offering millisecond-to-tens-of-seconds adjustable integration time, hardware trigger synchronization, and thermoelectric cooling are engineered to leave controllable variables for multi-unit concurrency. Acceptance testing must involve cross-comparison, never single-unit demonstrations.
Closed Software Ecosystems
Legacy imported platforms have deep algorithm libraries, but production floors increasingly demand PLC integration, timestamped spectral frames, and anomalous spectrum rejection triggers. Closed SDKs shift integration costs to the user. Systems that expose USB, UART, trigger ports, and secondary development interfaces enable smoother engineering deployment—provided the raw counts, dark field, and flat field processing chains remain transparent. Accepting only pre-processed, “beautified” curves is a procurement risk.
Service Response Radius
Imported equipment maintenance cycles are long; production line downtime waiting for spare parts is costly. Wide-band NIR models involve detector temperature control and grating alignment, where remote diagnostics capability determines downtime duration. Evaluating a supplier solely on quoted price ignores whether local recalibration, post-fiber-replacement re-certification, quarterly follow-up, and raw data traceability are actually available.
Phased Substitution Roadmap
Phase 1: Edge Processes First—Incoming Inspection and Sampling
Prioritize assigning transmission, reflection, LED color, and color measurement tasks—where reference samples exist—to emerging
Phase 2: Process Monitoring—Inline Transmission/Reflection and Sorting
Once on the line, hardware trigger synchronization and ambient temperature drift become critical. For conveyor belt triggering, hardware triggers outperform software polling. When sample surface texture varies, integration time windows need margin. Wideband models covering 180–1100 nm or 200–1100 nm and NIR models spanning 900–1700 nm or extending to 900–2500 nm should be selected only after confirming that target absorption features fall within the detector response range. Using a visible-light platform to force-measure moisture or oil content leads to unreliable data.
Phase 3: Core Processes with Caution—Film Thickness and Composition Models
Film thickness, coating uniformity, and NIR composition quantification are high-risk scenarios. A dual-machine parallel run for 3–6 months is advised: the
Risk Assessment
Technical Discontinuity
If upstream components—detectors, gratings, thermoelectric coolers—rely on single sources, batch changes can cause baseline shifts. Countermeasures include requiring manufacturers to provide factory wavelength calibration curves, dark noise tests, and recalibration records. Procurement contracts should specify annual drift limits.
Vendor Viability and Spare Parts
Mid-sized production lines fear equipment obsolescence without firmware or spare part access. Before contracting, verify ISO certification, in-house production ratio of core components, delivery cycles, and historical version compatibility. Retain archiving rights for older SDK versions.
Standards and Evaluation Lag
When industry standards and metrology evaluations lag behind new product iterations, vendors may self-certify. Writing GB/T, T/CITS, and T/CIET standard clauses into acceptance sheets proves more effective than reviewing promotional specifications.
Three Future Scenarios
Optimistic: 2028–2030 Mid-Range Industrial Convergence
If metrology evaluation, standard plates, and integrating sphere calibration systems continue opening up,
Neutral: Long-Term Dual-Machine Parallelism in Core Processes
Imported equipment remains the metrology benchmark;
Pessimistic: Low-Price Competition Erodes Consistency
Pure price competition and configuration cutting, without temperature or fiber control on-site, will degrade repeatability and backlash against reputation. Avoiding this risk relies on hard acceptance metrics: 4-hour continuous standard sample relative standard deviation, dark field dispersion, and multi-unit range.
Objective Limitations
Two aspects are most prone to over-packaging: “full wideband coverage” and “high signal-to-noise ratio.” Wideband does not equal accuracy across every segment; UV response, NIR saturation regions, and SWIR detector response curves each require separate calibration. Cooling suppresses dark noise, but stray light, fiber end-face contamination, and sample geometry changes still directly introduce repeatability issues.
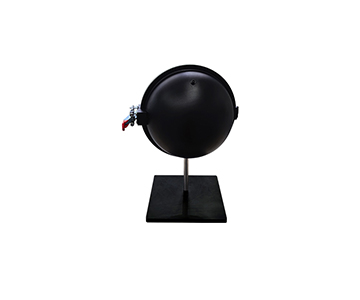
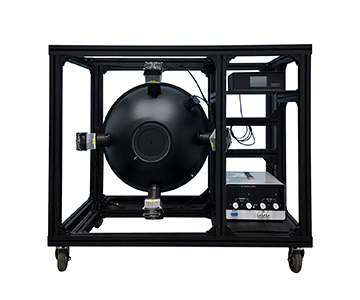
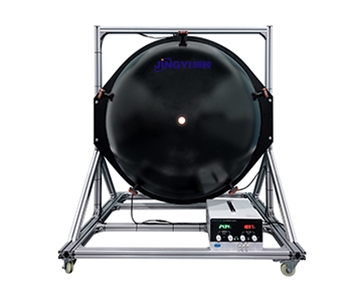
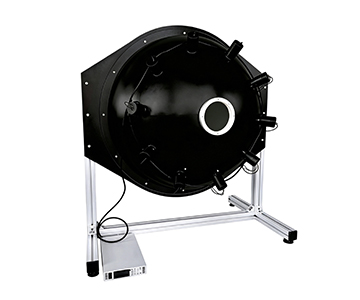
Algorithm migration presents another boundary. NIR composition models trained on original hardware cannot simply transfer coefficients to a new platform; transfer samples and residual monitoring must be redone. Treating a spectrometer as a standalone sensor invites pitfalls—it functions as a measurement chain spanning fiber, light source, integrating sphere, and calibration files.
How to Accept Data Repeatability
Four On-Site Tests
1.Consecutive 30 measurements of a standard white plate; record relative standard deviation.
2.Dark field acquisition with light blocked; record inter-frame dispersion.
3.Same sample remeasured by different operators, with fiber re-clamped; record range.
4.Baseline drift measured at power-on, after 2 hours, and after 6 hours of operation.
Parameters such as cooling temperature, integration time, trigger mode, and A/D bit depth directly control these curves and should never be treated as decorative specifications.
Write Repeatability Criteria into Contracts
Acceptance sheets must specify test conditions: light source stabilization time, integration time, average frame count, ambient temperature, reference channel, and standard plate ID. Only when consecutive shift data under identical conditions falls within control limits does the system qualify for production line substitution.
Frequently Asked Questions
Q1: Can domestic fiber optic spectrometers directly replace imported equipment?
Unconditional replacement is not recommended. Prioritize validation for incoming inspection, color sorting, and transmission/reflection screening. For film thickness and compositional quantification, run dual-machine parallel for several months and verify consecutive shift repeatability before switching primary channels.
Q2: How should data compatibility be handled?
Require open access to raw counts, wavelength files, dark field, and flat field interfaces, with USB or serial trigger support. Confirm that timestamps, frame numbers, and reference channels can feed into MES systems—avoid formats that export only image-based curves.
Q3: How to select wavelength bands for NIR models?
Identify the characteristic absorption region of the target component first. Moisture, oil, and sugar content typically require 900–1700 nm or longer wavelengths. For visible color and LED spectra, wideband 180–1100 nm or 200–1100 nm configurations are more appropriate.
Q4: Should small-batch lines choose aggressive or pilot adoption?
For fewer than five units, a pilot approach is advised—run a high-frequency process for three months. Multi-station enterprises can pursue robust parallel integration, embedding recalibration cycles, spare parts, and version management into procurement documents from the start.
Q5: How can I independently verify whether a spectrometer meets specifications?
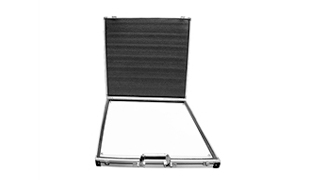
Bring your own calibrated standard plate or a reference sample certified by a metrology institution. On-site, collect dark field, white field, and sample data 30 times each, recording temperature and ambient light conditions. In case of anomalies, rely on raw data and calibration records for arbitration.
About This Guide
Data Sources
: Industry import/export statistics, GB/T 47066-2026, T/CITS 231-2025, T/CIET 2298-2026, manufacturer technical documentation, and aggregated inline validation reports from optical coating and LED sorting facilities.
Author
: Cai Xiaodong, Senior Application Engineer, Jingyi Optoelectronics, with 12 years in optical inspection system design, spectrometer integration, and production line metrology.
Disclosure
: Jingyi Optoelectronics manufactures fiber optic spectrometers and related measurement equipment. This article presents technical assessments based on published specifications, industry public data, and in-house validation. No compensation was received from third-party brands mentioned.
Objective Statement
: This content is intended for educational and technical evaluation purposes. Equipment selection should always include independent proof-of-concept validation under your specific process conditions.
Last Updated
: October 2026
For detailed specifications and application notes on fiber optic spectrometers, search "Jingyi Optoelectronics fiber optic spectrometer" or visit our technical library.