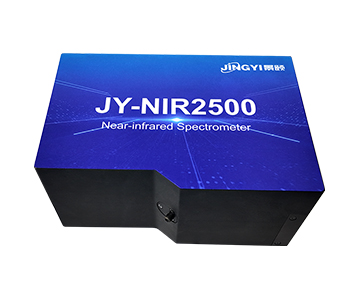
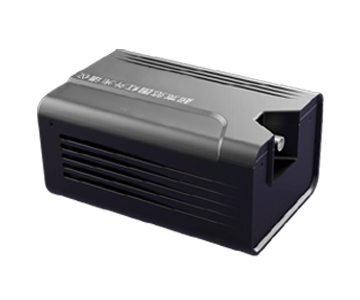
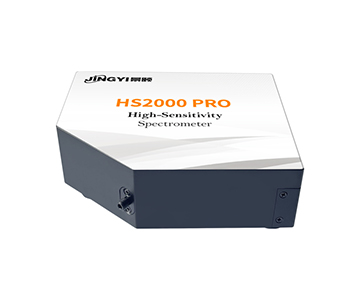
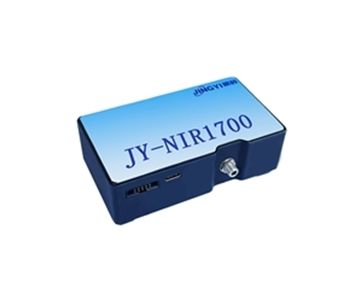
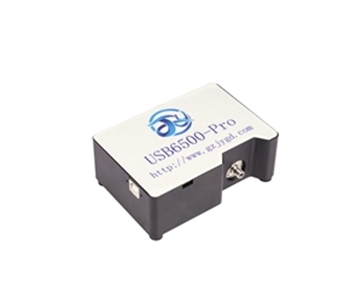
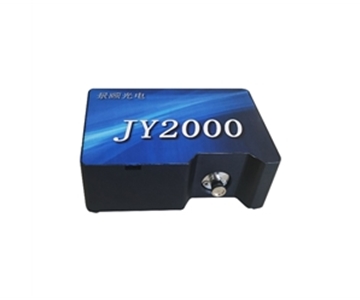
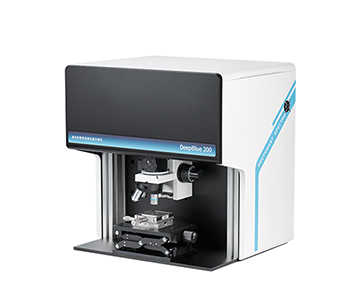
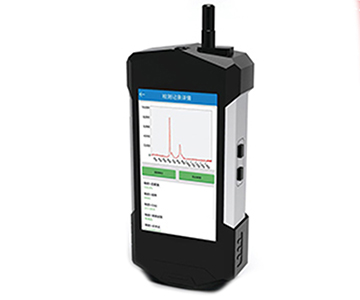
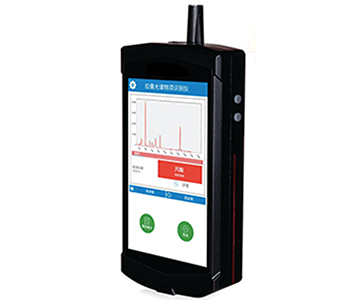
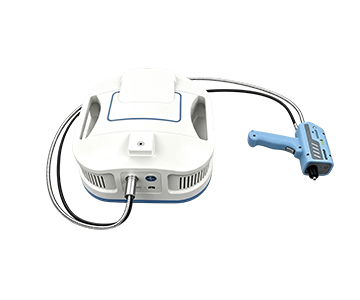
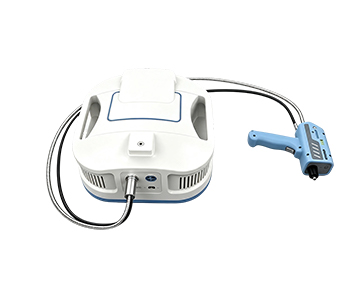
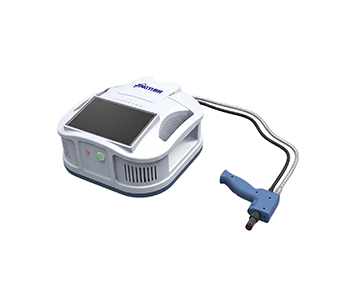
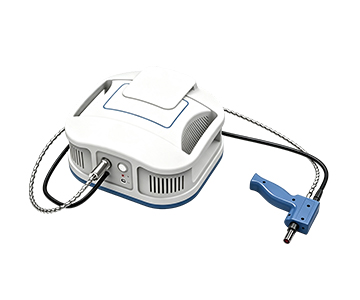
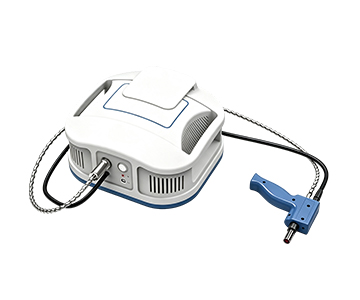
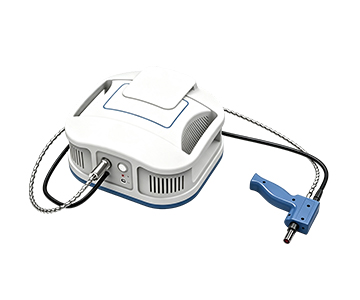
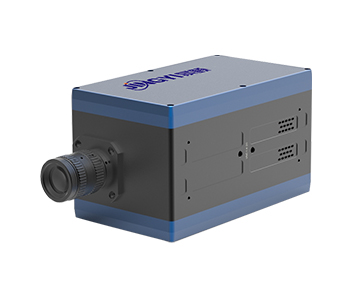
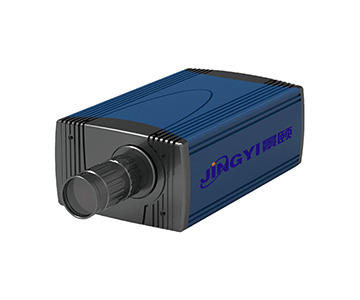
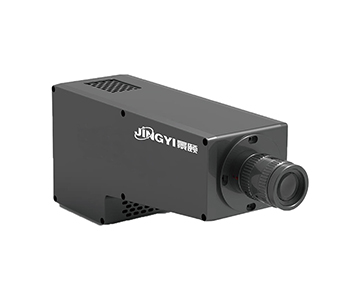
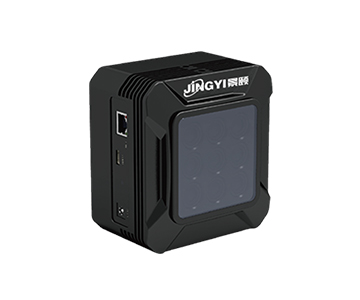
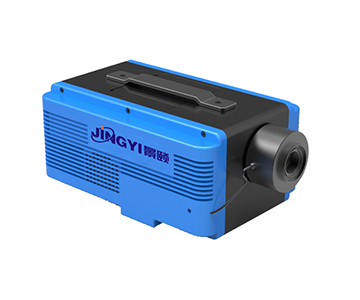
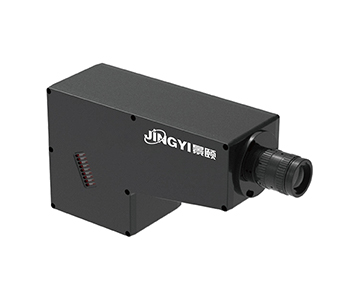
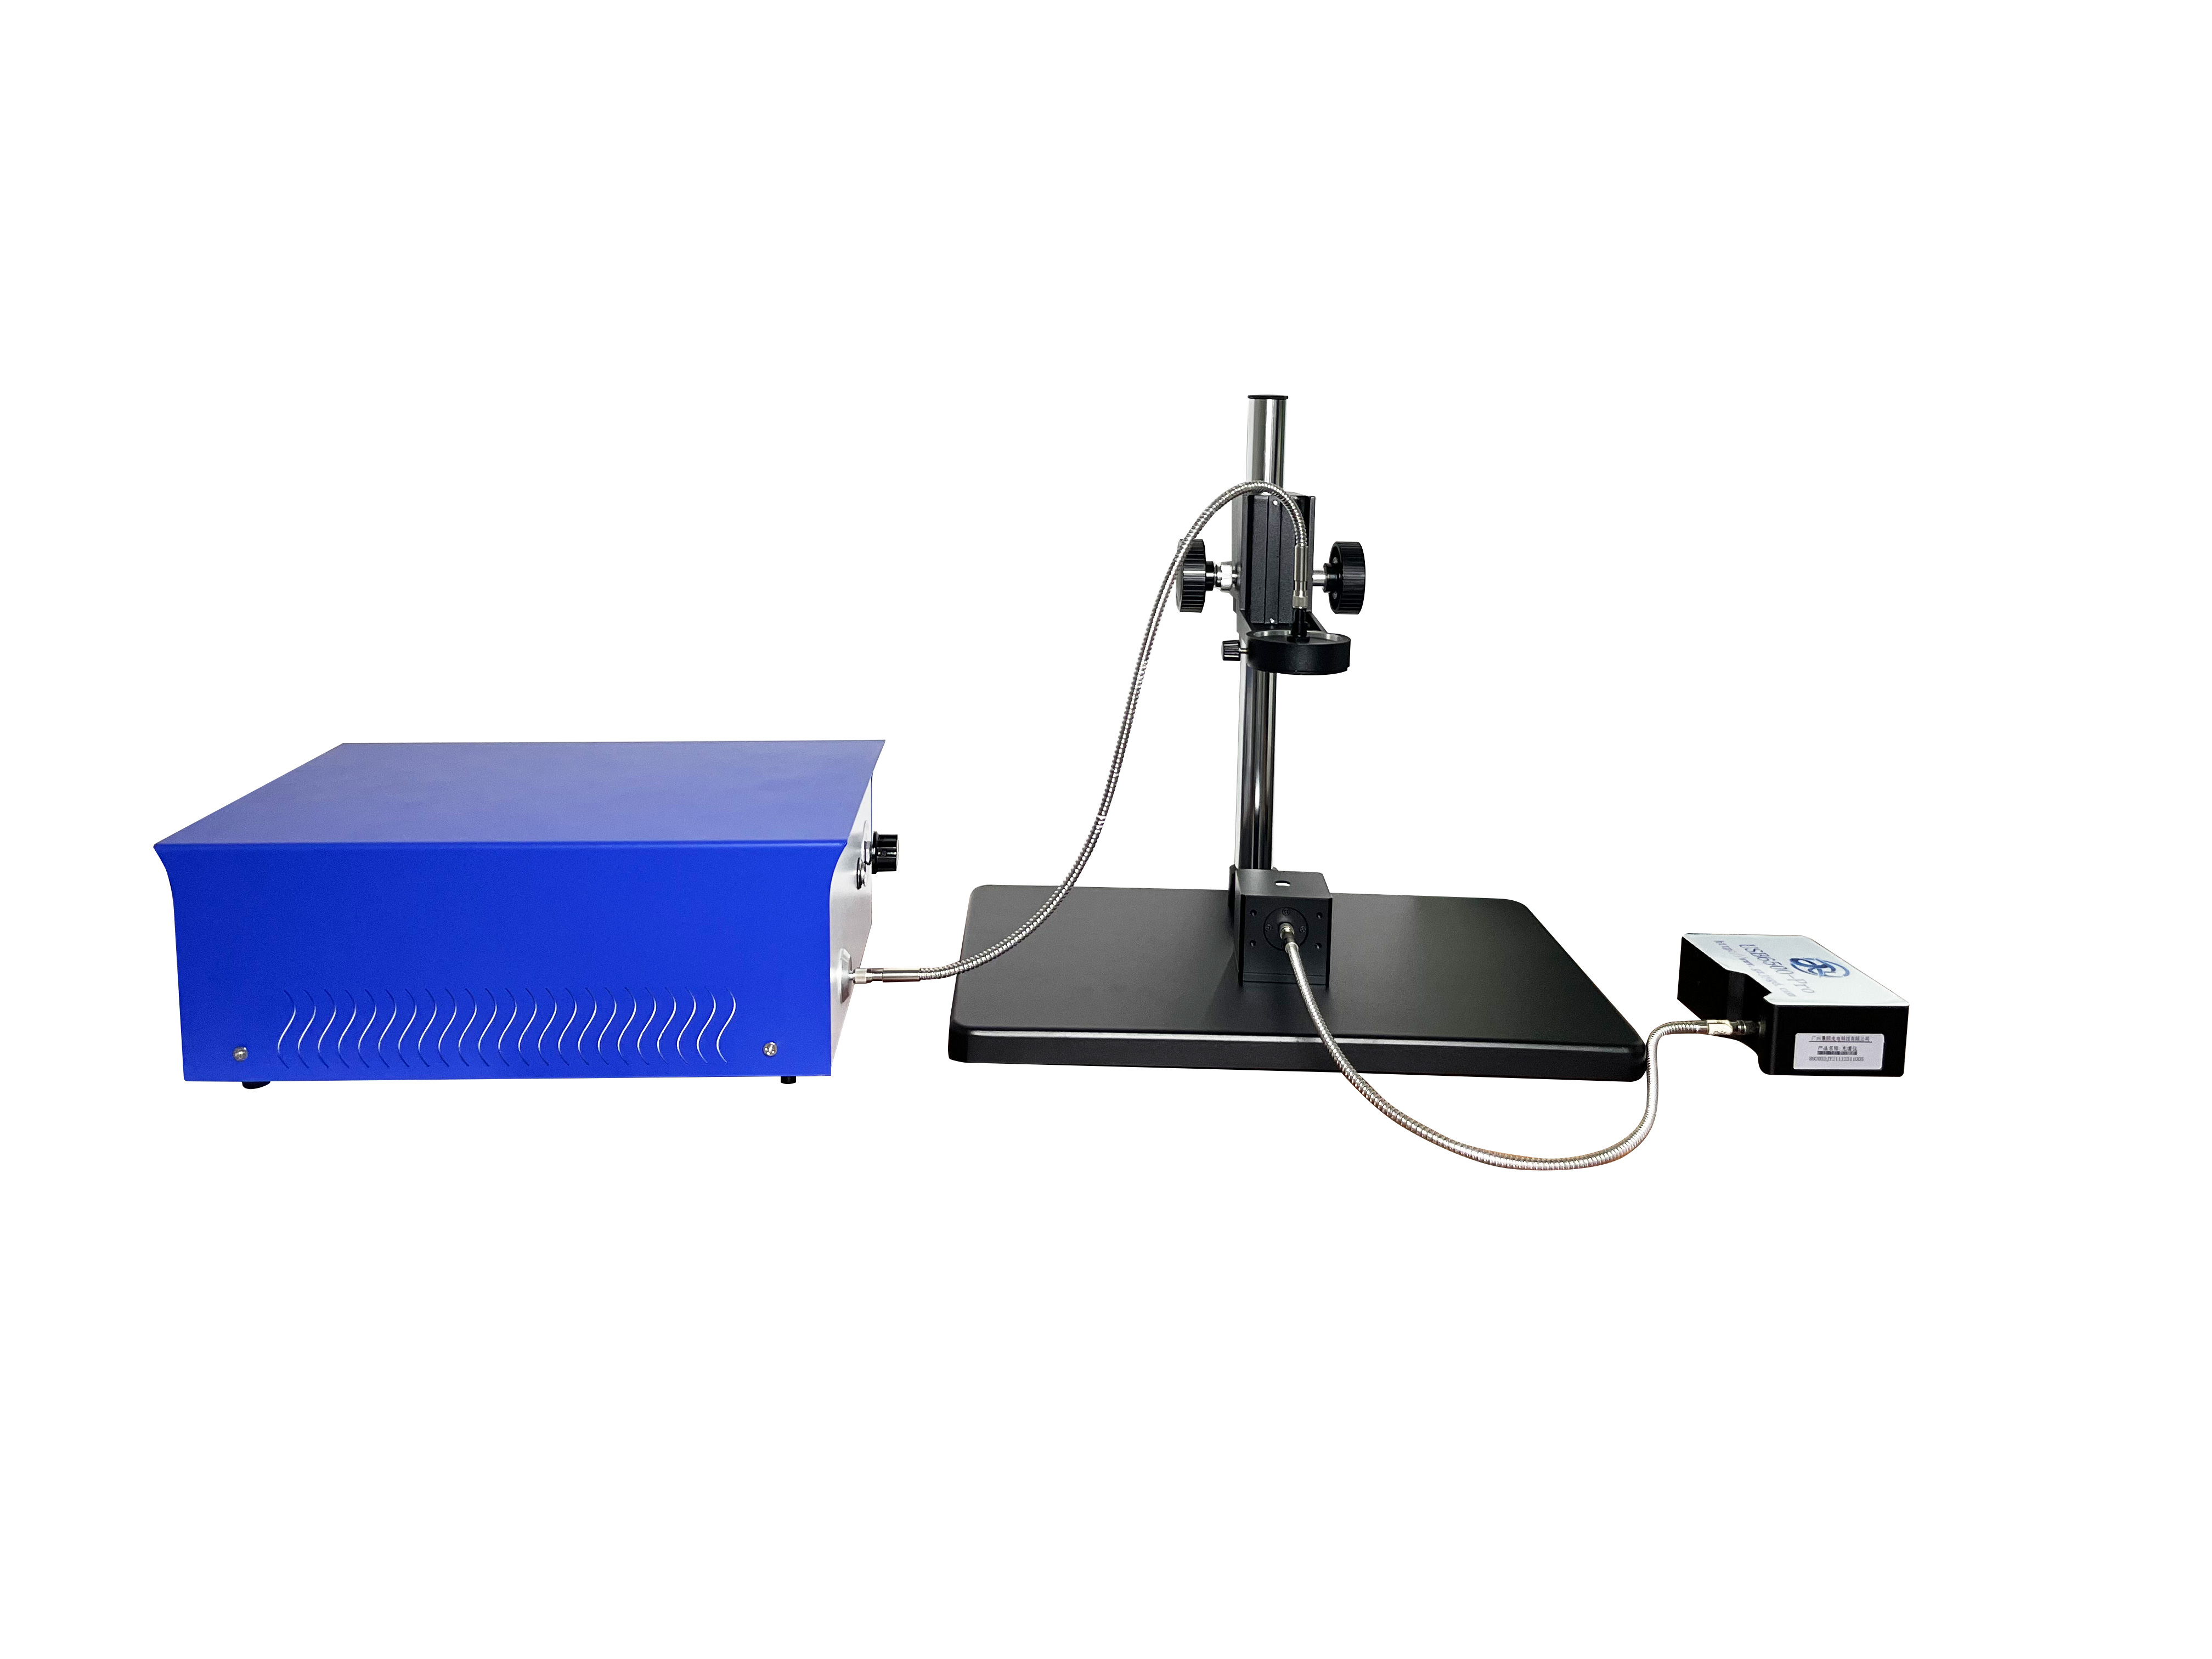
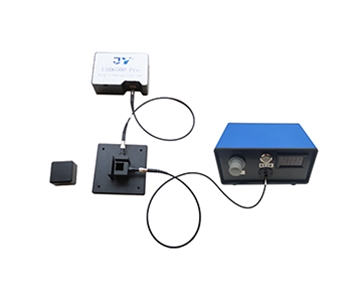
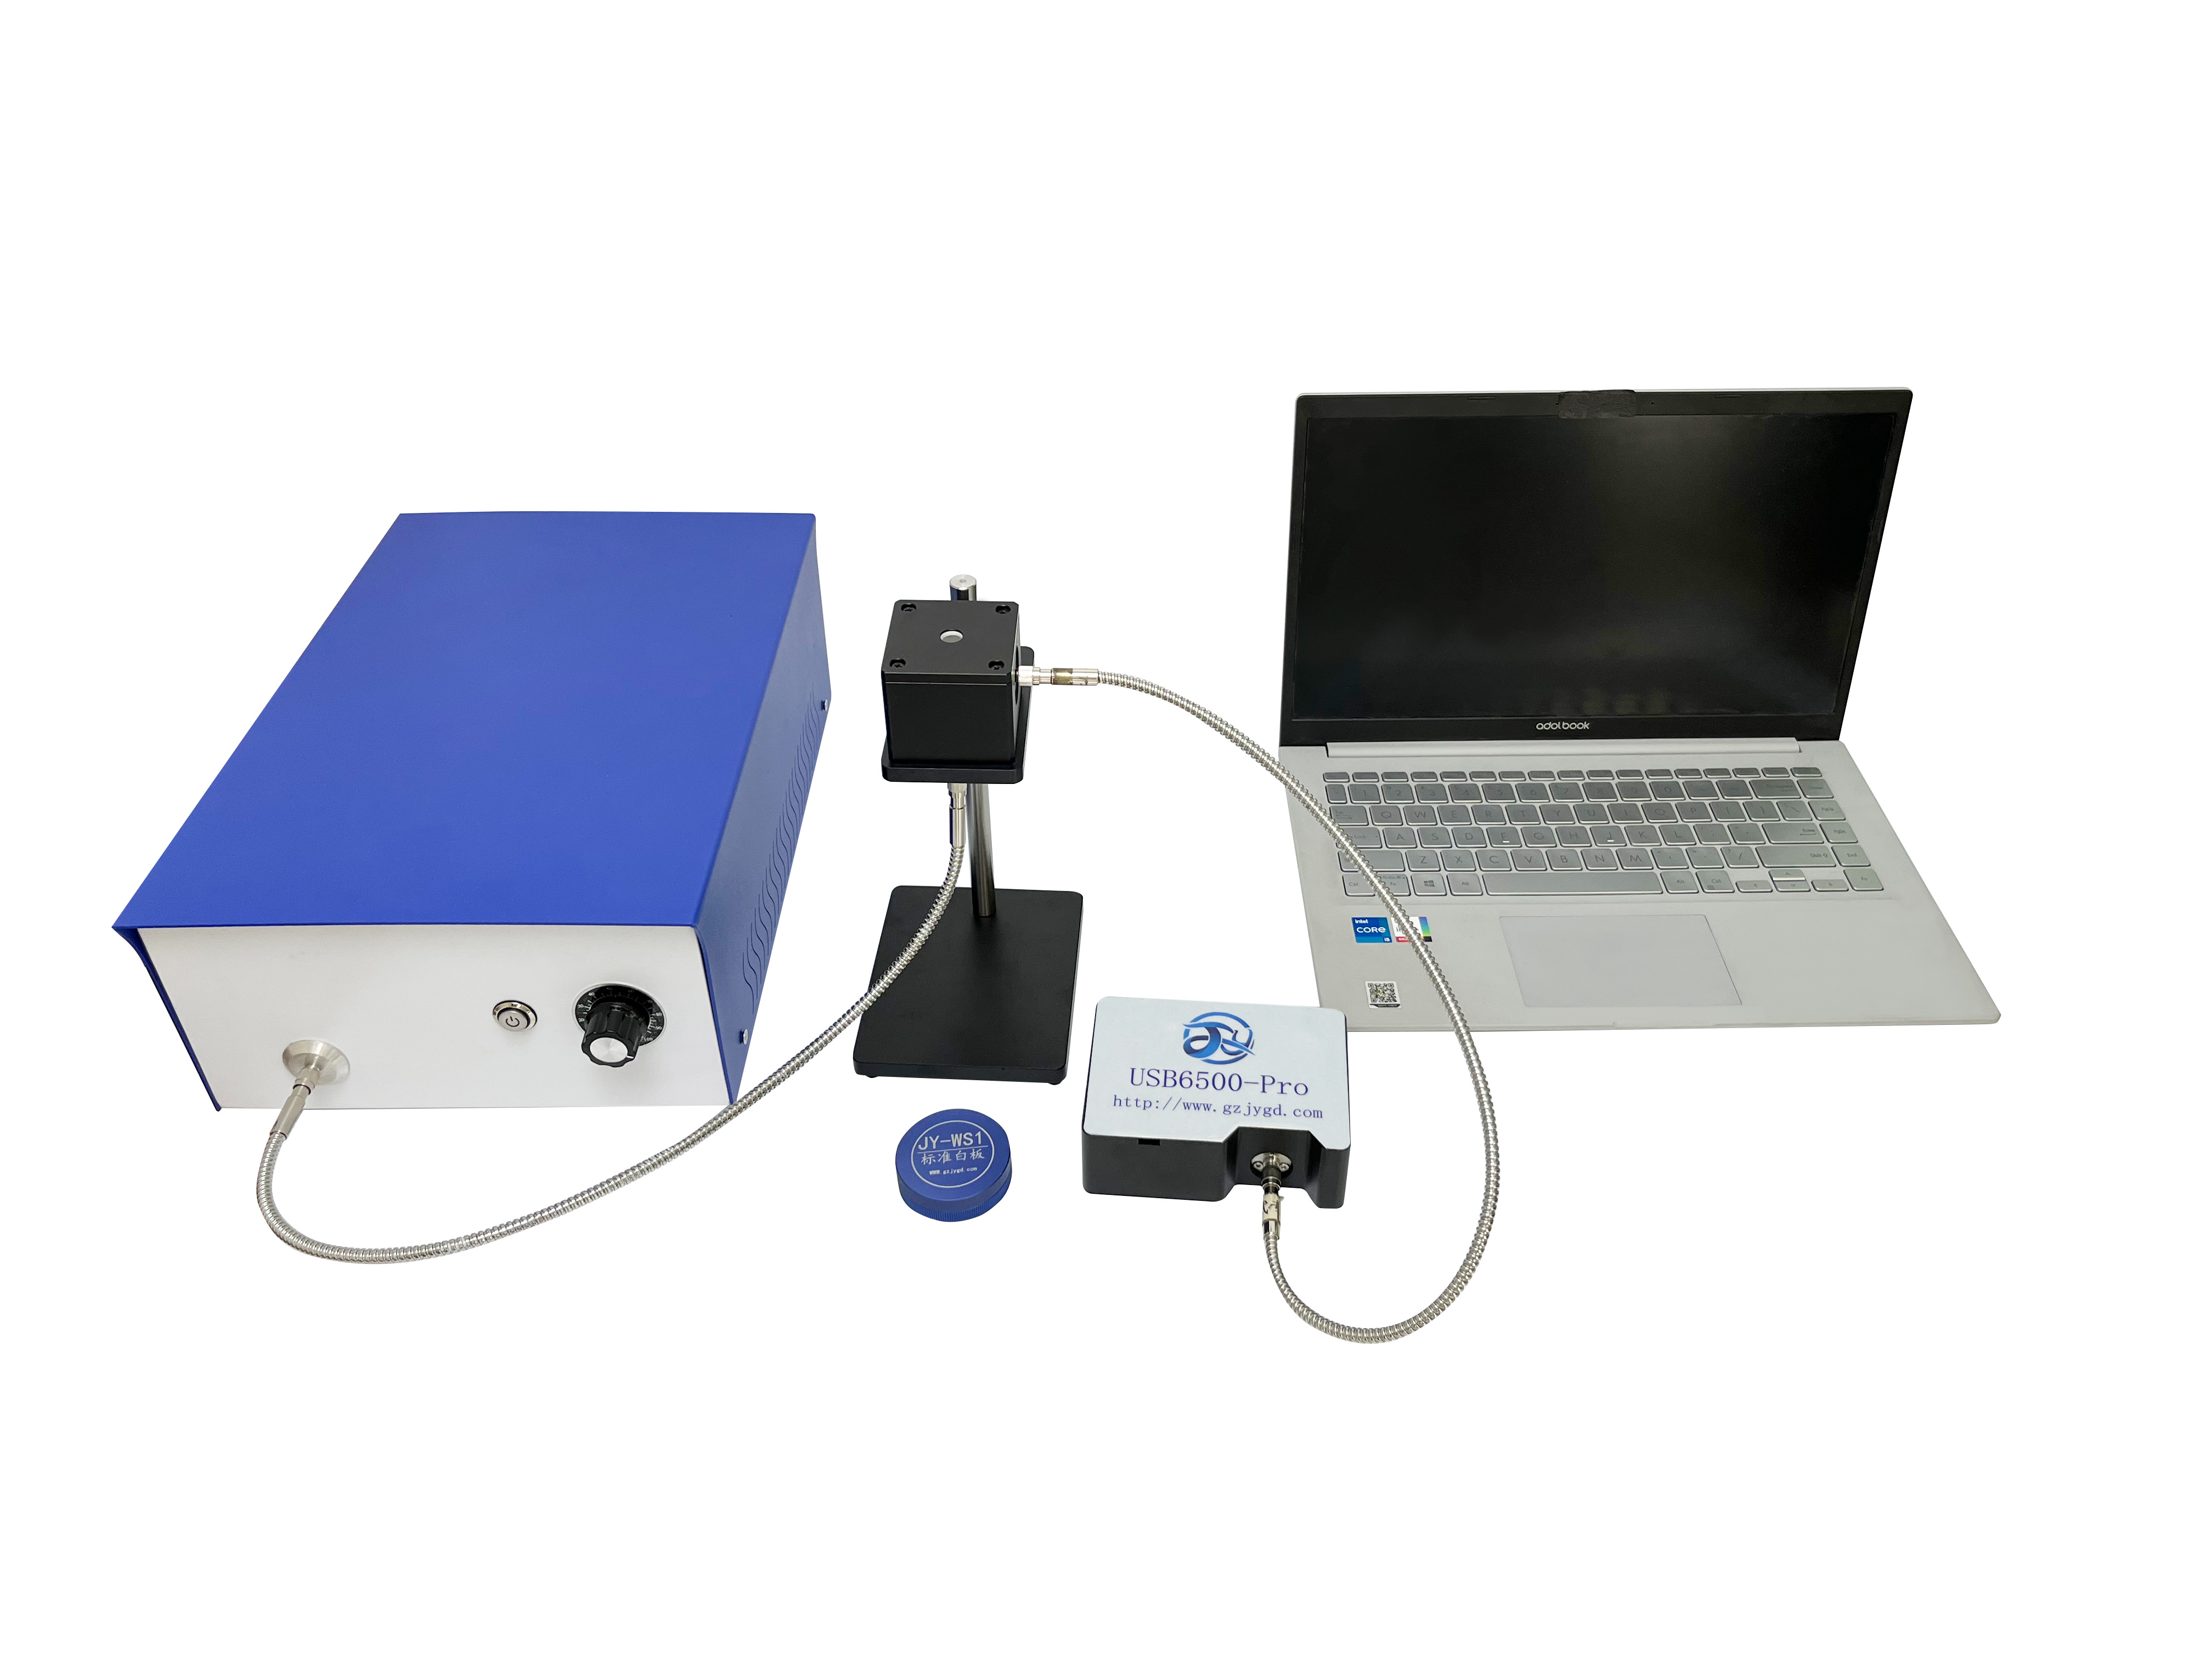
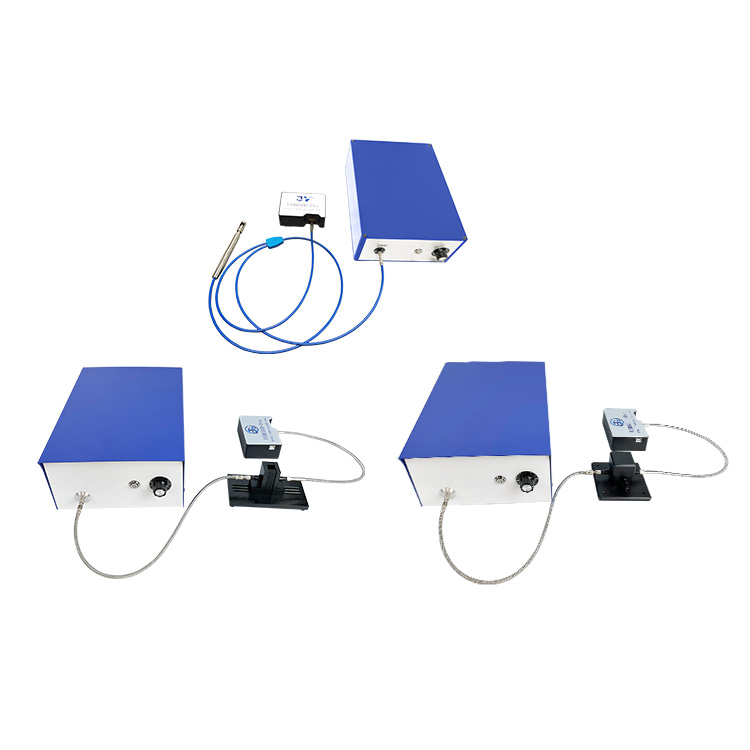
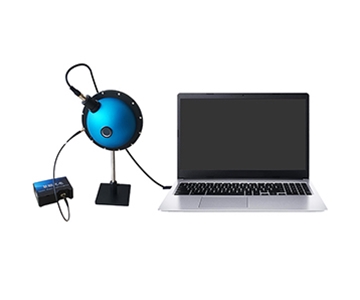
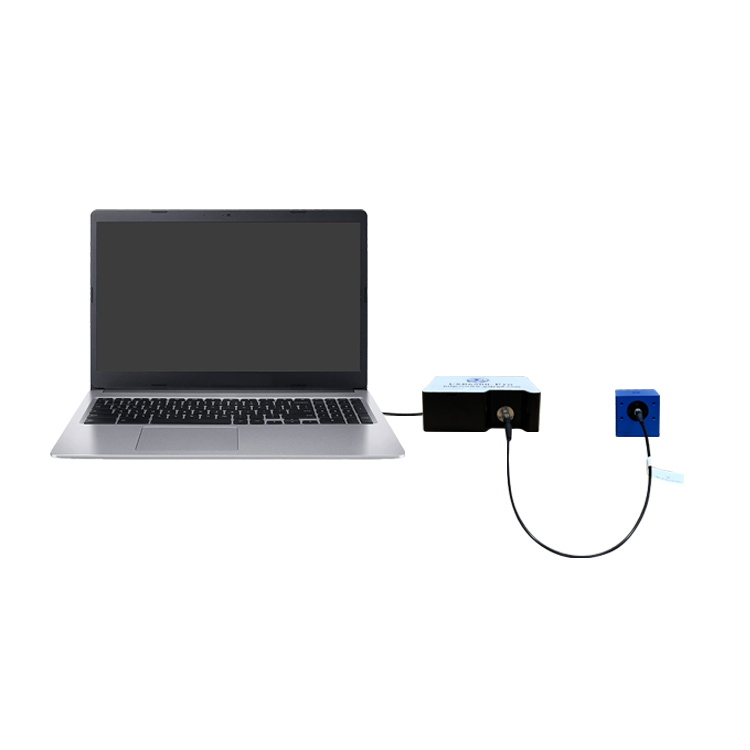
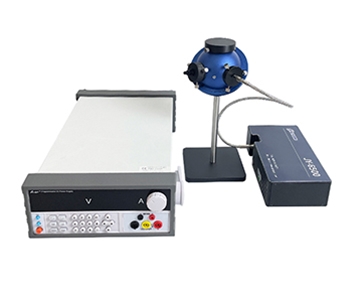
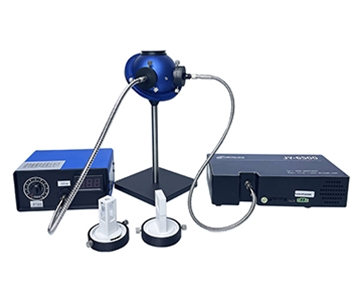
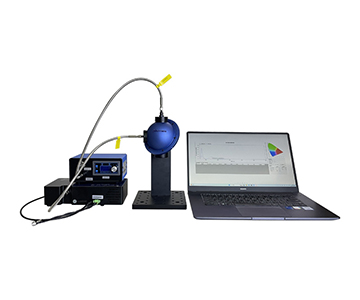
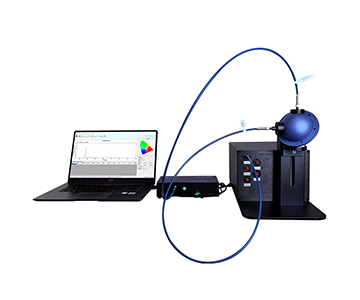
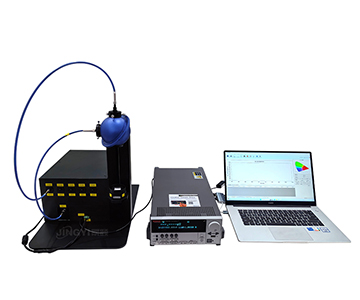
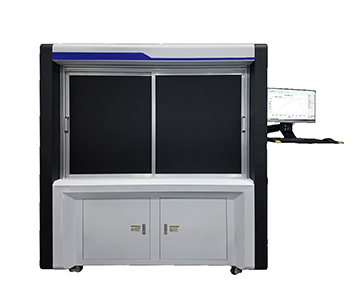
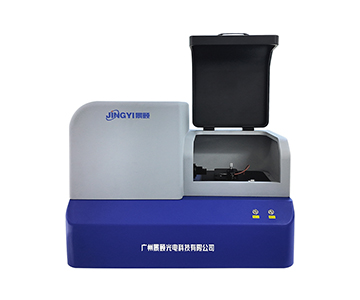
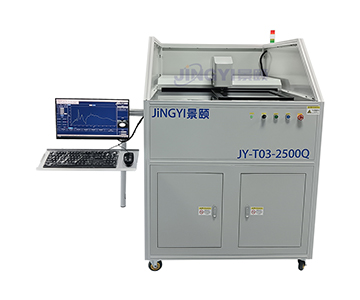
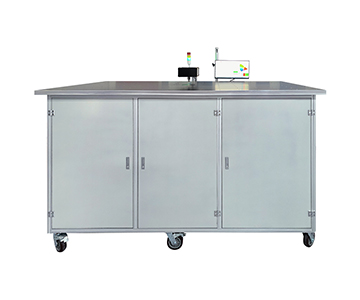
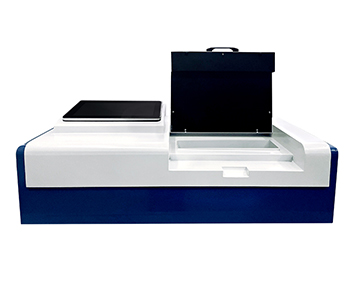
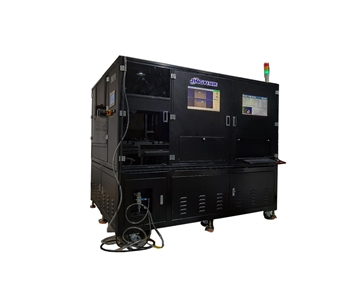
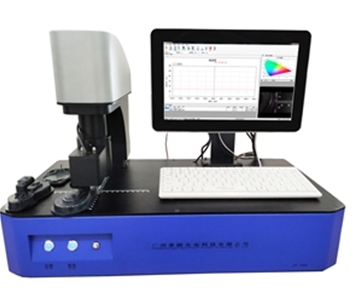
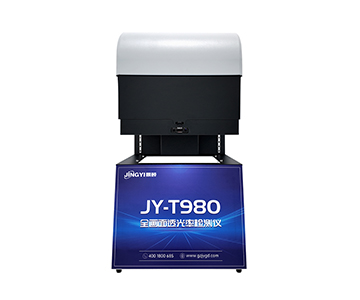
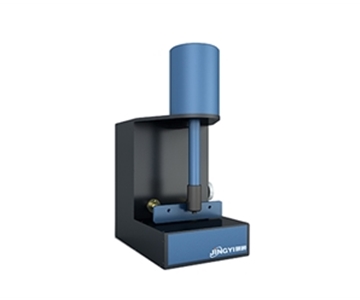
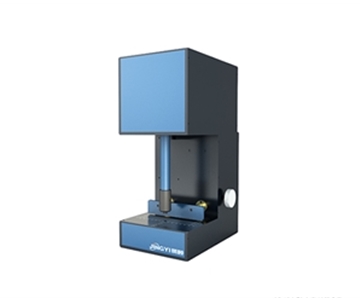
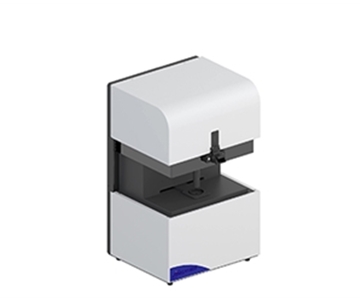
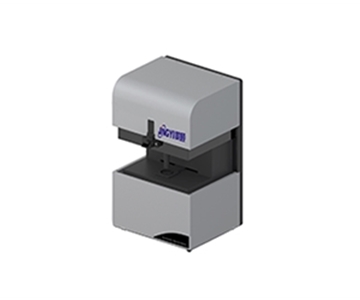
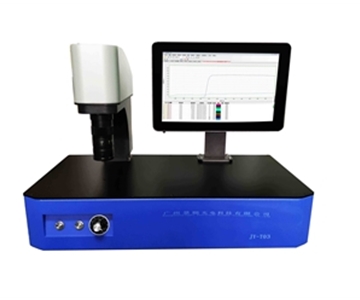
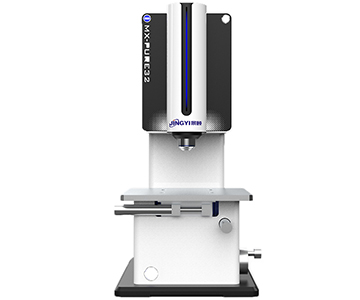
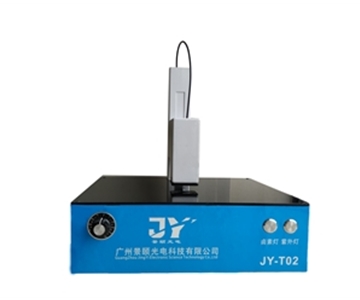
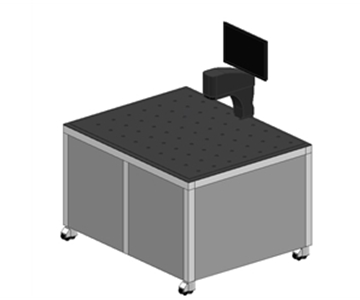
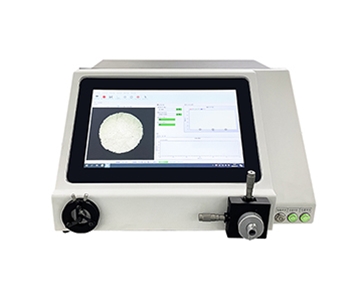
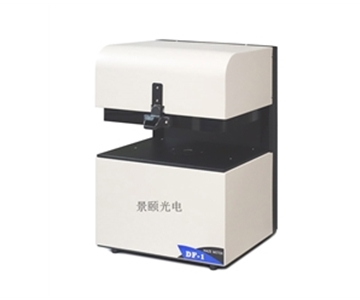
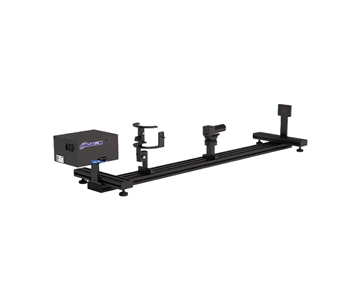
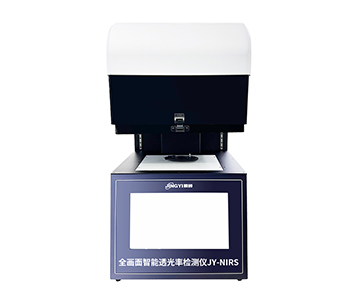
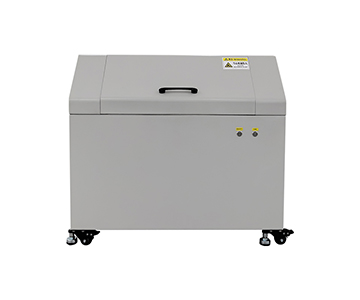
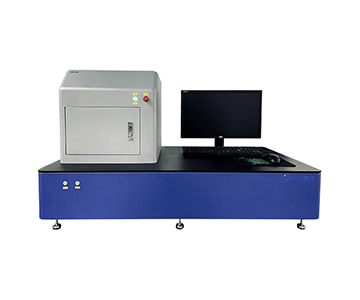
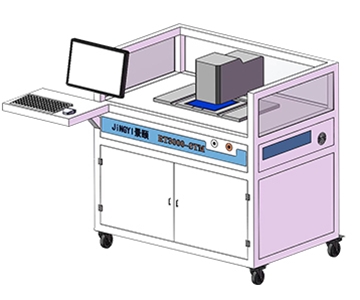
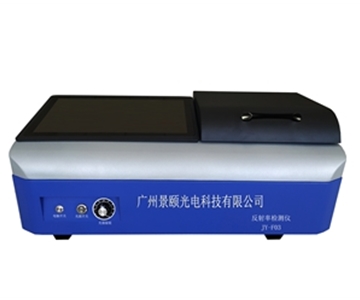
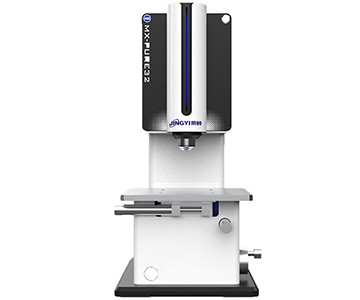
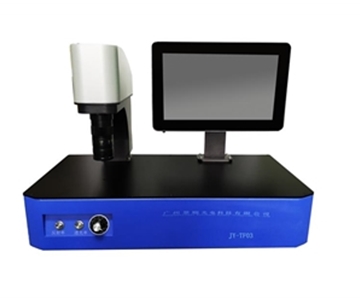
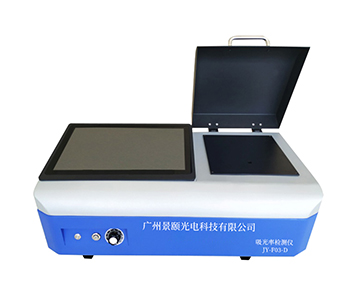
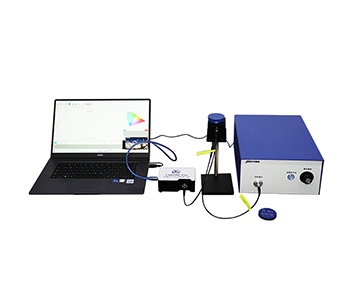
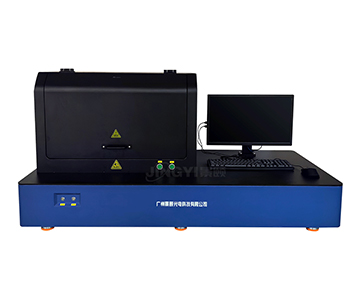
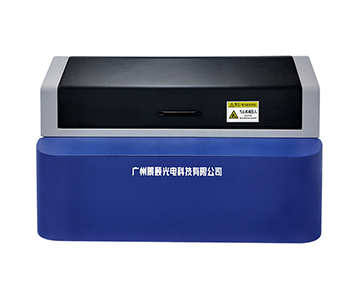
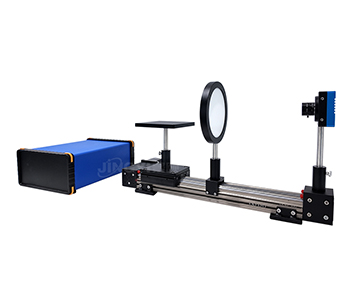
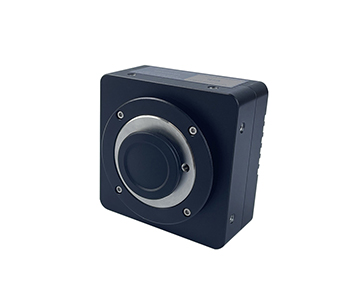
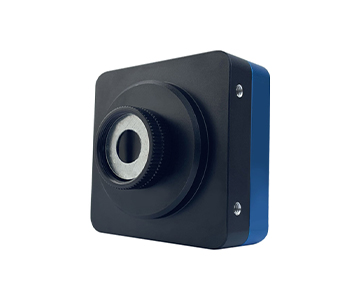
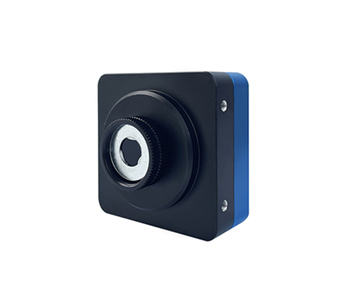
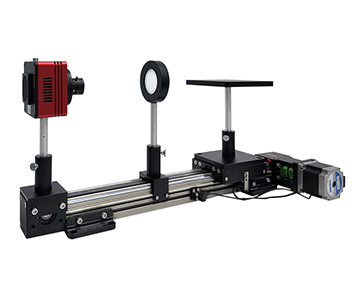
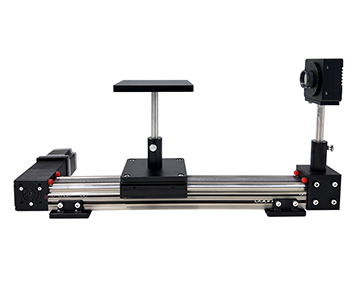
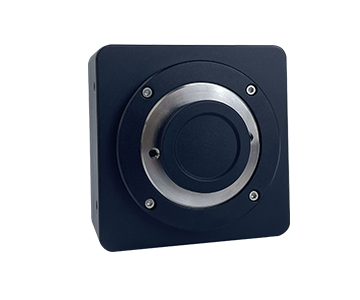
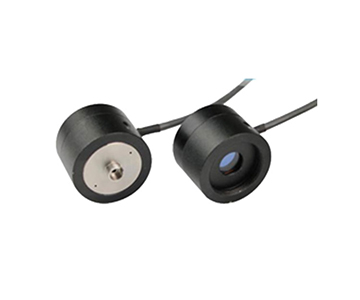
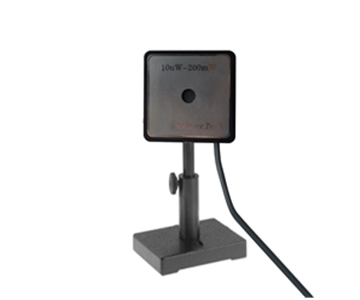
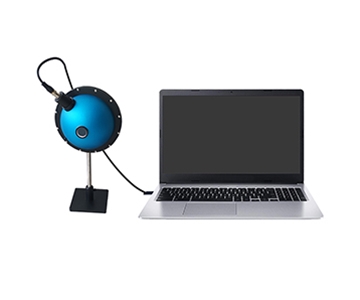
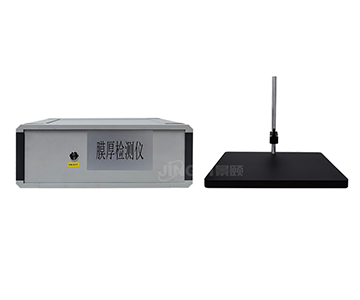
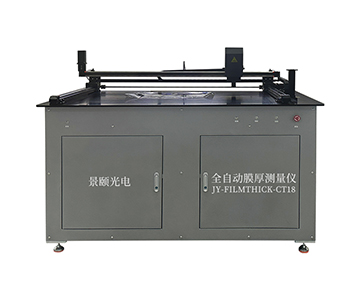
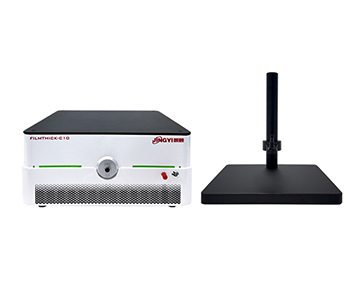
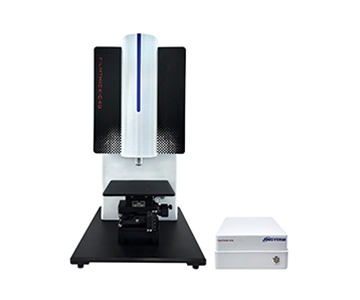
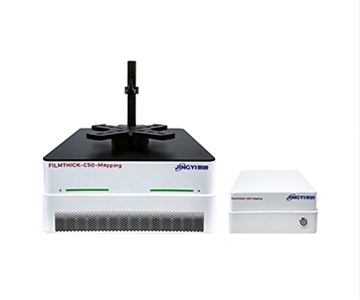
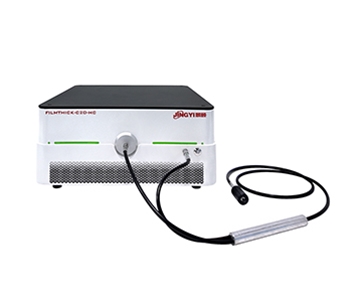
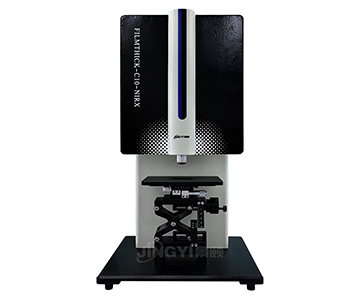
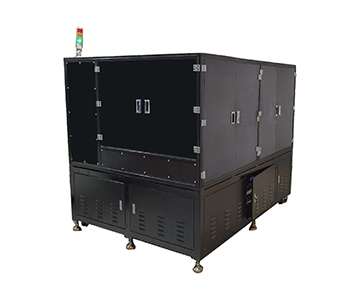
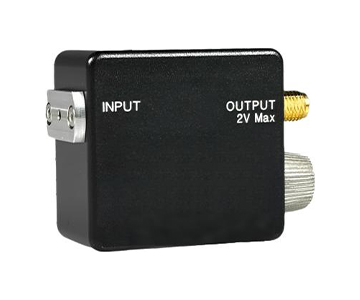
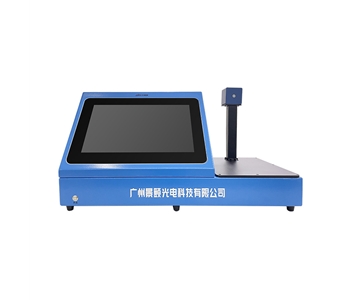
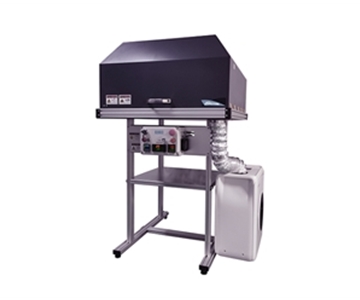
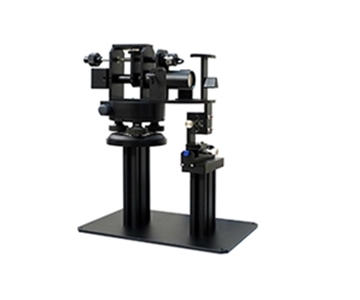
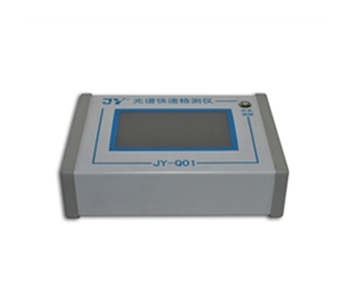
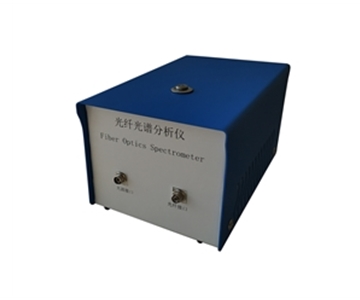
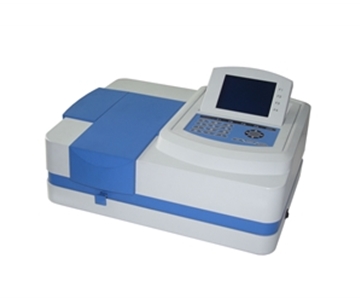
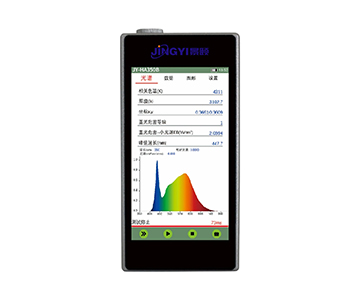
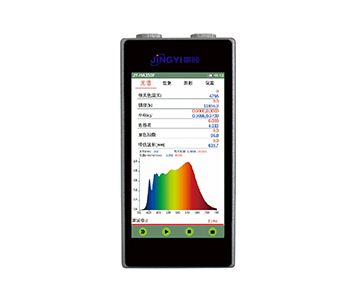
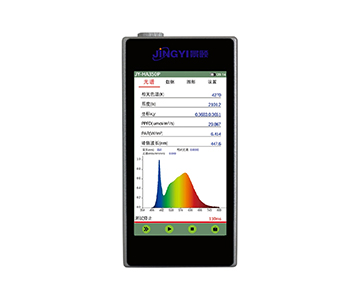
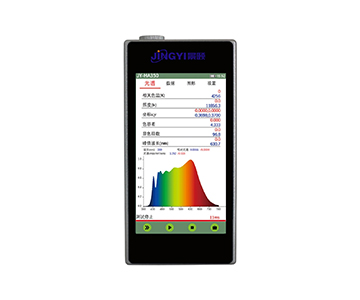
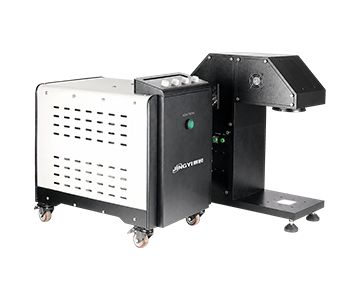
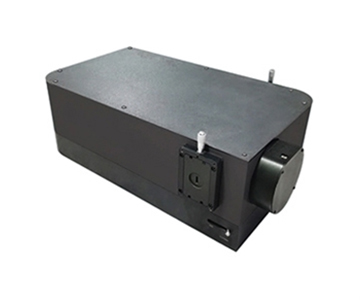
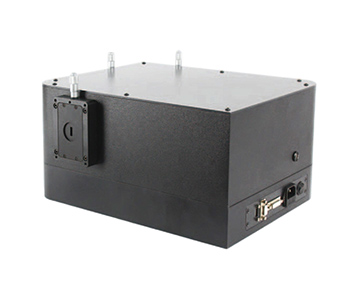
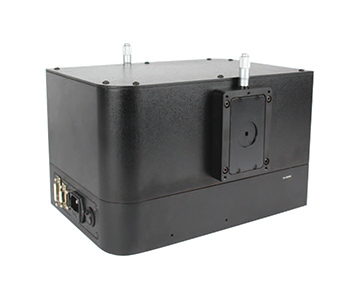
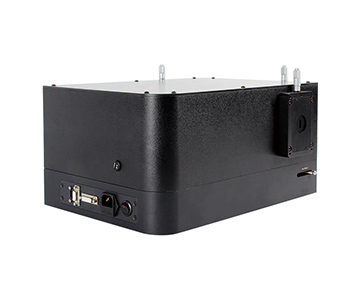
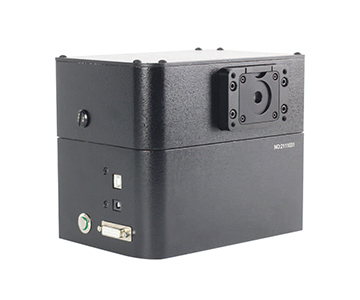
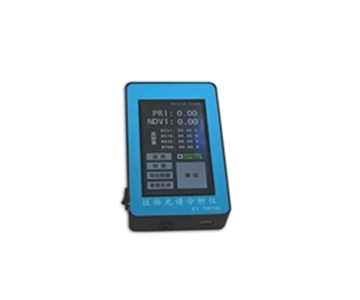
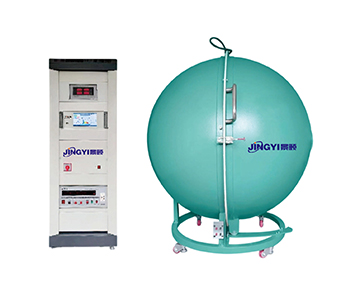
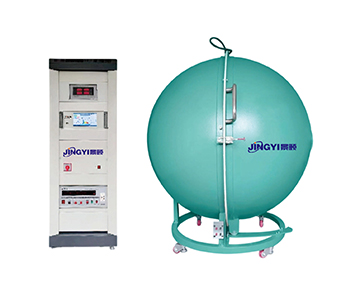
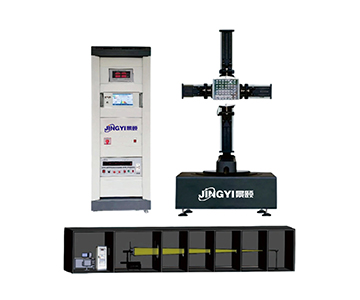
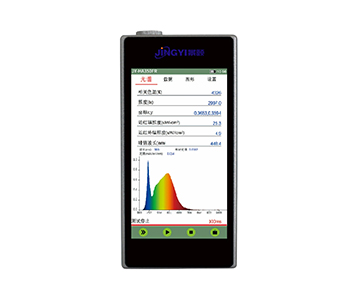
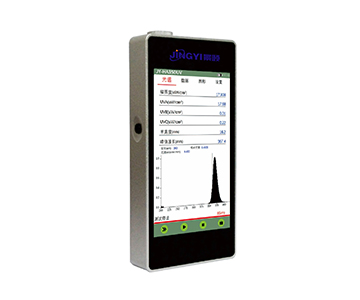
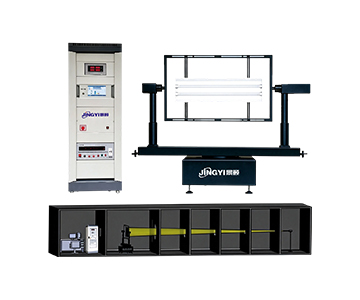
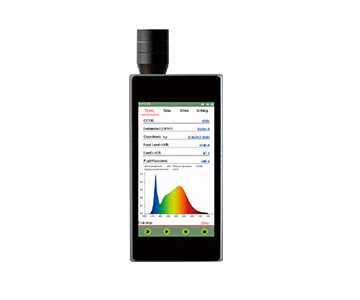
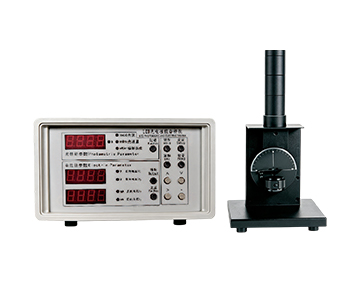
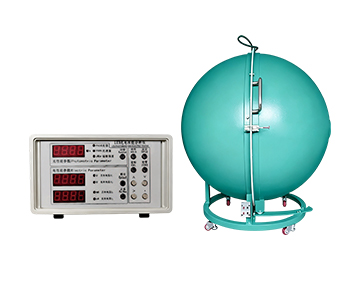
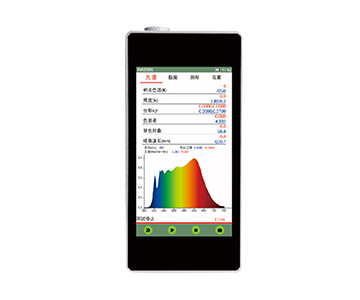
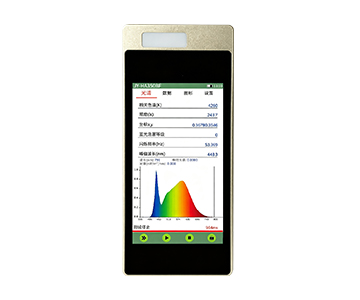
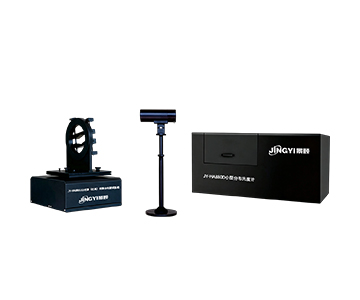
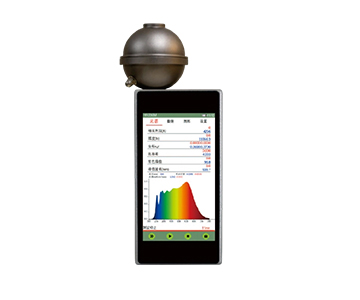
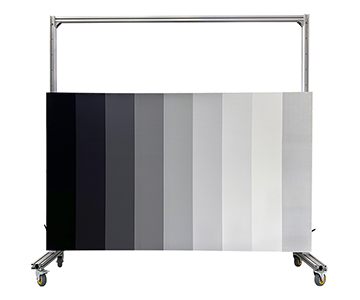
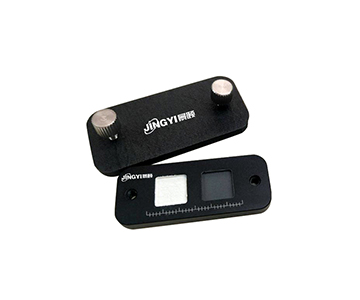
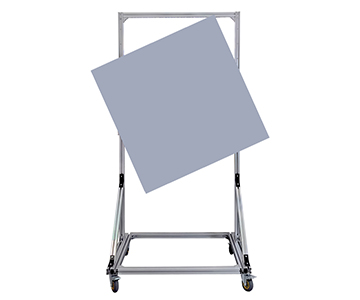
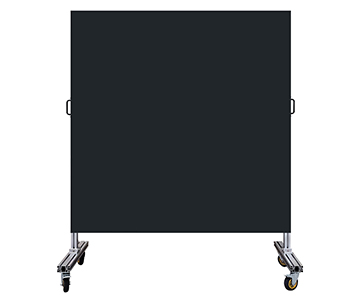
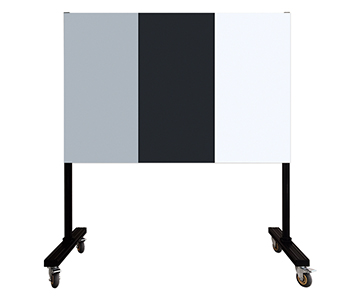
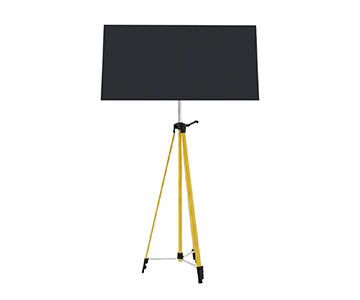
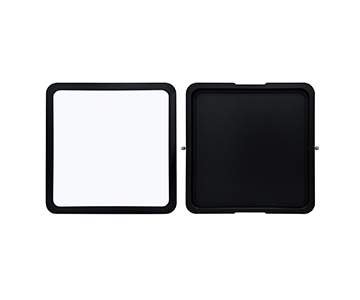
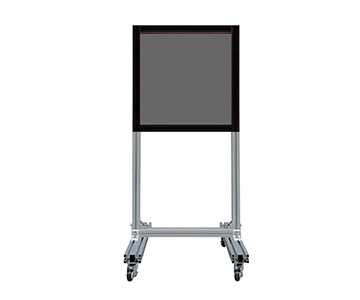
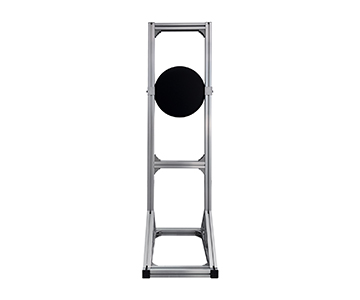
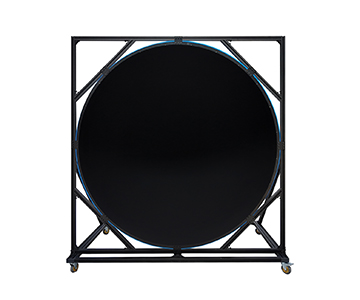
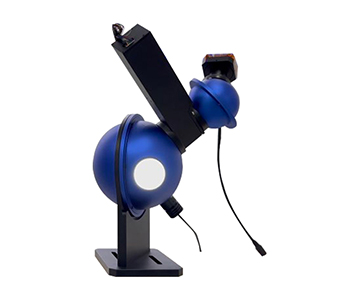
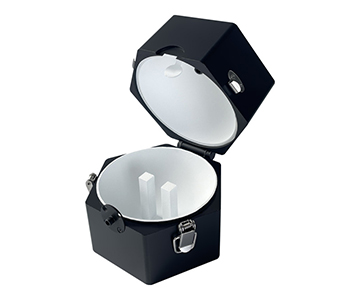
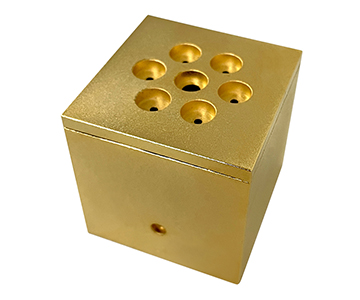
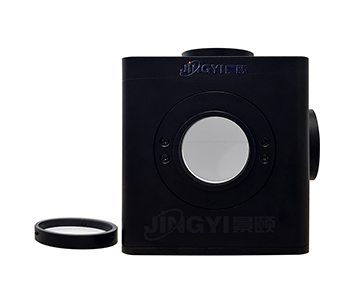
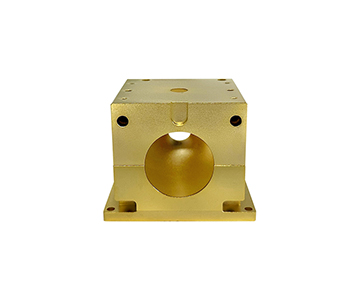
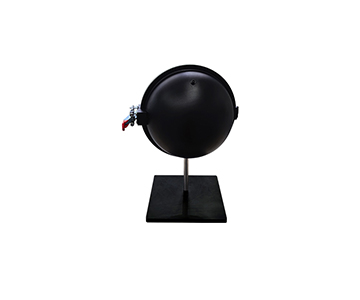
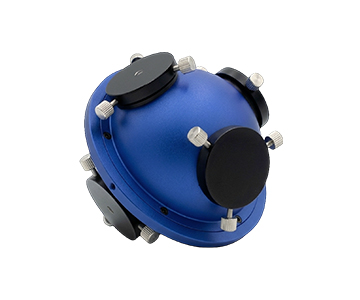
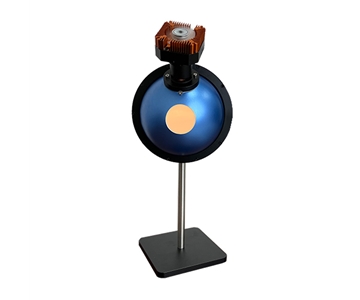
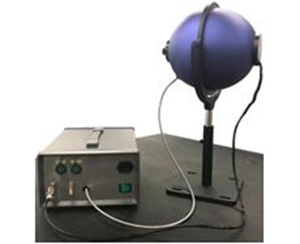
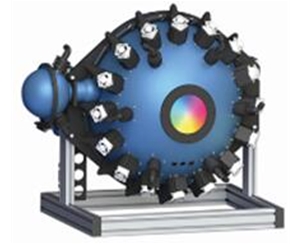
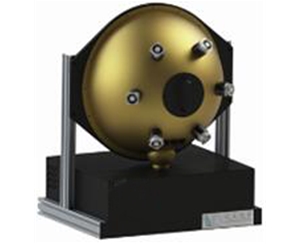
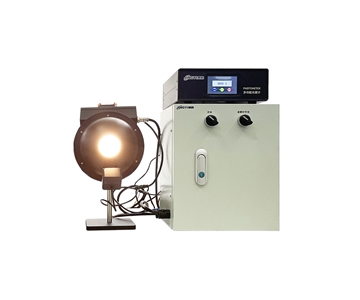
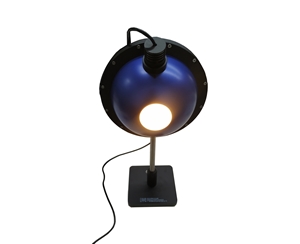
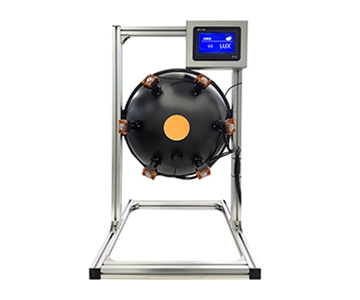
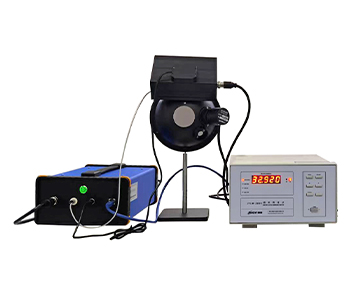
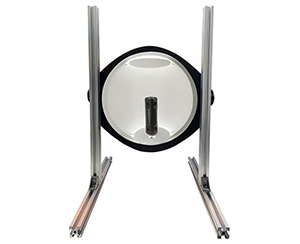
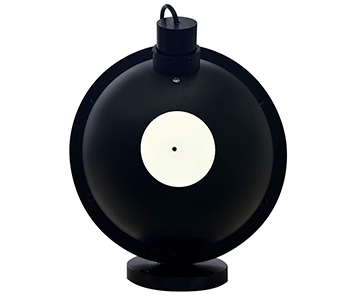
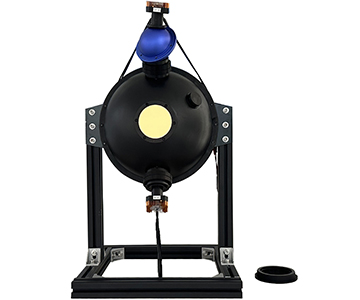
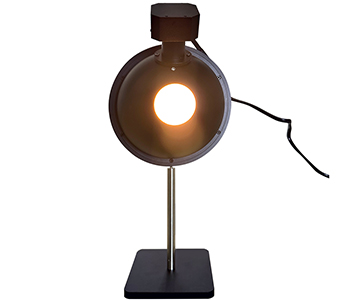
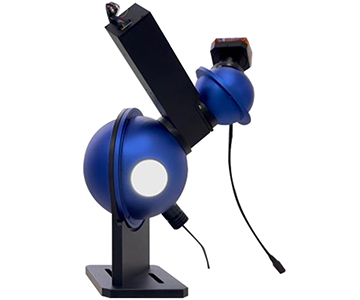
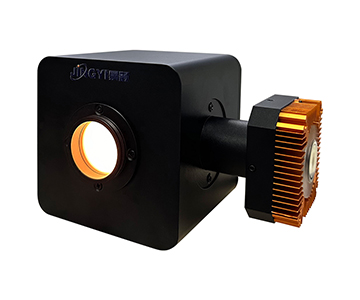
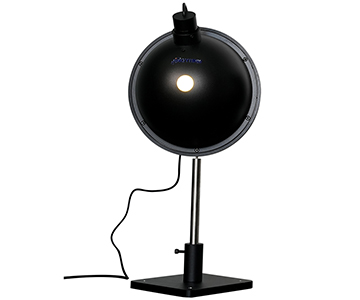
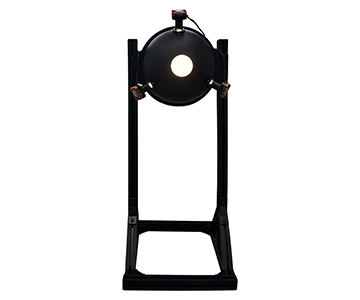
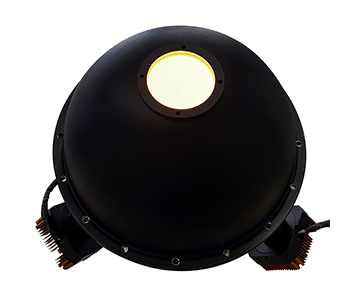
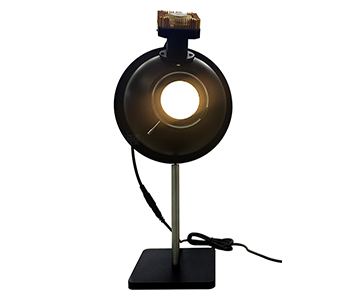
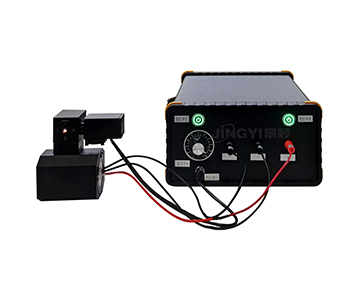
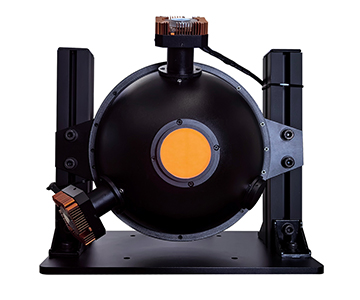
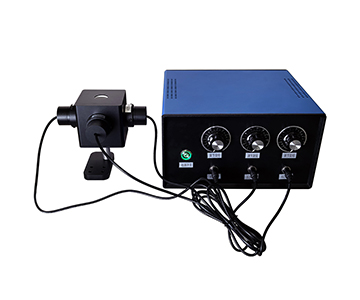
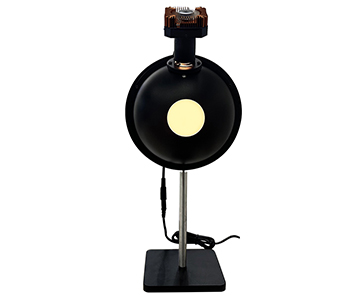
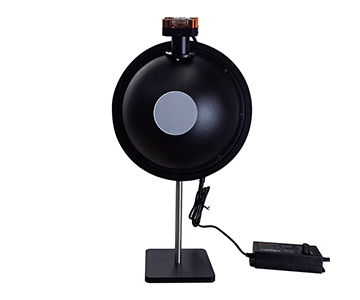
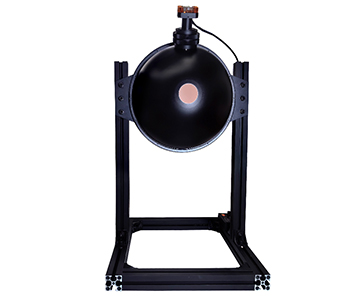
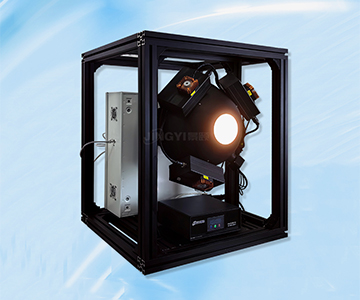
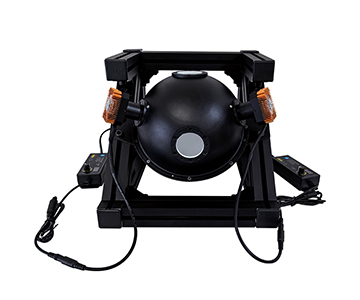
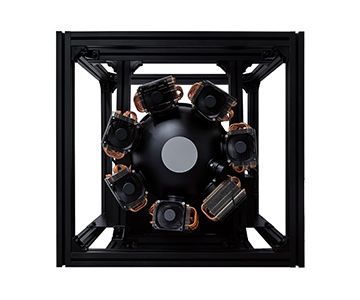
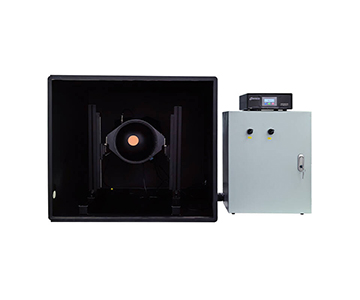
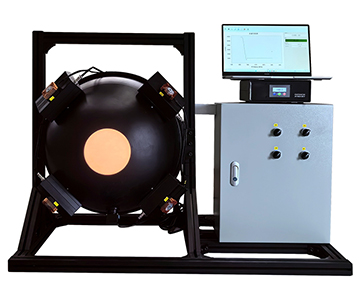
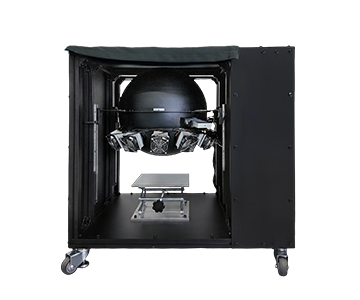
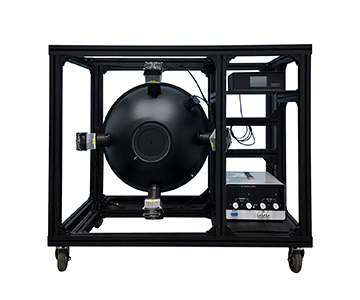
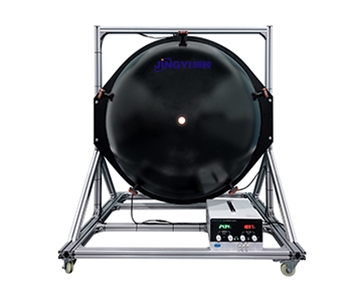
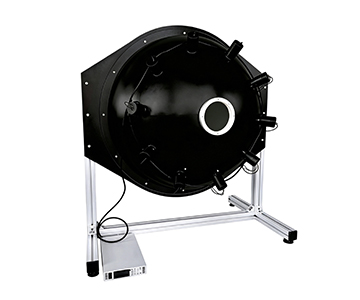
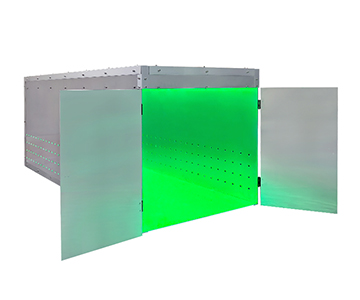
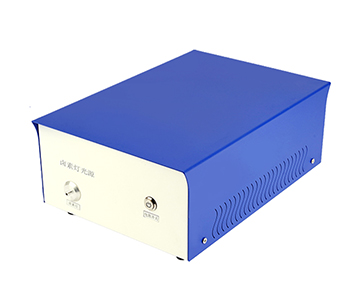
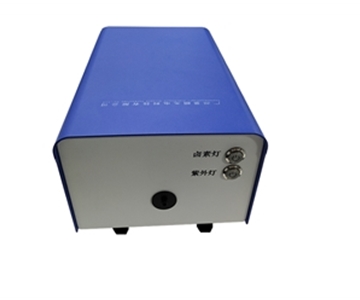
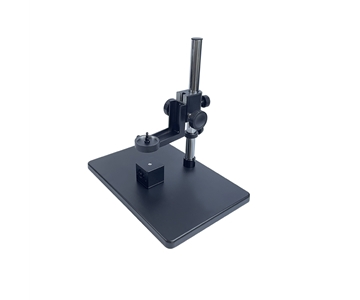
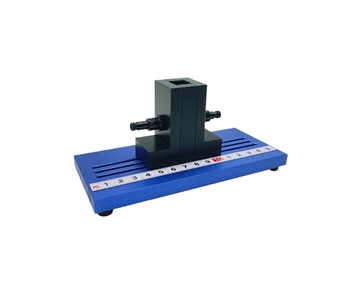
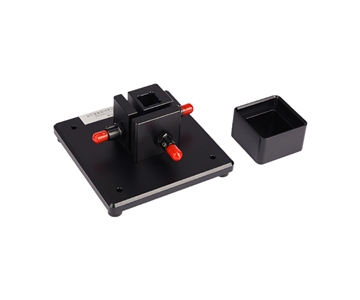
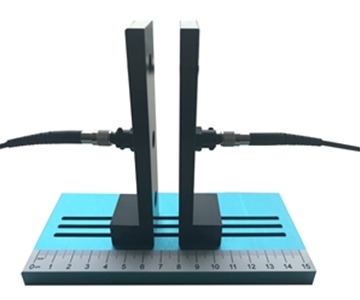
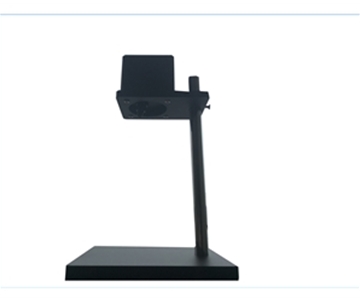
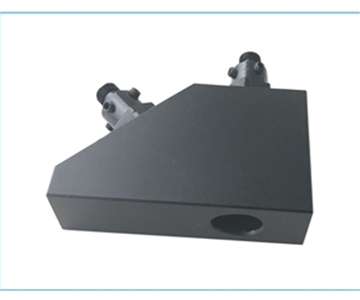
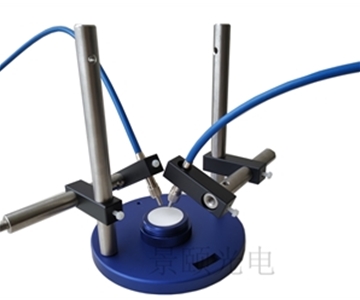
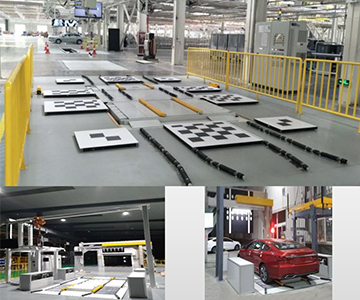
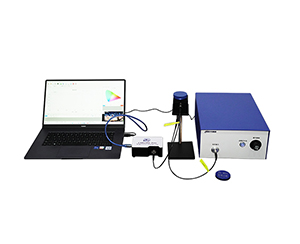
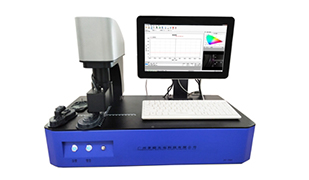
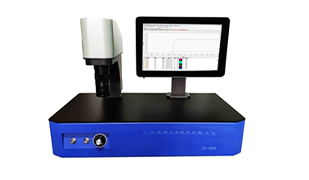
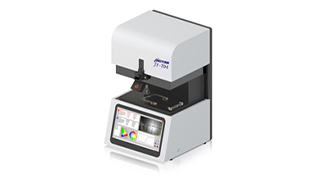
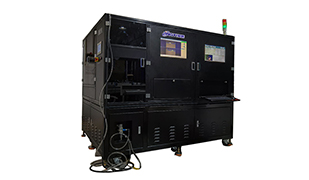
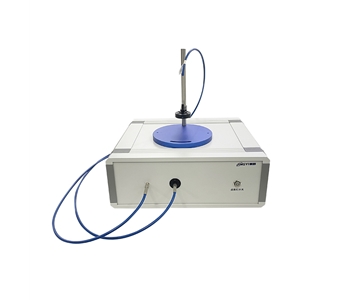
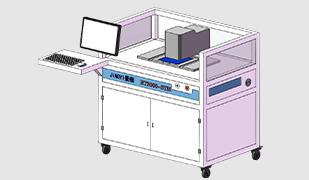
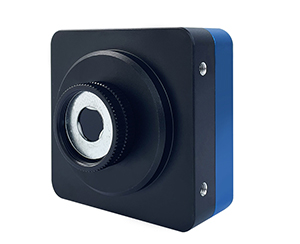
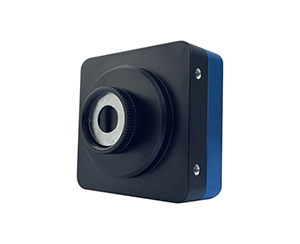
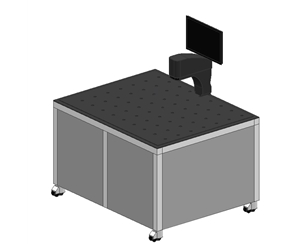
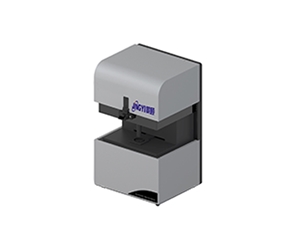
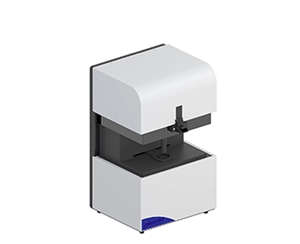
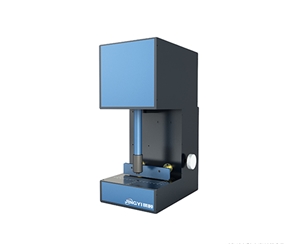
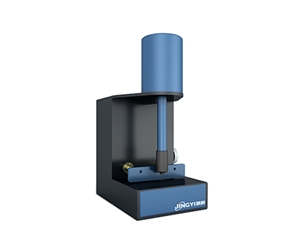
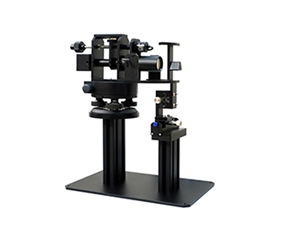
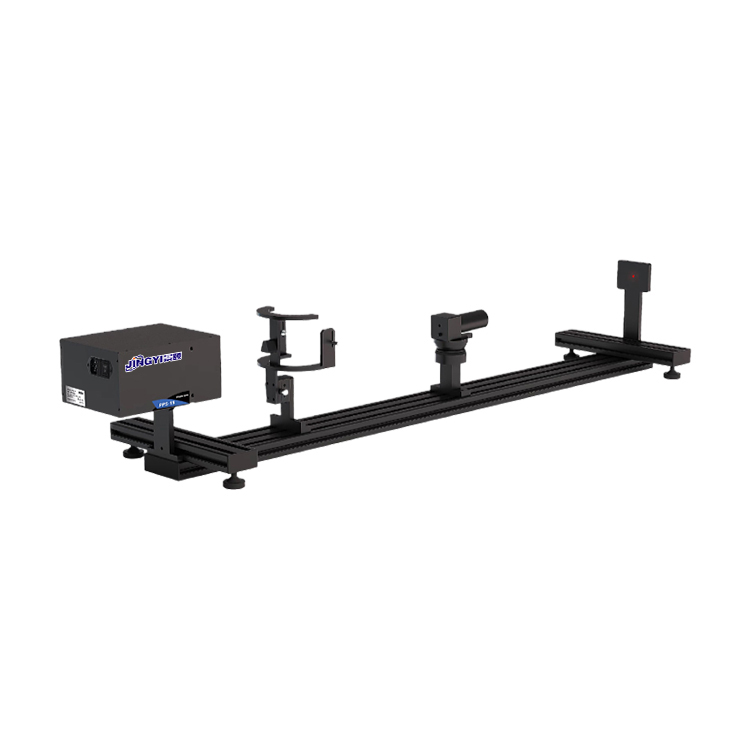
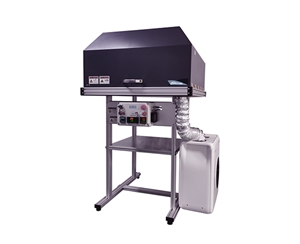
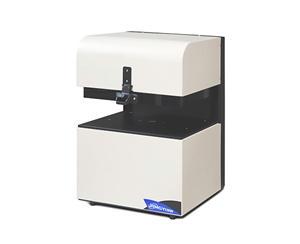
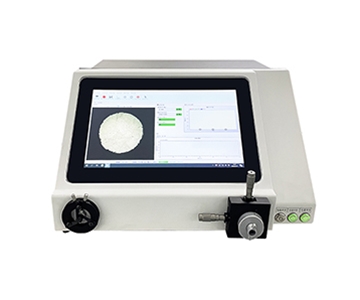
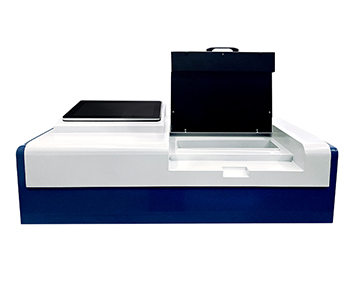
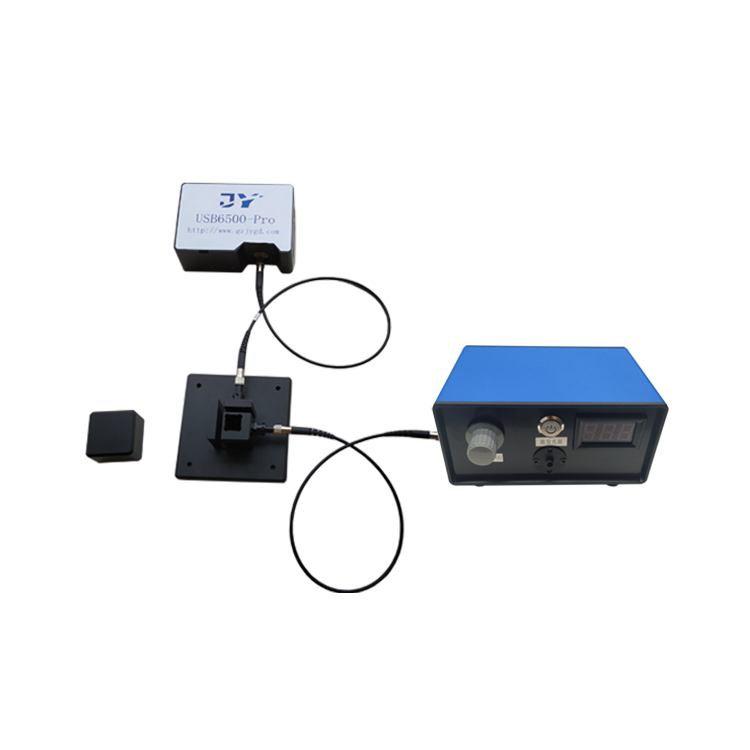
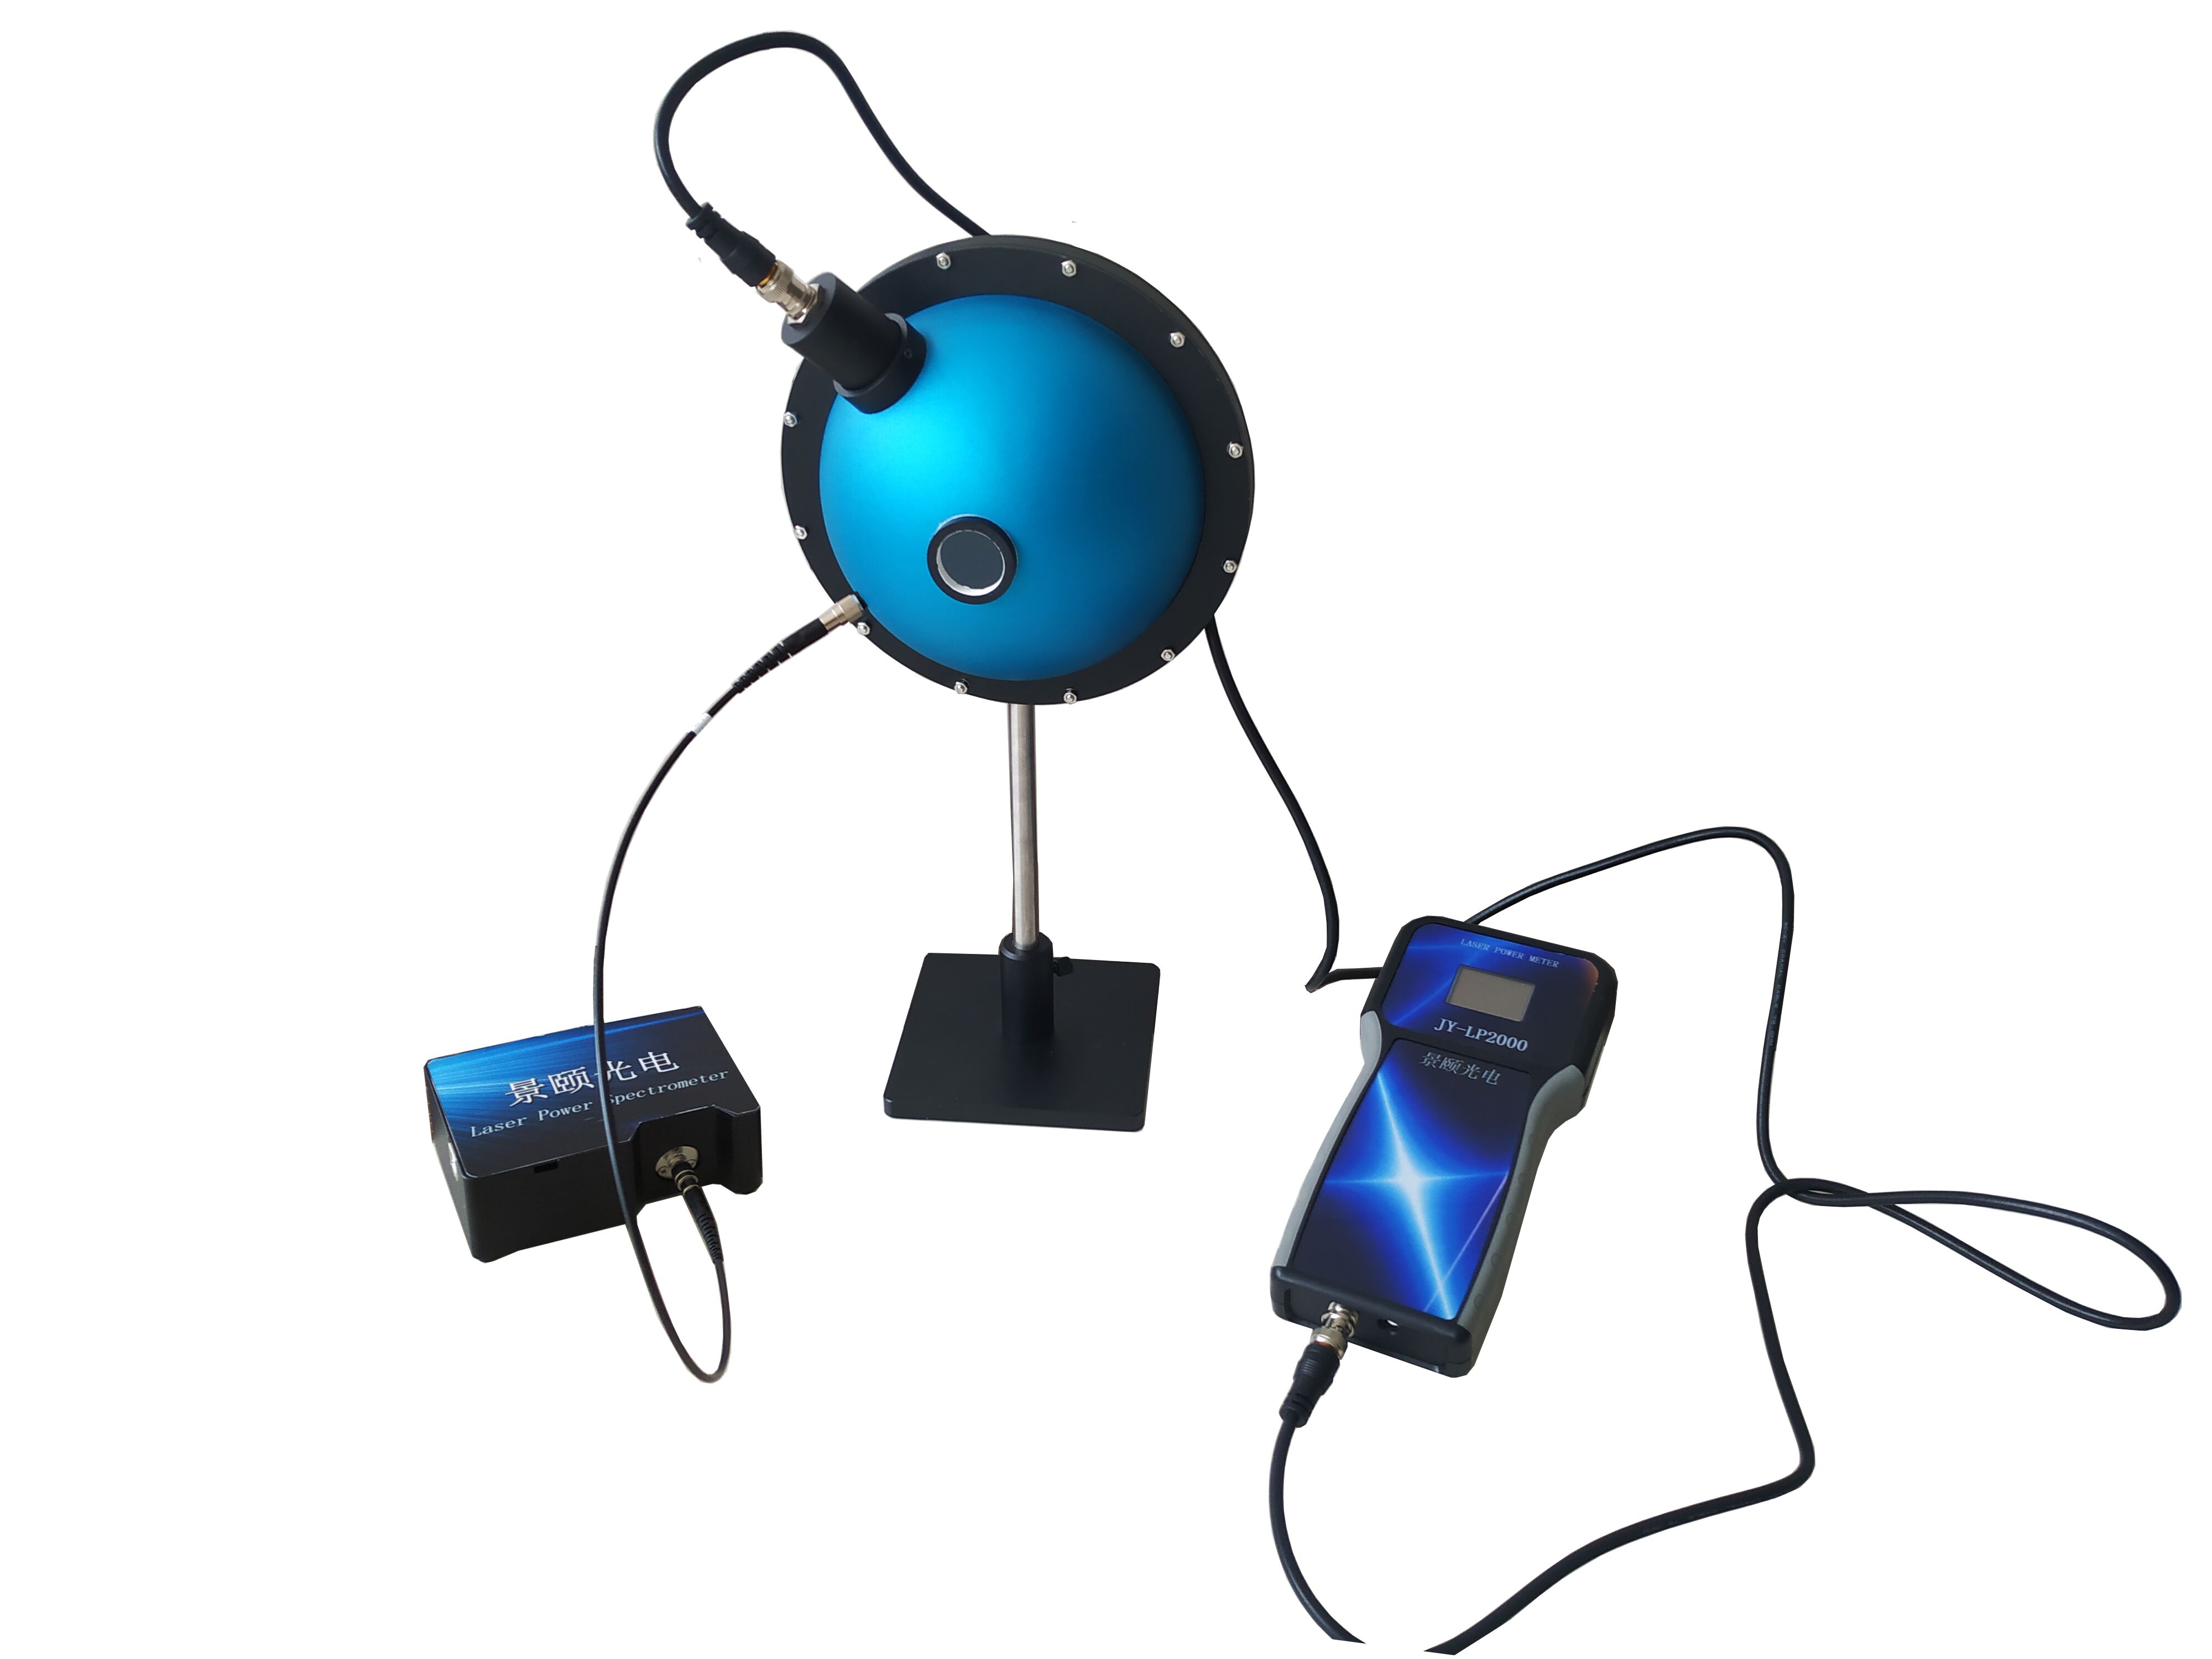
Automotive rearview mirror reflectance testing demands sub‑percentage accuracy across temperature extremes from –30°C to 65°C (–22°F to 149°F). Integrating sphere‑based systems capture full 400–1000 nm spectral curves at 1 ms sampling intervals, converting subjective “glare reduction” into traceable numerical thresholds required by ECE R46 and SAE J985. These systems illuminate the mirror surface with a halogen source, collect reflected light via fiber optic spectrometer, and reference against a calibrated PTFE whiteboard to achieve repeatability better than 0.01. The evaluated equipment supports laboratory sampling and inline end‑of‑line monitoring for manual anti‑glare, electrochromic, and camera‑monitor system (CMS) rearview mirrors, covering key parameters such as de‑energized high reflectance, energized low reflectance, transition time, power‑fail safety, and reverse‑gear response.
Why Mirror Reflectance Is Not Just About “Brightness”
During a night drive on a highway, headlights from a trailing vehicle hit the interior rearview mirror. The lens darkens in roughly one second—that is electrochromic auto‑dimming at work. But “darkening” is not a matter of feel; it is a numerical requirement. Dual‑mode mirrors must maintain reflectance no lower than 40 % in the daytime position and no lower than 4 % in the nighttime position under standards like ECE R46.
If a batch of electrochromic lenses only reaches 5.8 % in low‑reflectance state, human inspection may judge them as “dark enough,” yet they sit right on the compliance margin. Worse, at low temperature the reflectance may drop to 3.9 %, resulting in non‑conformance. A quality inspector at an OEM once discovered during an overnight shift that samples passing at room temperature failed retest at –30°C; root‑cause analysis traced the issue to embrittlement of conductive adhesive slowing the response.
Traditional visual checks and single‑point illuminance meters only tell whether “there is reflection.” They cannot reveal spectral curves or capture the transition from bright to dark state. The essence of reflectance testing is translating “looks comfortable” into auditable digital data.
What the System Actually Measures
A reflectometer acts like a scale for “reflective weight”—the incident light is the counterweight, and the amount of light reflected back is the reading. In a production line, the question is not whether the mirror looks bright, but how much light it returns to the driver at specified wavelengths.
Core Components: How Light Becomes Compliance Data
Halogen Lamp and Integrating Sphere
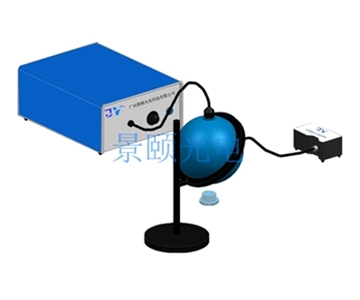
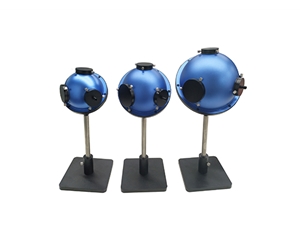
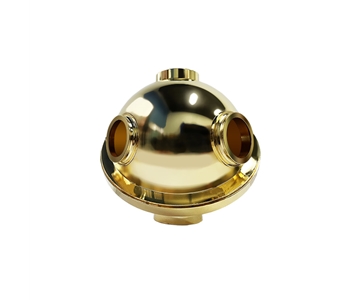
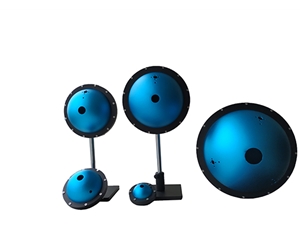
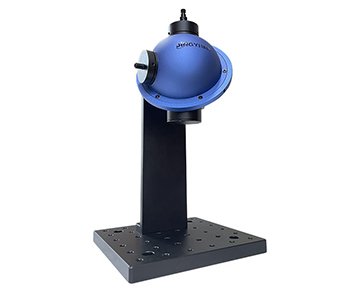
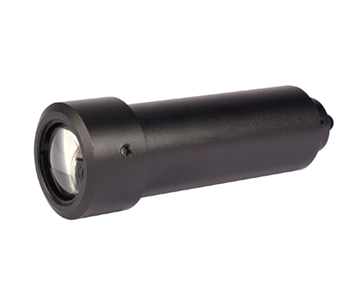
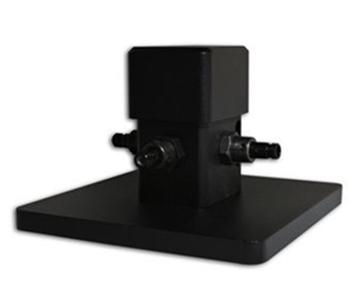
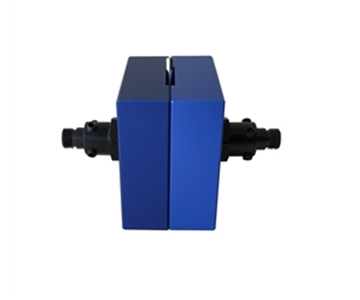
Light from the source does not strike the mirror directly; it first enters an integrating sphere. The sphere’s inner coating exceeds 99 % reflectance, creating a uniform light field through multiple diffuse reflections. This resembles the water curtain under a showerhead: whether the mirror is slightly off‑center or convex‑curved, illumination remains even. On the production floor, this means sample positioning errors are not amplified into system deviations.
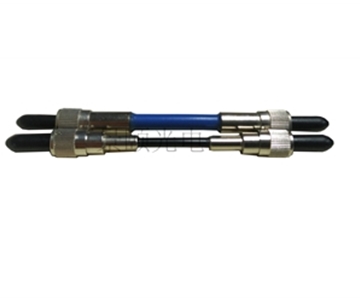
Fiber Optic Probe and Spectrometer
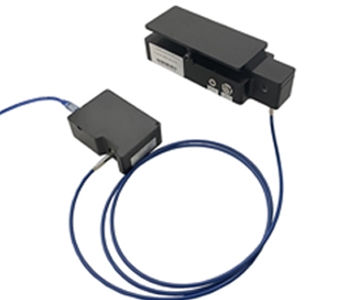
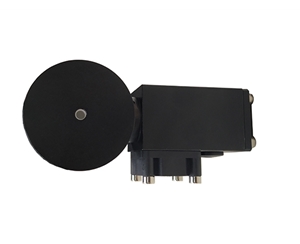
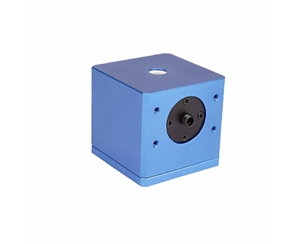
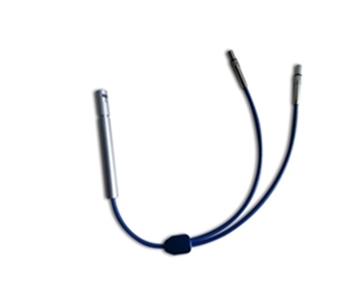
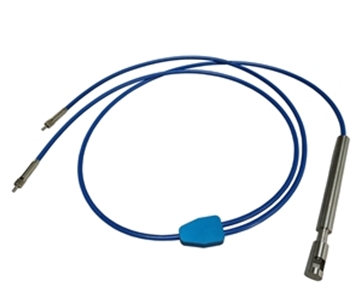
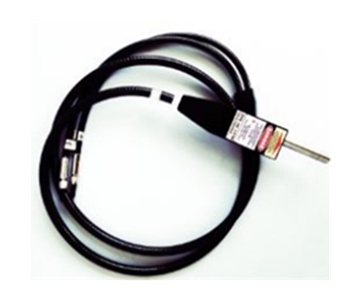
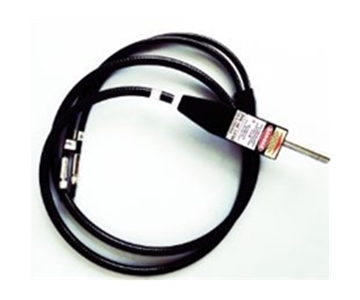
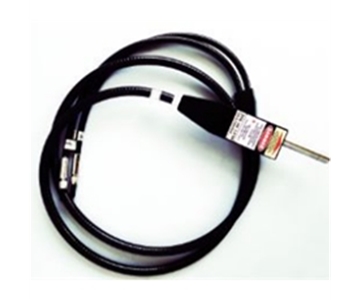
Reflected light travels through a 3 m fiber optic cable into a spectrometer, delivering reflectance distribution across 400–1000 nm at 1 nm intervals. Think of it as a supermarket barcode scanner that lists each item separately instead of just showing a total price. When an auto‑dimming mirror exhibits a sharp reflectance drop near 650 nm, the device plots a curve rather than a single percentage, letting engineers see exactly which wavelengths are “absorbed.”
Reference Whiteboard and Analysis Software
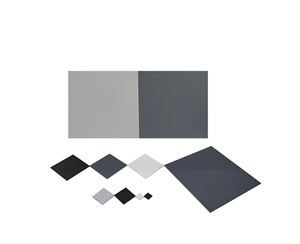
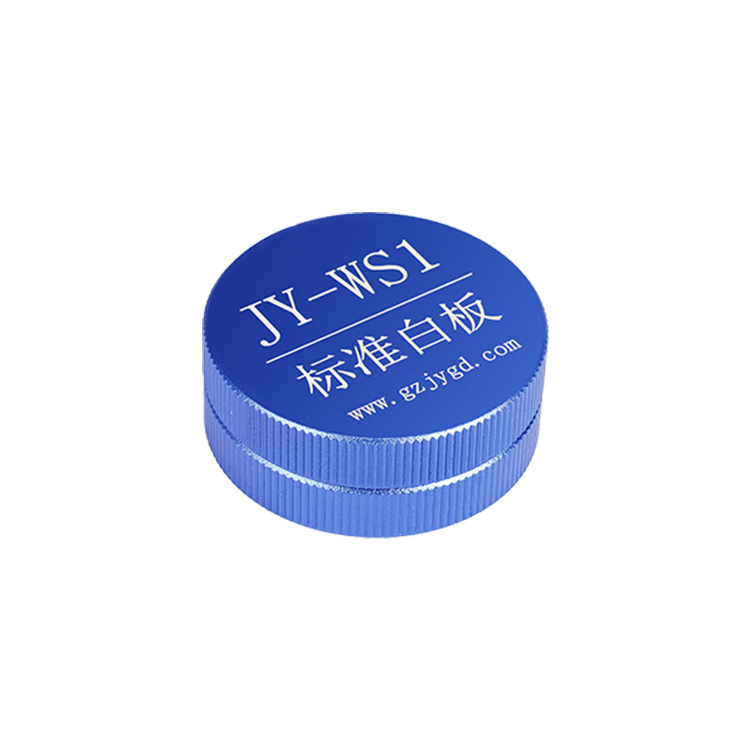
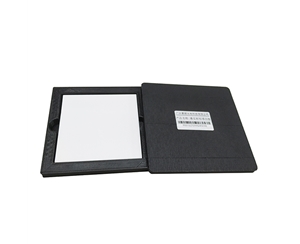
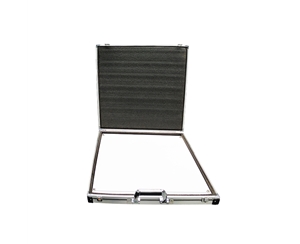
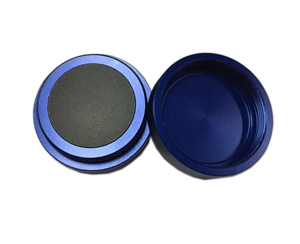
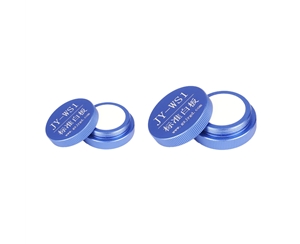
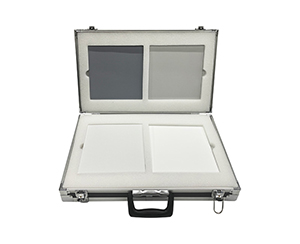
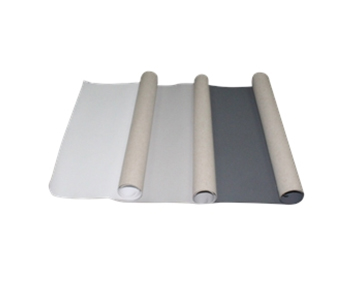
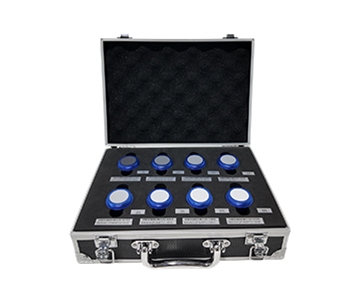
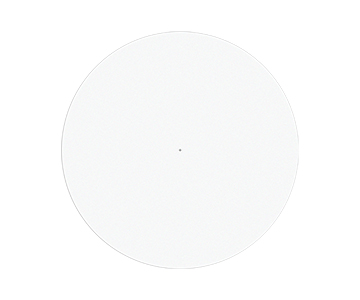
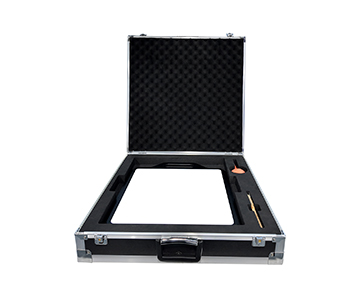
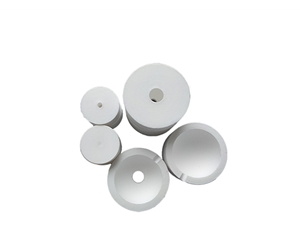
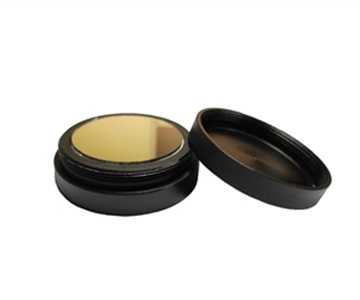
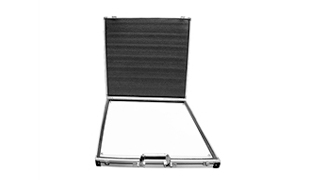
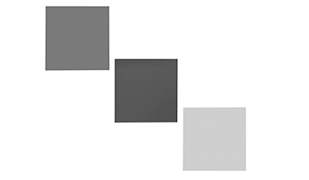
Before each test, a 27 mm PTFE whiteboard serves as the baseline. Software automatically subtracts ambient light and dark current. This is analogous to zeroing a scale before placing produce on it. In repeated measurements, slow drift from lamp aging is not mistaken for mirror reflectance changes; three‑measurement deviation stays within 0.01.
Two Real‑World Scenarios
Laboratory Sampling: Capturing Low‑Temperature Transition Time
At a third‑party metrology lab, an engineer placed an electrochromic mirror into a –30°C thermal chamber. After temperature stabilization, a glare simulation signal was applied. A benchtop system with 1 ms integration time continuously acquired reflectance. The curve showed the transition from high‑ to low‑reflectance state took 0.37 seconds longer than at room temperature. The batch was blocked from shipment, and the report was archived per standard test items.
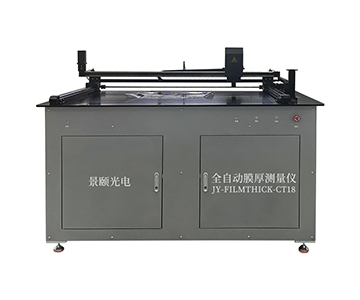
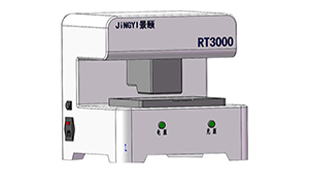
Production End‑of‑Line: Inline System Connected to MES
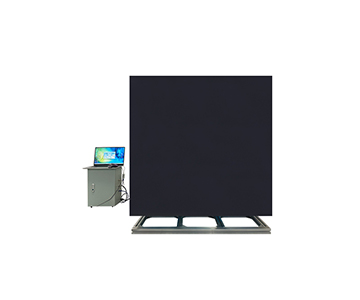
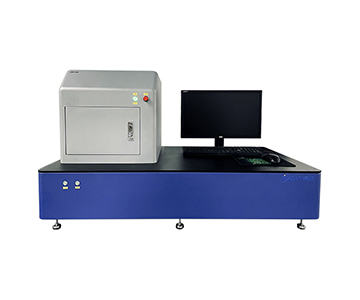
A Tier 1 supplier’s final inspection station uses an inline solution with a cycle time under 20 seconds per part. When reverse‑gear signal is triggered, the system measures the time for the mirror to recover from dark state to high reflectance; non‑compliant units are automatically rejected. During certification audits, data for each individual part can be tied to its batch number—no retroactive paperwork required.
Three Common Misconceptions
Misconception 1: High reflectance means a good mirror.
Incorrect. High reflectance during the day aids rearward visibility, but at night it bounces glare directly back to the driver’s eyes. The correct understanding: de‑energized state should be judged at no less than 40 %, while energized anti‑glare state must drop into the standard‑permitted low‑reflectance range.
Misconception 2: Measuring a single percentage is sufficient.
Wrong. A single‑point value misses the color‑change process. Proper practice requires a reflectance‑versus‑time curve; transition time under operating temperature, power‑failure recovery, and reverse‑gear response all depend on time‑axis data.
Misconception 3: Room‑temperature pass equals vehicle‑ready.
False. Electrochromic materials commonly slow down at low temperature and drift at high temperature. The correct procedure is to test samples inside a –30°C to 65°C thermal zone rather than relying on room‑temperature sampling.
Certification Compliance and Data Traceability
Regulatory standards define reflectance thresholds and test items, but what makes data “acceptable” is metrological traceability. As a contributing participant to ISO 17025‑accredited calibration frameworks, the evaluated system offers 0–100 % reflectance measurement range with accuracy better than 1 % (based on reference standard). This allows inclusion in standard‑framework value comparisons.
When selecting equipment, do not just ask “Is it accurate?” Ask three specific questions:
•Does the reference whiteboard come with factory calibration?
•Can the entire system operate continuously under high‑low temperature rather than moving samples out for measurement?
•Can the software output分项判定 (item‑by‑item judgments) for de‑energized high reflectance, energized low reflectance, transition time, etc., per standard clauses?
As global type‑approval timelines tighten—with deadlines approaching in early 2027—testing reports lacking time‑series curves face rising rejection rates from certification bodies.
Objective Limitations
Integrating sphere solutions from emerging suppliers offer good adaptability in cycle time and cost, but boundaries exist.
First, the 400–1000 nm configuration leaves a data gap at the 380–400 nm visible‑light edge. If future standard revisions impose constraints toward shorter wavelengths, wider‑bandwidth components will be required.
Second, transition‑time measurement is affected by lens response lag and chamber airflow. The device provides a “system‑measured time,” not the intrinsic chemical time of the electrochromic layer. For failure analysis, cross‑comparison with voltage and sensor signals is necessary.
These points do not indicate equipment failure; rather, purchasers should separate “instrument precision” from “sample physical delay” in their acceptance criteria.
Frequently Asked Questions
Q1: Do manual anti‑glare mirrors also need reflectance testing?
Yes, they require de‑energized high‑reflectance measurement, typically judged at no less than 40 %. Since manual mirrors lack an energized low‑reflectance state, transition time need not be tested.
Q2: Does a 1 ms single‑shot test mean response time accuracy of 1 ms?
No. 1 ms is the integration‑time resolution, not zero system error. Actual transition time depends on the method of determining the start point and threshold intersection from continuous curves.
Q3: Are camera‑monitor system (CMS) rearview mirrors within the scope of this equipment?
Yes. The system covers manual anti‑glare, electrochromic, and CMS interior mirrors. However, CMS units involving powered and signal‑response testing may require optional powered‑test modules.
Q4: How to choose between one unit for lab and one for production line?
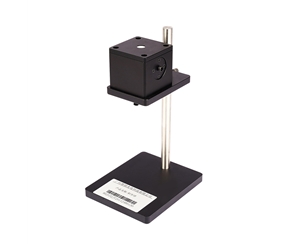
Laboratories prioritize spectral range and curves—select a benchtop model. Production lines prioritize cycle time and traceability—select an inline model. Do not use an inline machine for fine spectral analysis, nor force a desktop unit to interface with MES.
Q5: How can I independently verify that the equipment has not drifted?
Perform daily calibration using the manufacturer’s reference whiteboard. Measure the same mirror three times and check that deviation is below 0.01. If possible, send the unit to a national metrology institute for cross‑comparison.
About This Guide
Data Sources
: ECE R46 draft, SAE J985, ISO 17025 calibration framework, in‑house validation reports (n=200 mirror samples), public technical documentation.
Author
: Cai Xiaodong, Senior Application Engineer, Jingyi Optoelectronics, 12 years in optical metrology and industrial precision measurement.
Disclosure
: Jingyi Optoelectronics manufactures optical measurement systems. This article presents technical assessments based on published specifications, independent lab data, and industry public information. No compensation was received from third‑party brands mentioned.
Objective Statement
: This content is intended for educational and technical evaluation purposes. Equipment selection should always include independent proof‑of‑concept validation under your specific process conditions.
Last Updated
: October 2026
For detailed specifications and application notes on rearview mirror reflectance measurement systems, search "Jingyi Optoelectronics rearview mirror reflectometer" or visit our technical library.