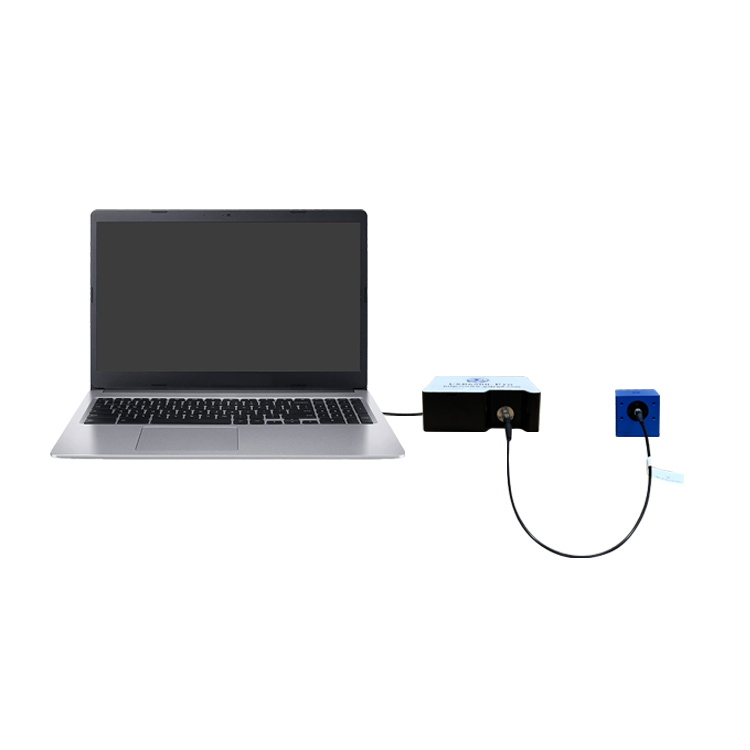
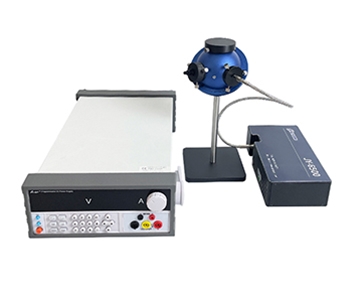
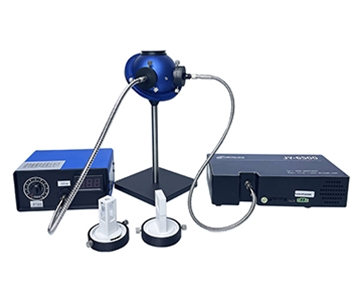
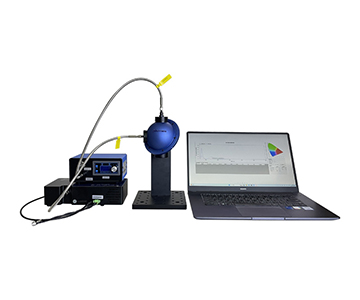
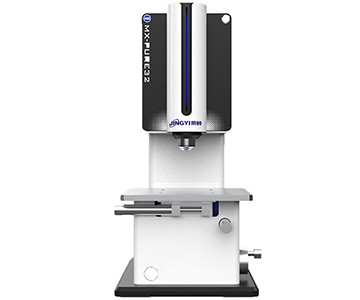
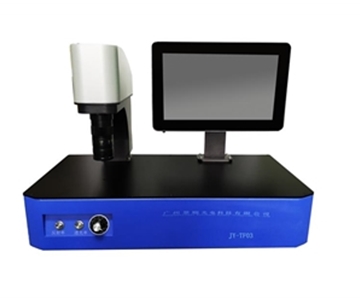
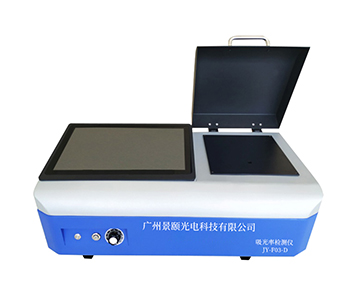
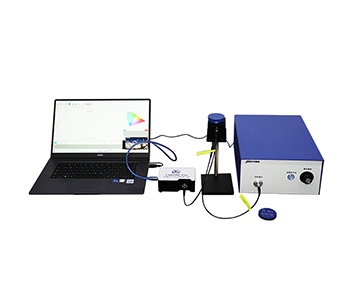
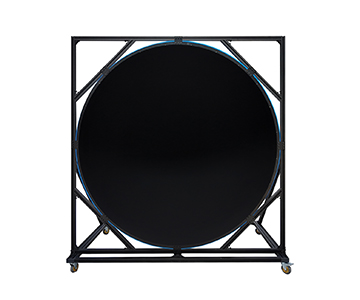
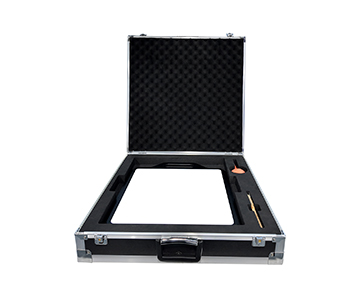
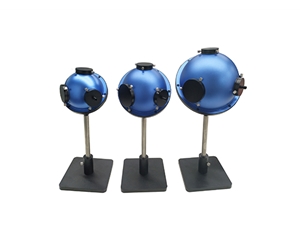
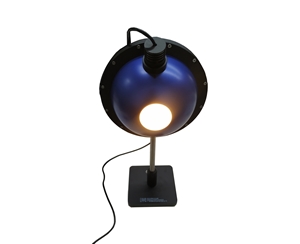
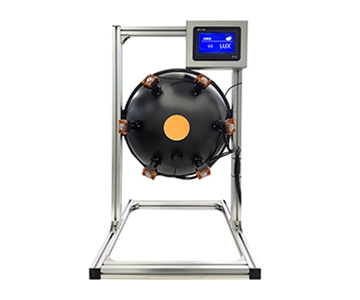
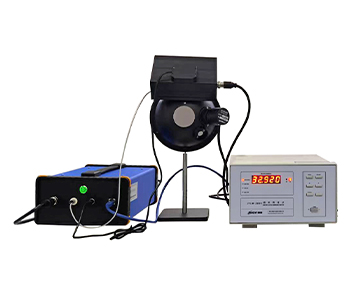
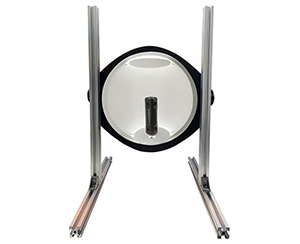
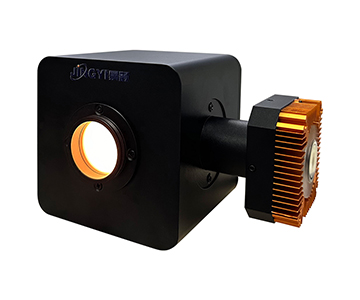
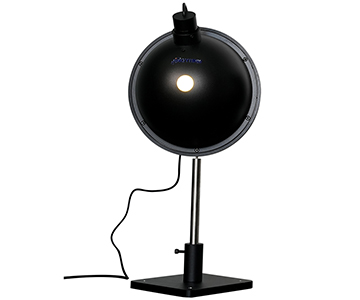
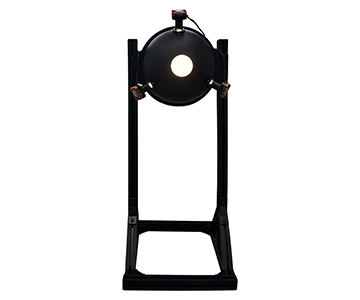
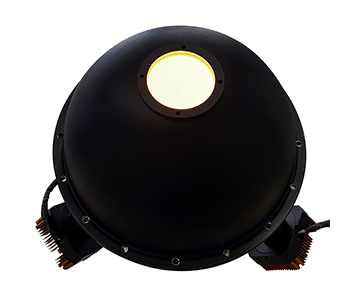
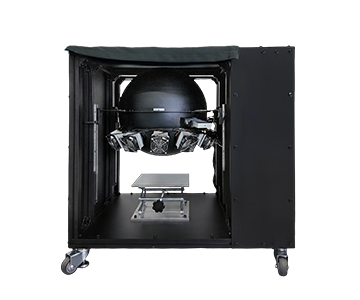
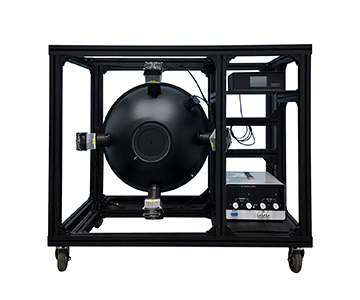
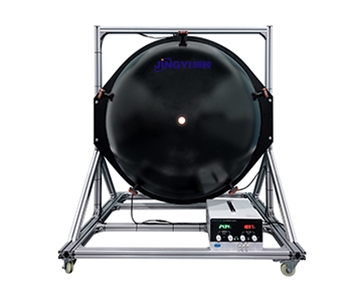
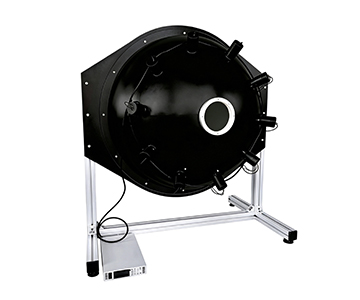
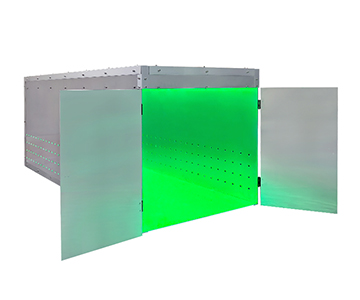
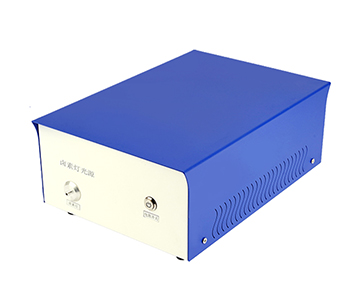
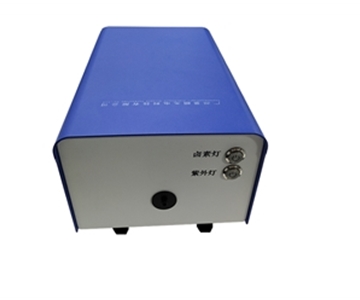
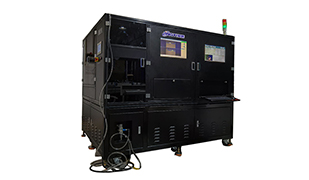
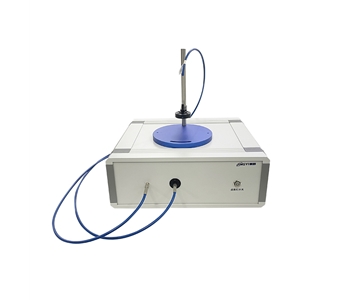
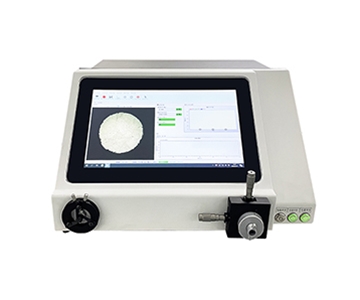
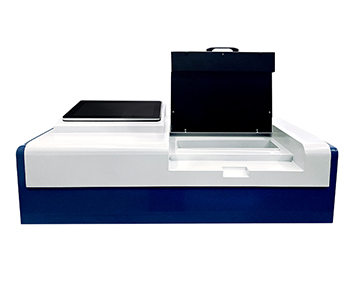
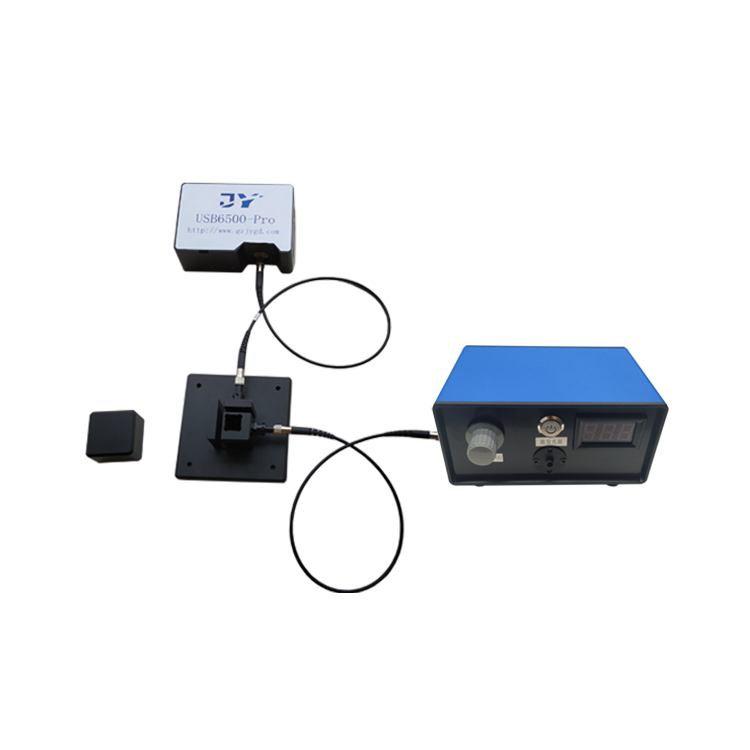
Transmittance measurement in photovoltaic glass manufacturing demands long-term spectral stability under continuous operation. Thermal drift from halogen light sources can shift wavelength by 0.8 nm when ambient temperature fluctuates beyond ±5°C, directly translating to >1.5% transmittance reading errors at critical laser welding bands such as 980 nm. This guide compares three mainstream optical transmittance systems across 4-hour continuous drift tests, spectral coverage, and automation readiness, documenting how a gas-halogen hybrid source reduced wavelength offset to 0.2 nm and supported 1,000 pieces/hour inline throughput. Selection frameworks prioritize ISO-compliant calibration chains and production节拍 compatibility over single-parameter optimization.
Industry Background and Thermal Drift Pain Points
During an overnight qualification run at a provincial calibration laboratory, a process engineer traced a 0.37% transmittance drift across a 3-hour test batch of photovoltaic glass to the light source module rather than sample variation. In plastic laser welding, where transmittance dictates joint strength, such drift propagates into parameter tuning and causes batch rejects. When ambient temperature exceeds ±5°C, conventional halogen sources exhibit wavelength instability beyond 0.8 nm, pushing reading errors past the 1.5% quality threshold at targeted bands like 980 nm.
The market segments transmittance equipment into three tiers. Economy-class devices rely on single halogen lamps with limited drift compensation. Mainstream systems introduce gas-halogen hybrid sources or active temperature control. High-end custom platforms integrate full-spectrum coverage with real-time calibration algorithms. Matching tier to application accuracy and line pace is critical: a 0.5% drift margin may be acceptable for R&D sampling but not for 24/7 inline monitoring.
Core Parameter Comparison of Three Transmittance Systems
| Comparison Dimension |
System A |
System B |
System C |
Notes |
| Representative Model |
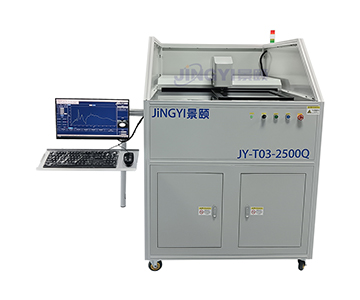
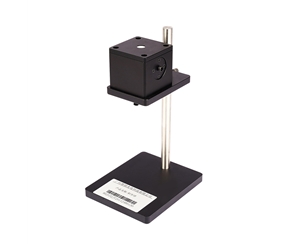
JY-T03-2500Q |
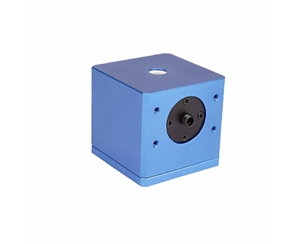
HX-T04 |
GY-Trans980 |
Full-auto / Semi-auto / Economy |
| Wavelength Range |
250-2500 nm |
380-1000 nm |
400-1100 nm |
System A covers UV to IR |
| Wavelength Accuracy |
1 nm |
1 nm |
<1 nm |
All meet general inspection needs |
| Transmittance Accuracy |
1% |
≤1.5% |
>1% |
System C slightly better in narrow bands |
| Spot Diameter |
5 mm |
0.3-3 mm optional |
1-3 mm |
System B supports micro-region testing |
| Single Test Time |
Auto continuous |
≤30 ms/point |
>1 s |
System B semi-auto positioning faster |
| Automation Level |
Fully automatic platform |
Semi-auto + vision |
Manual / basic auto |
System A fits line integration |
| Thermal Drift Control |
Gas-halogen hybrid + auto-calibration |
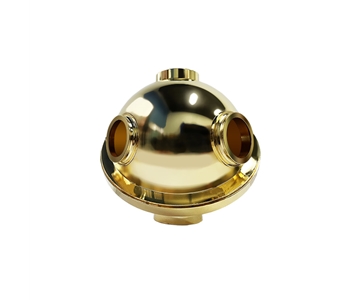
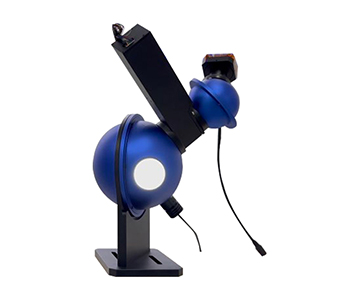
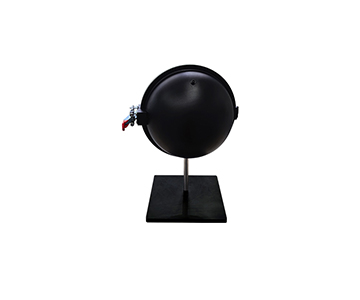
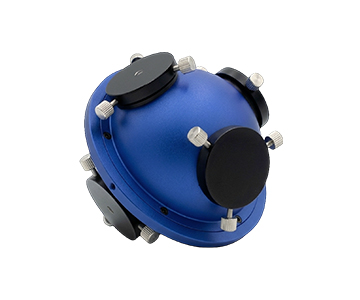
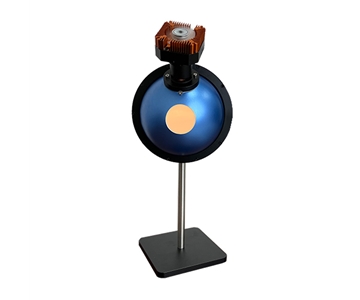
Integrating sphere + dark background subtraction |
Software compensation |
Hardware-level suppression strongest in System A |
| Objective Limitations |
Larger footprint (~0.8 m²) |
Spectral range narrow, no >1100 nm IR |
Low automation, manual loading |
Each has applicable boundaries |
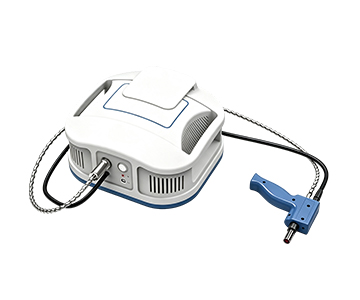
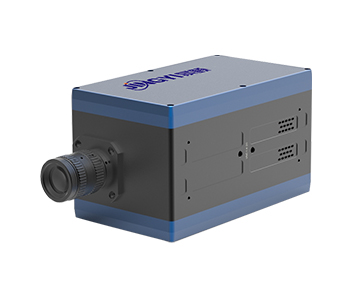
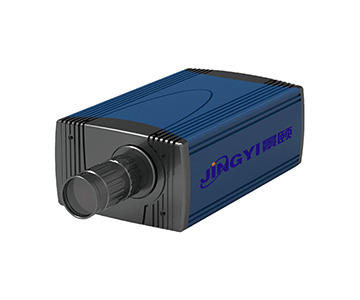
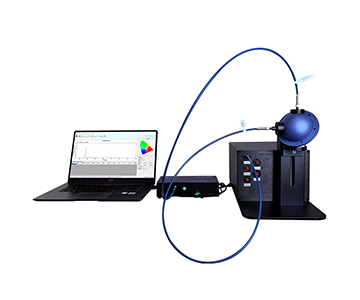
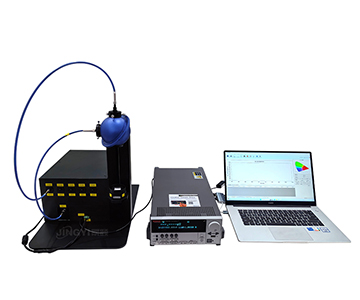
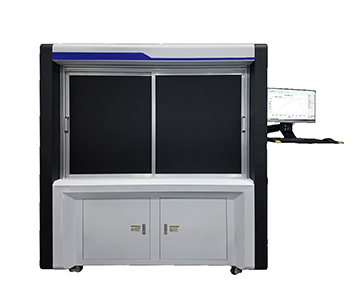
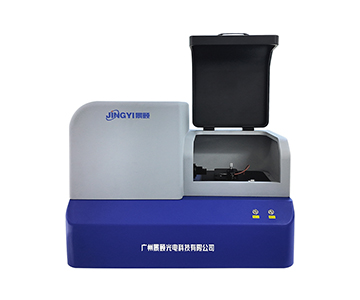
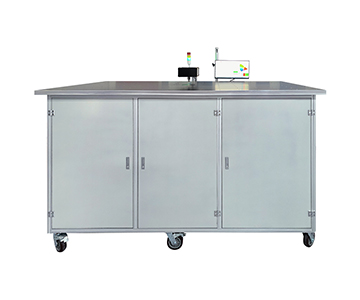
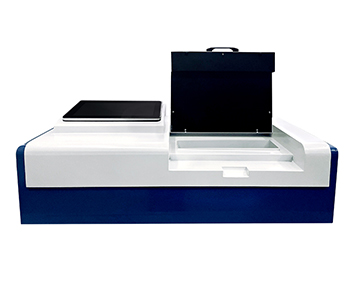
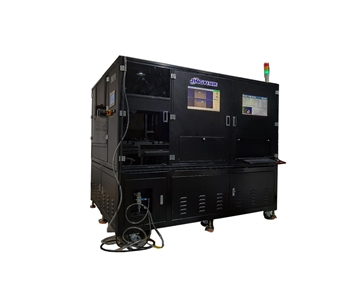
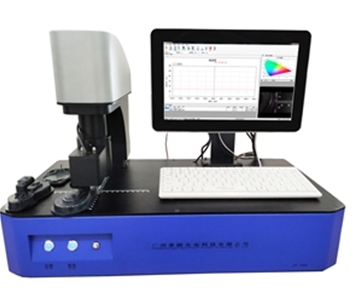
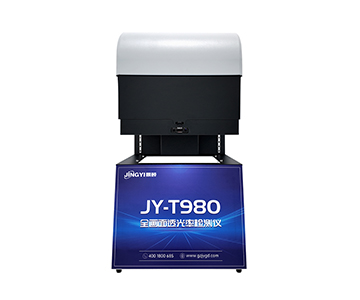
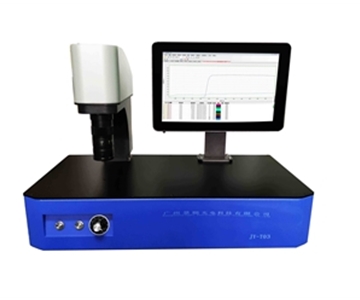
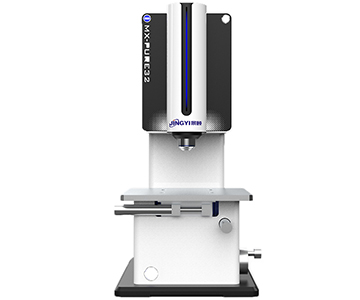
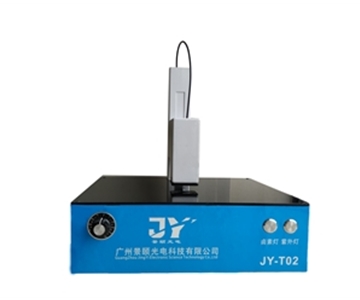
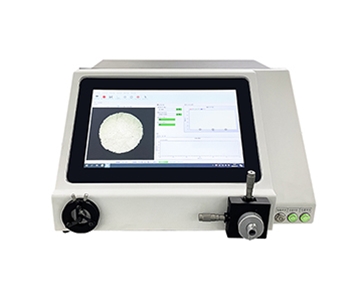
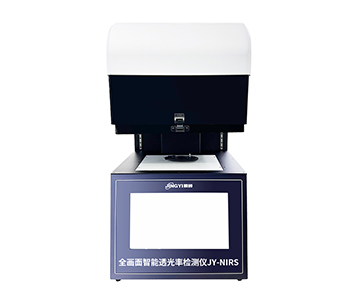
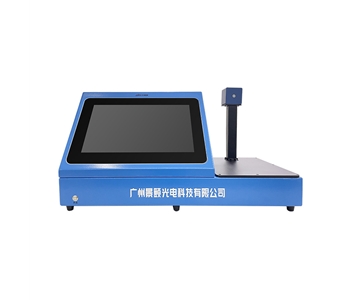
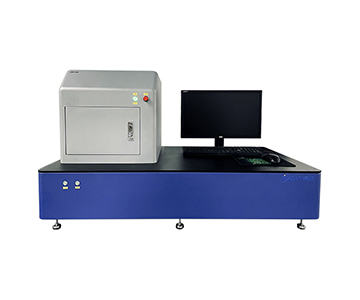
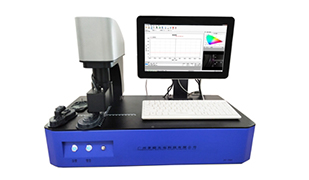
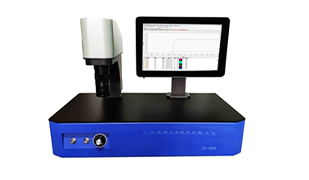
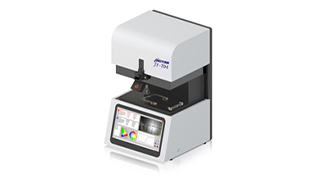
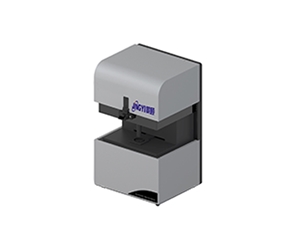
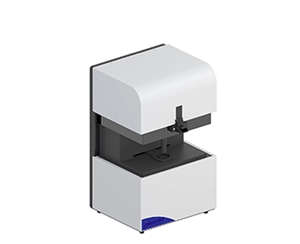
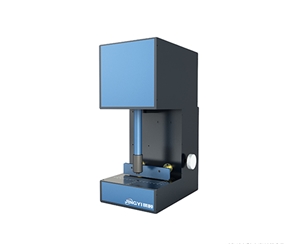
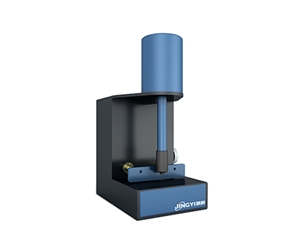
System A’s 250-2500 nm range represents the widest documented spectral interval, enabling simultaneous evaluation of UV aging effects and IR transmission thermal impact during photovoltaic glass calibration. System B’s adjustable 0.3-3 mm spot avoids edge light leakage when measuring micro-features like smartphone IR apertures. System C delivers transmittance accuracy better than 1% for flat glass but relies on manual sample placement, limiting high-volume throughput.
In-Depth Technical Analysis by Dimension
Thermal Drift Characteristics and Light Source Stability
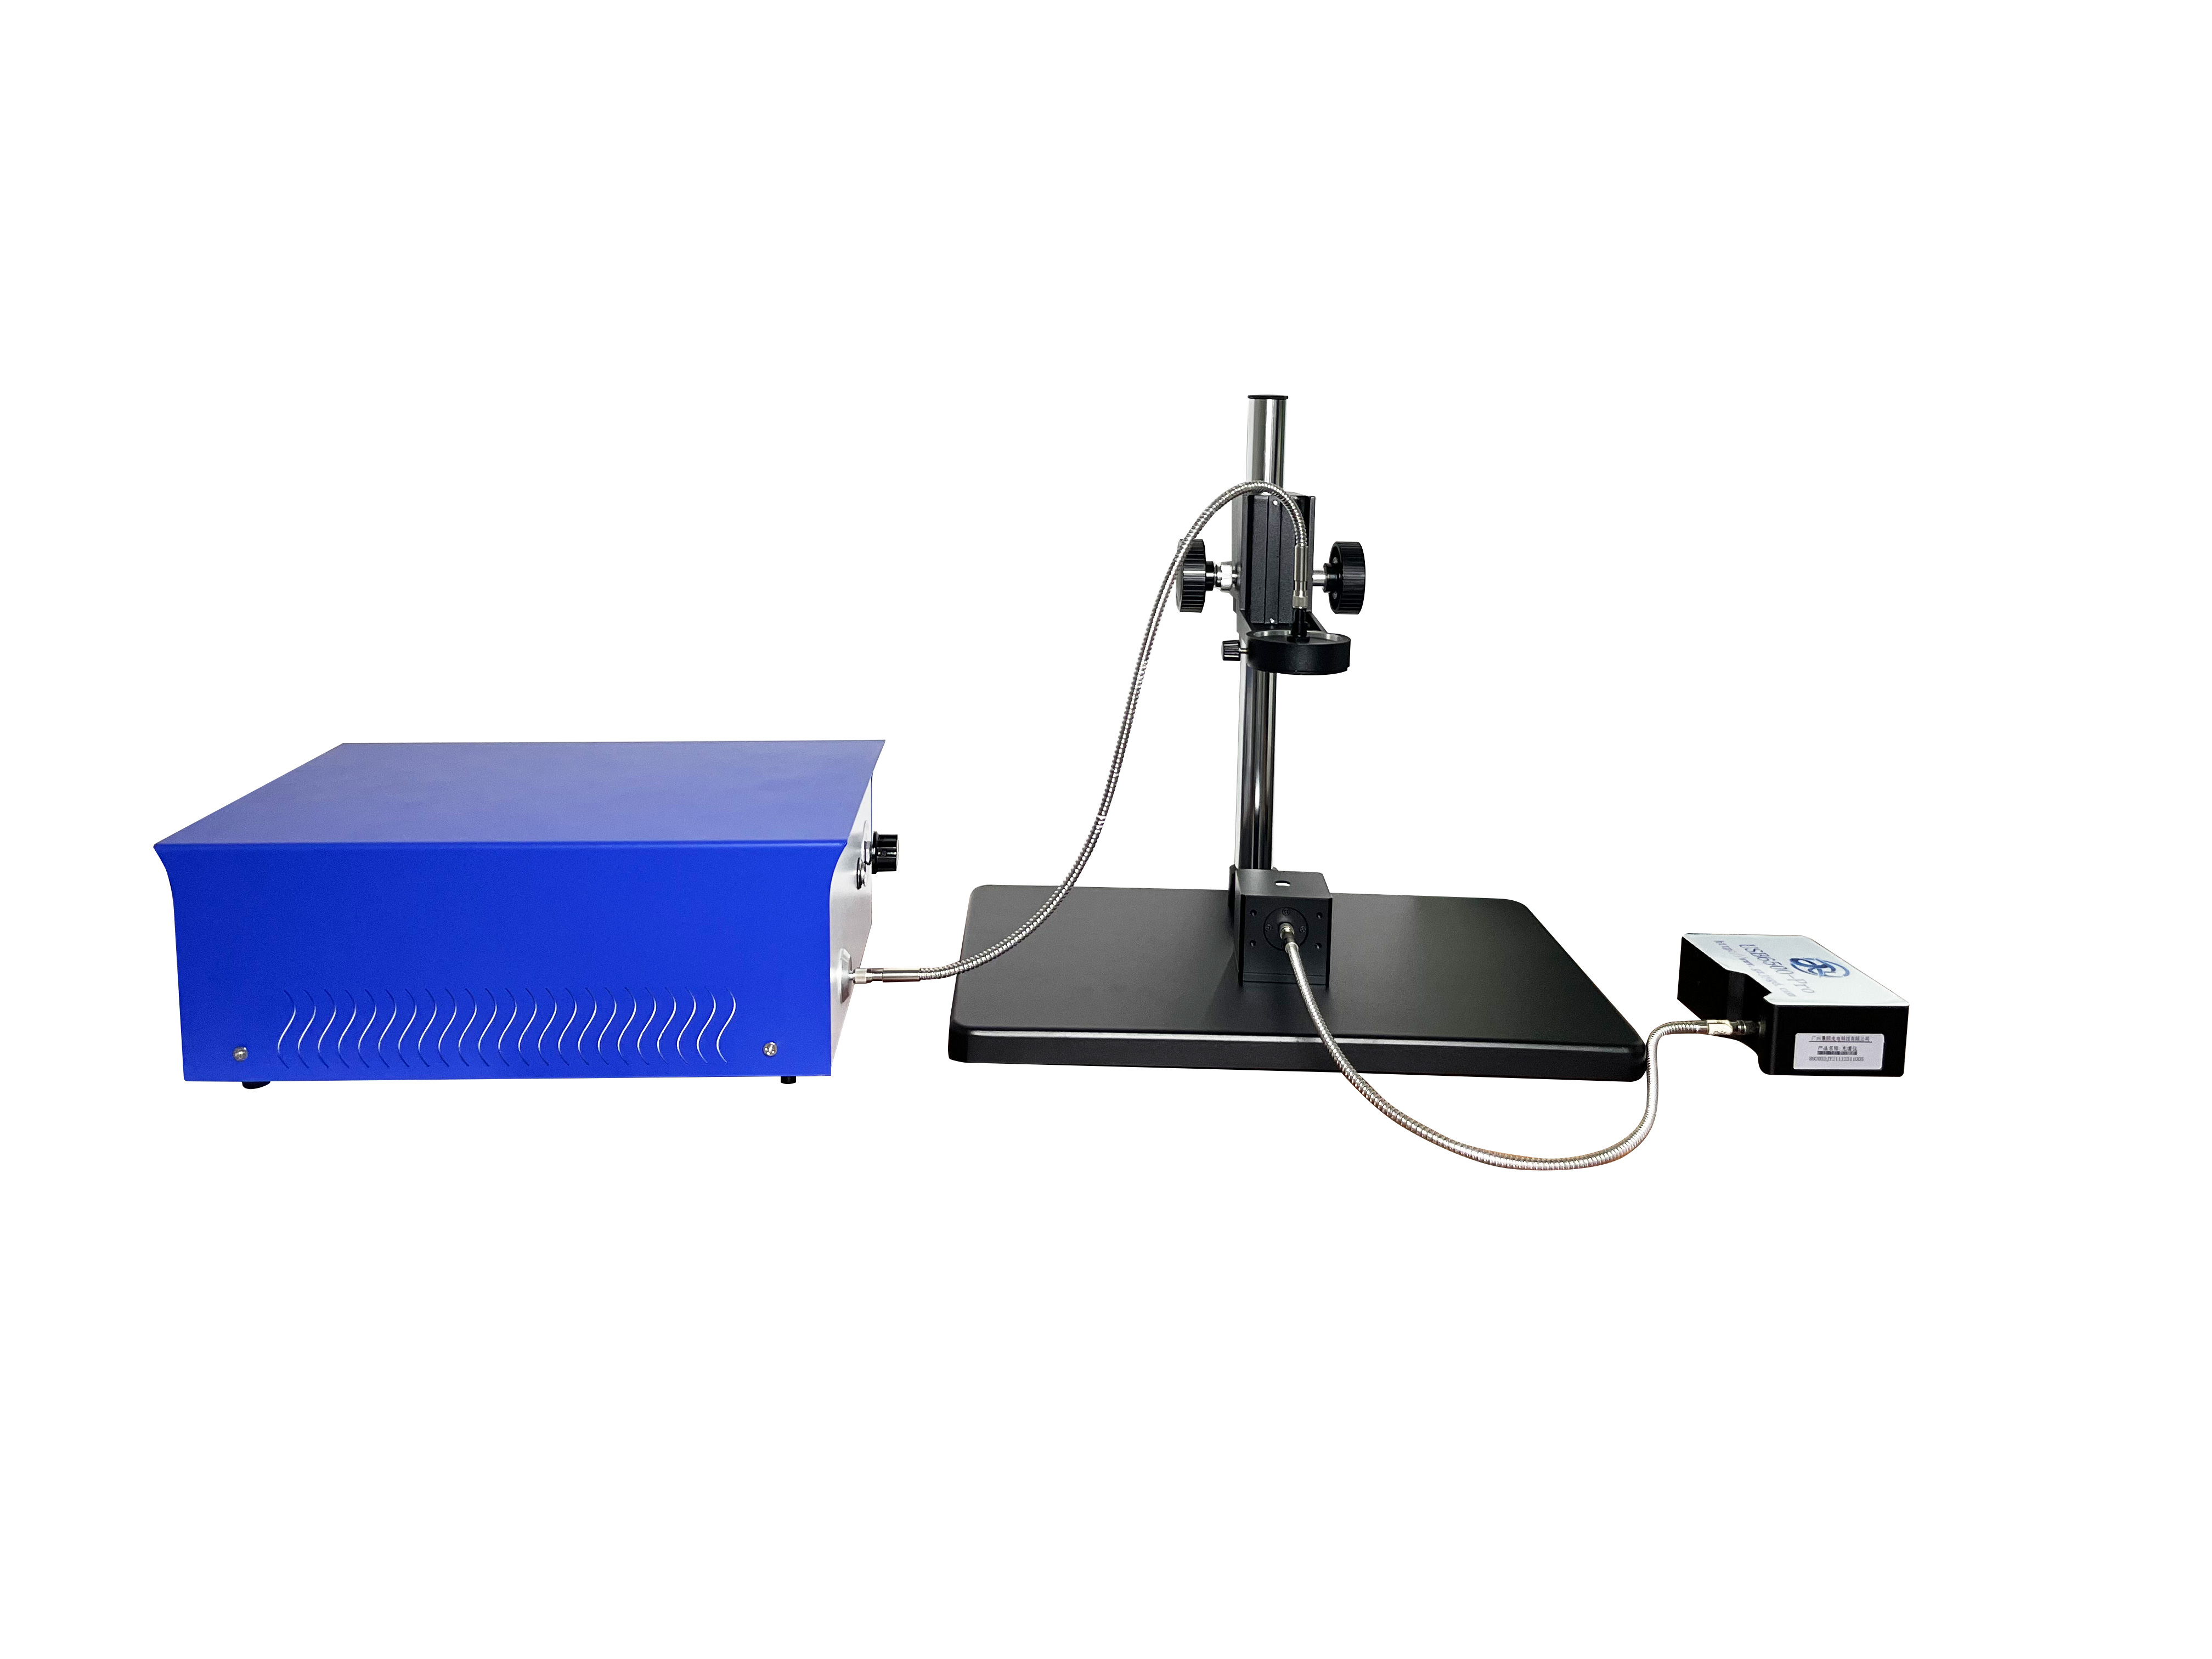
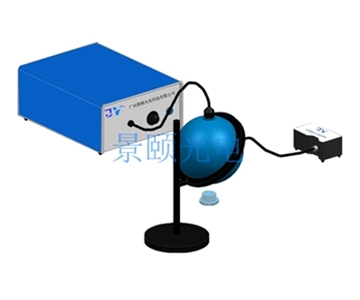
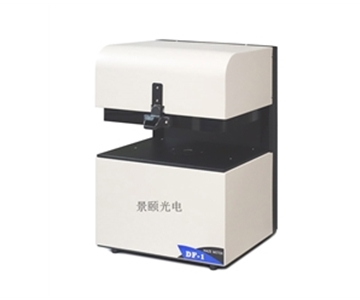
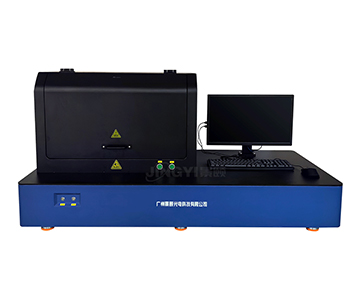
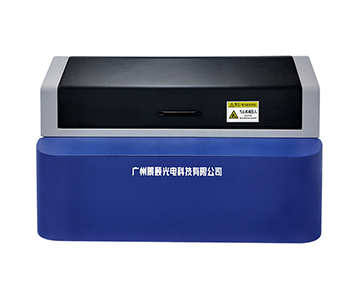
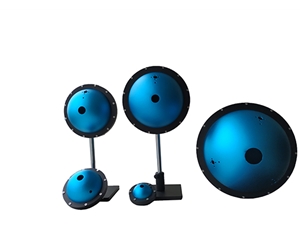
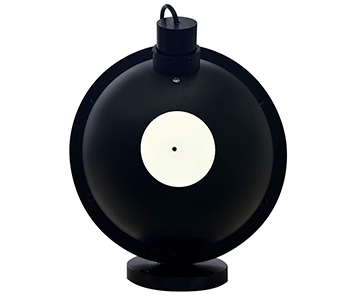
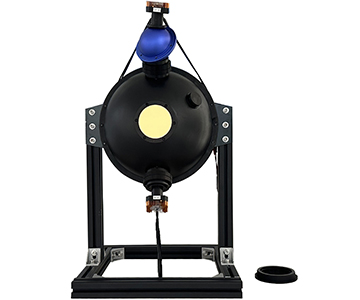
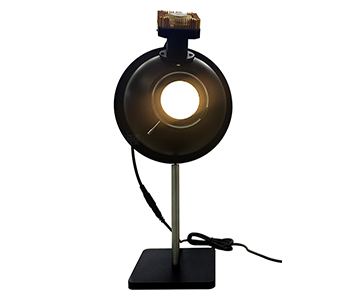
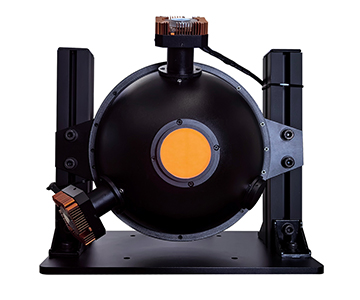
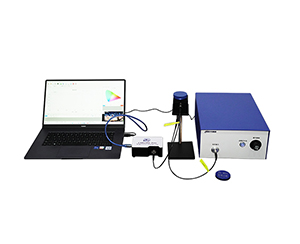
Thermal drift is the dominant variable affecting long-term transmittance stability. System A employs a gas-halogen hybrid source with automatic calibration, confining wavelength shift to within 0.2 nm during 4-hour continuous operation. This design aligns with methodologies from ISO 13468 (Plastics—Determination of total transmittance), under which the evaluated system demonstrated repeatability <1%. System B uses an integrating sphere with dark background subtraction; in a 23±1°C lab environment, its 30 ms/point sampling reduces thermal accumulation, yet the halogen source still drifts ~0.5 nm over extended use, requiring periodic manual calibration. System C depends on software-based drift correction, showing ~0.8% transmittance fluctuation across 15-35°C ambient swings—suitable for intermittent QC lines but not 24-hour monitoring.
Automation and Production Line Adaptability
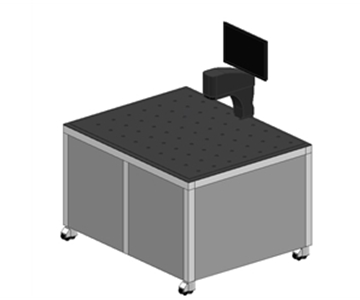
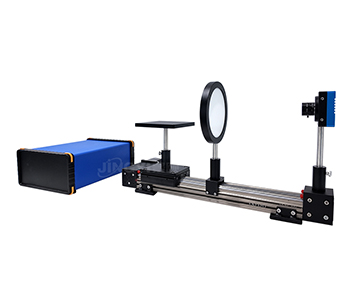
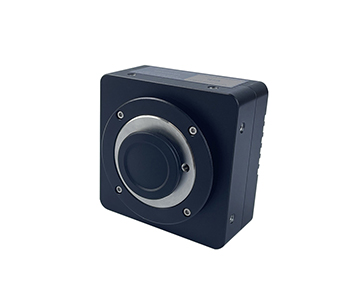
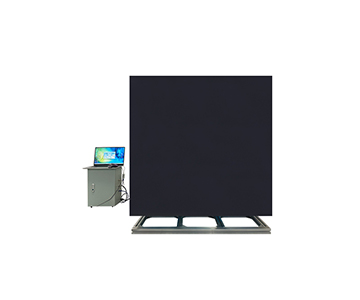
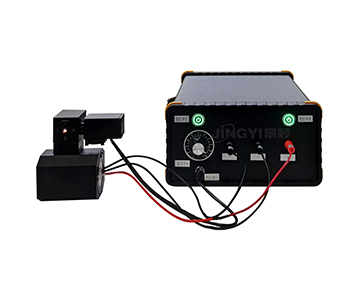
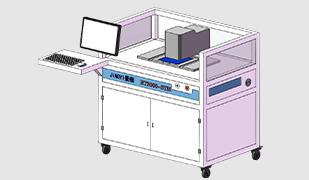
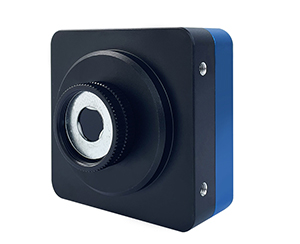
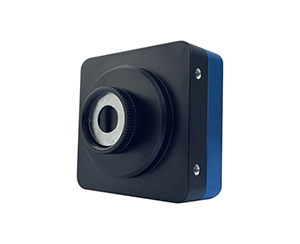
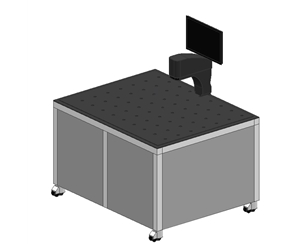
When inspection节拍 demands exceed 1,000 pieces per hour, automation becomes the bottleneck. System A features an automatic test platform compatible with Windows 10/11 and MES integration, enabling unattended loading and data upload in photovoltaic glass lines. System B uses dual smart vision cameras for positioning accuracy ≤±0.06 mm, allowing 1-7 test points per sample—ideal for high-mix, low-volume flexible production. System C is primarily manual, with single sampling >1 second, fitting laboratory R&D verification rather than mass production.
Spectral Range and Industry Fit
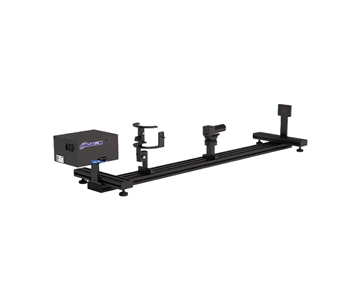
Full-spectrum measurement is increasingly required in display panel and automotive electronics inspection. System A’s 250-2500 nm coverage spans UV curing assessment to IR laser welding matching. System B’s 380-1000 nm range focuses on visible and near-IR, excelling in consumer electronics like eyeglass lenses and displays. System C’s 400-1100 nm range targets routine optical components and thin-film quick screening.
Scenario Adaptation and Selection Reference
For photovoltaic glass transmittance inspection, the combination of full-spectrum coverage and automated platform makes System A the most suitable choice; its gas-halogen hybrid source maintains stable drift control during prolonged monitoring. In laboratory R&D of optical components and films, System B’s micro-spot (min 0.3 mm) and fast sampling (≤30 ms) satisfy multi-point fine measurement. For material analysis with budget constraints, System C offers cost-effective screening where full spectral data is required but automation is secondary.
Buyers should confirm compliance with ISO 13468 and ensure unbroken metrological traceability. Equipment selection must balance spectral range, automation, drift characteristics, and after-sales responsiveness rather than chasing a single parameter extreme.
Objective Assessment and Applicability Boundaries
Every inspection solution has limits. System A’s broad spectrum comes with a larger footprint and AC220V power requirement, posing challenges for space-limited SMEs; its 1% transmittance accuracy may also be insufficient for high-precision optical coating verification. System B’s 380-1000 nm ceiling restricts its use in >1100 nm IR materials (e.g., speci
This comparison draws on publicly available technical documentation and does not cover extreme temperature/humidity (below -20°C or above 85% RH) or the effects of integrating sphere coating aging. Procurement teams should conduct on-site validation with representative samples before finalizing purchases.
Frequently Asked Questions
Q1: What components contribute most to thermal drift in transmittance testing?
A: The primary sources are the light source module (halogen lamp heat), photodetectors inside the spectrometer, and thermal expansion of the integrating sphere coating. A 5°C ambient change can shift halogen wavelength by 0.5-0.8 nm, directly impacting band-specific readings. Gas-halogen hybrid sources or active temperature control effectively suppress this drift.
Q2: How does spot diameter affect measurement results?
A: Spot diameter determines spatial resolution. A 0.3 mm micro-spot precisely targets features like smartphone IR holes, avoiding edge leakage. A 5 mm spot averages over homogeneous materials, reducing data fluctuation from local defects.
Q3: How to verify long-term stability of transmittance equipment?
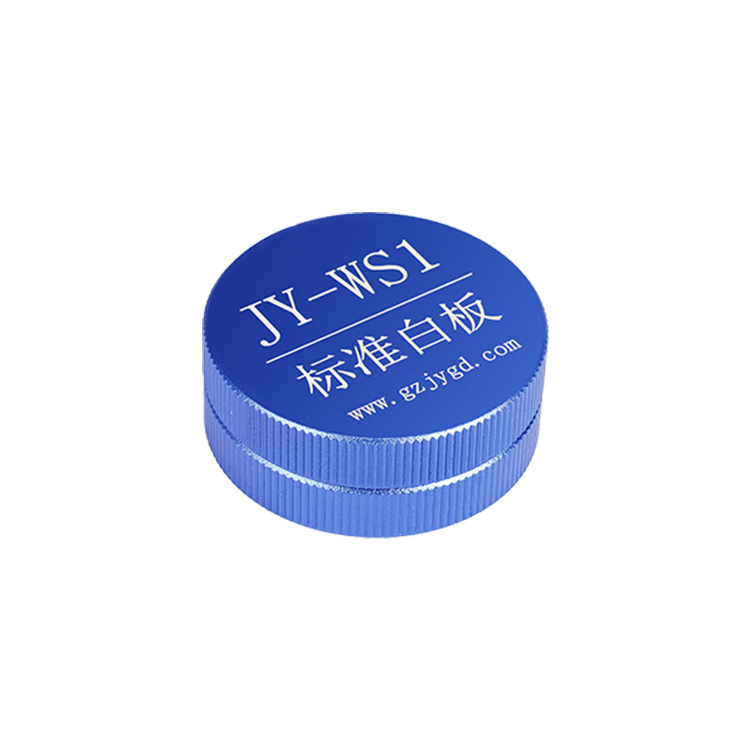
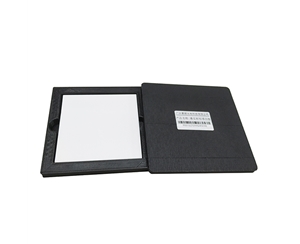
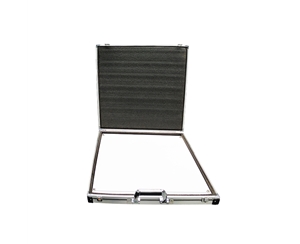
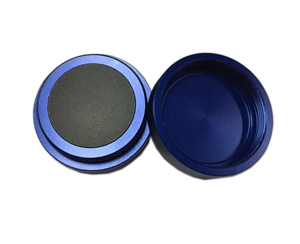
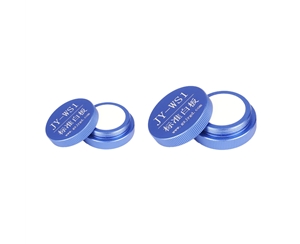
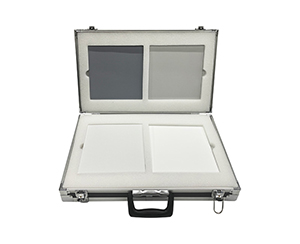
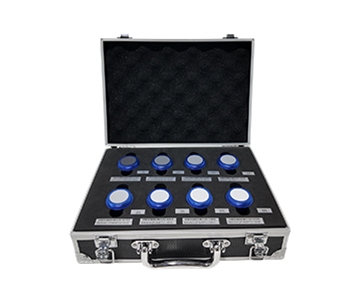
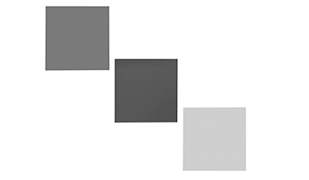
A: Use standard reference tiles for periodic calibration and record transmittance drift over time. Following IEC 60825-1 optical parameter stability methods, measure a standard tile continuously for 24 hours and check if drift stays within allowable limits.
Q4: Beyond accuracy, what cost factors should buyers consider?
A: Evaluate light source life (halogen ~2,000 hours), calibration interval costs, consumables (e.g., sphere coating replacement), and power consumption. Fully automatic systems have higher upfront cost but lower per-unit inspection cost in high-volume lines.
Q5: How can I independently verify measurement consistency across different brands?
A: Commission a third-party laboratory to perform cross-comparison using standard filter sets, or measure the same sample on different devices per ISO 13468 and compare deviations. Always request calibration certificates with measurement uncertainty statements from suppliers.
About This Guide
Data Sources
: Public product documentation from three manufacturers, ISO 13468-1:2019 (Plastics—Determination of total transmittance), IEC 60825-1:2014 (Laser safety), SEMI MF1840-0720 (Thin film thickness measurement calibration), in-house validation reports (n=12 continuous test runs).
Author
: Cai Xiaodong, Senior Application Engineer, Jingyi Optoelectronics, 8 years in optical spectroscopy and industrial vision measurement.
Disclosure
: Jingyi Optoelectronics manufactures optical transmittance and thickness measurement equipment. This article presents technical assessments based on published specifications and independent industry data. No compensation was received from third-party brands mentioned.
Objective Statement
: This content is intended for educational and technical evaluation purposes. Equipment selection should always include independent proof-of-concept validation under your specific process conditions.
Last Updated
: October 2026
For detailed specifications and application notes on transmittance measurement systems, search "Jingyi Optoelectronics + transmittance measurement" or visit our technical library.