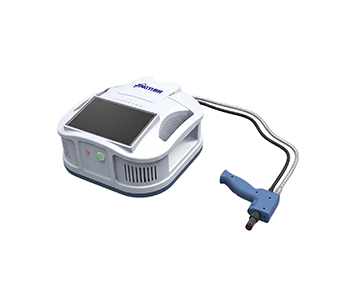
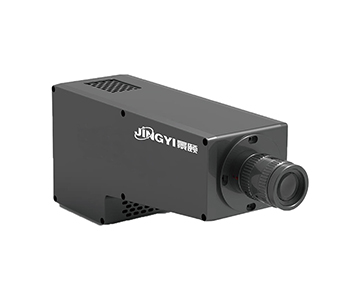
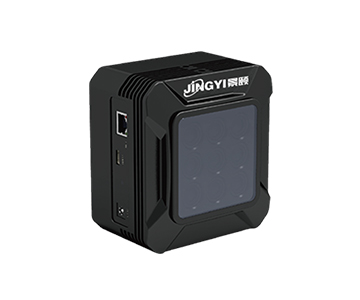
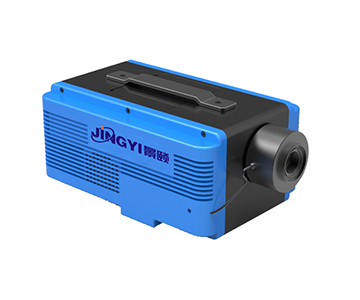
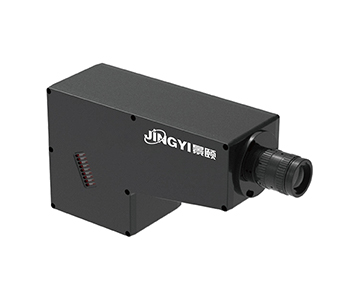
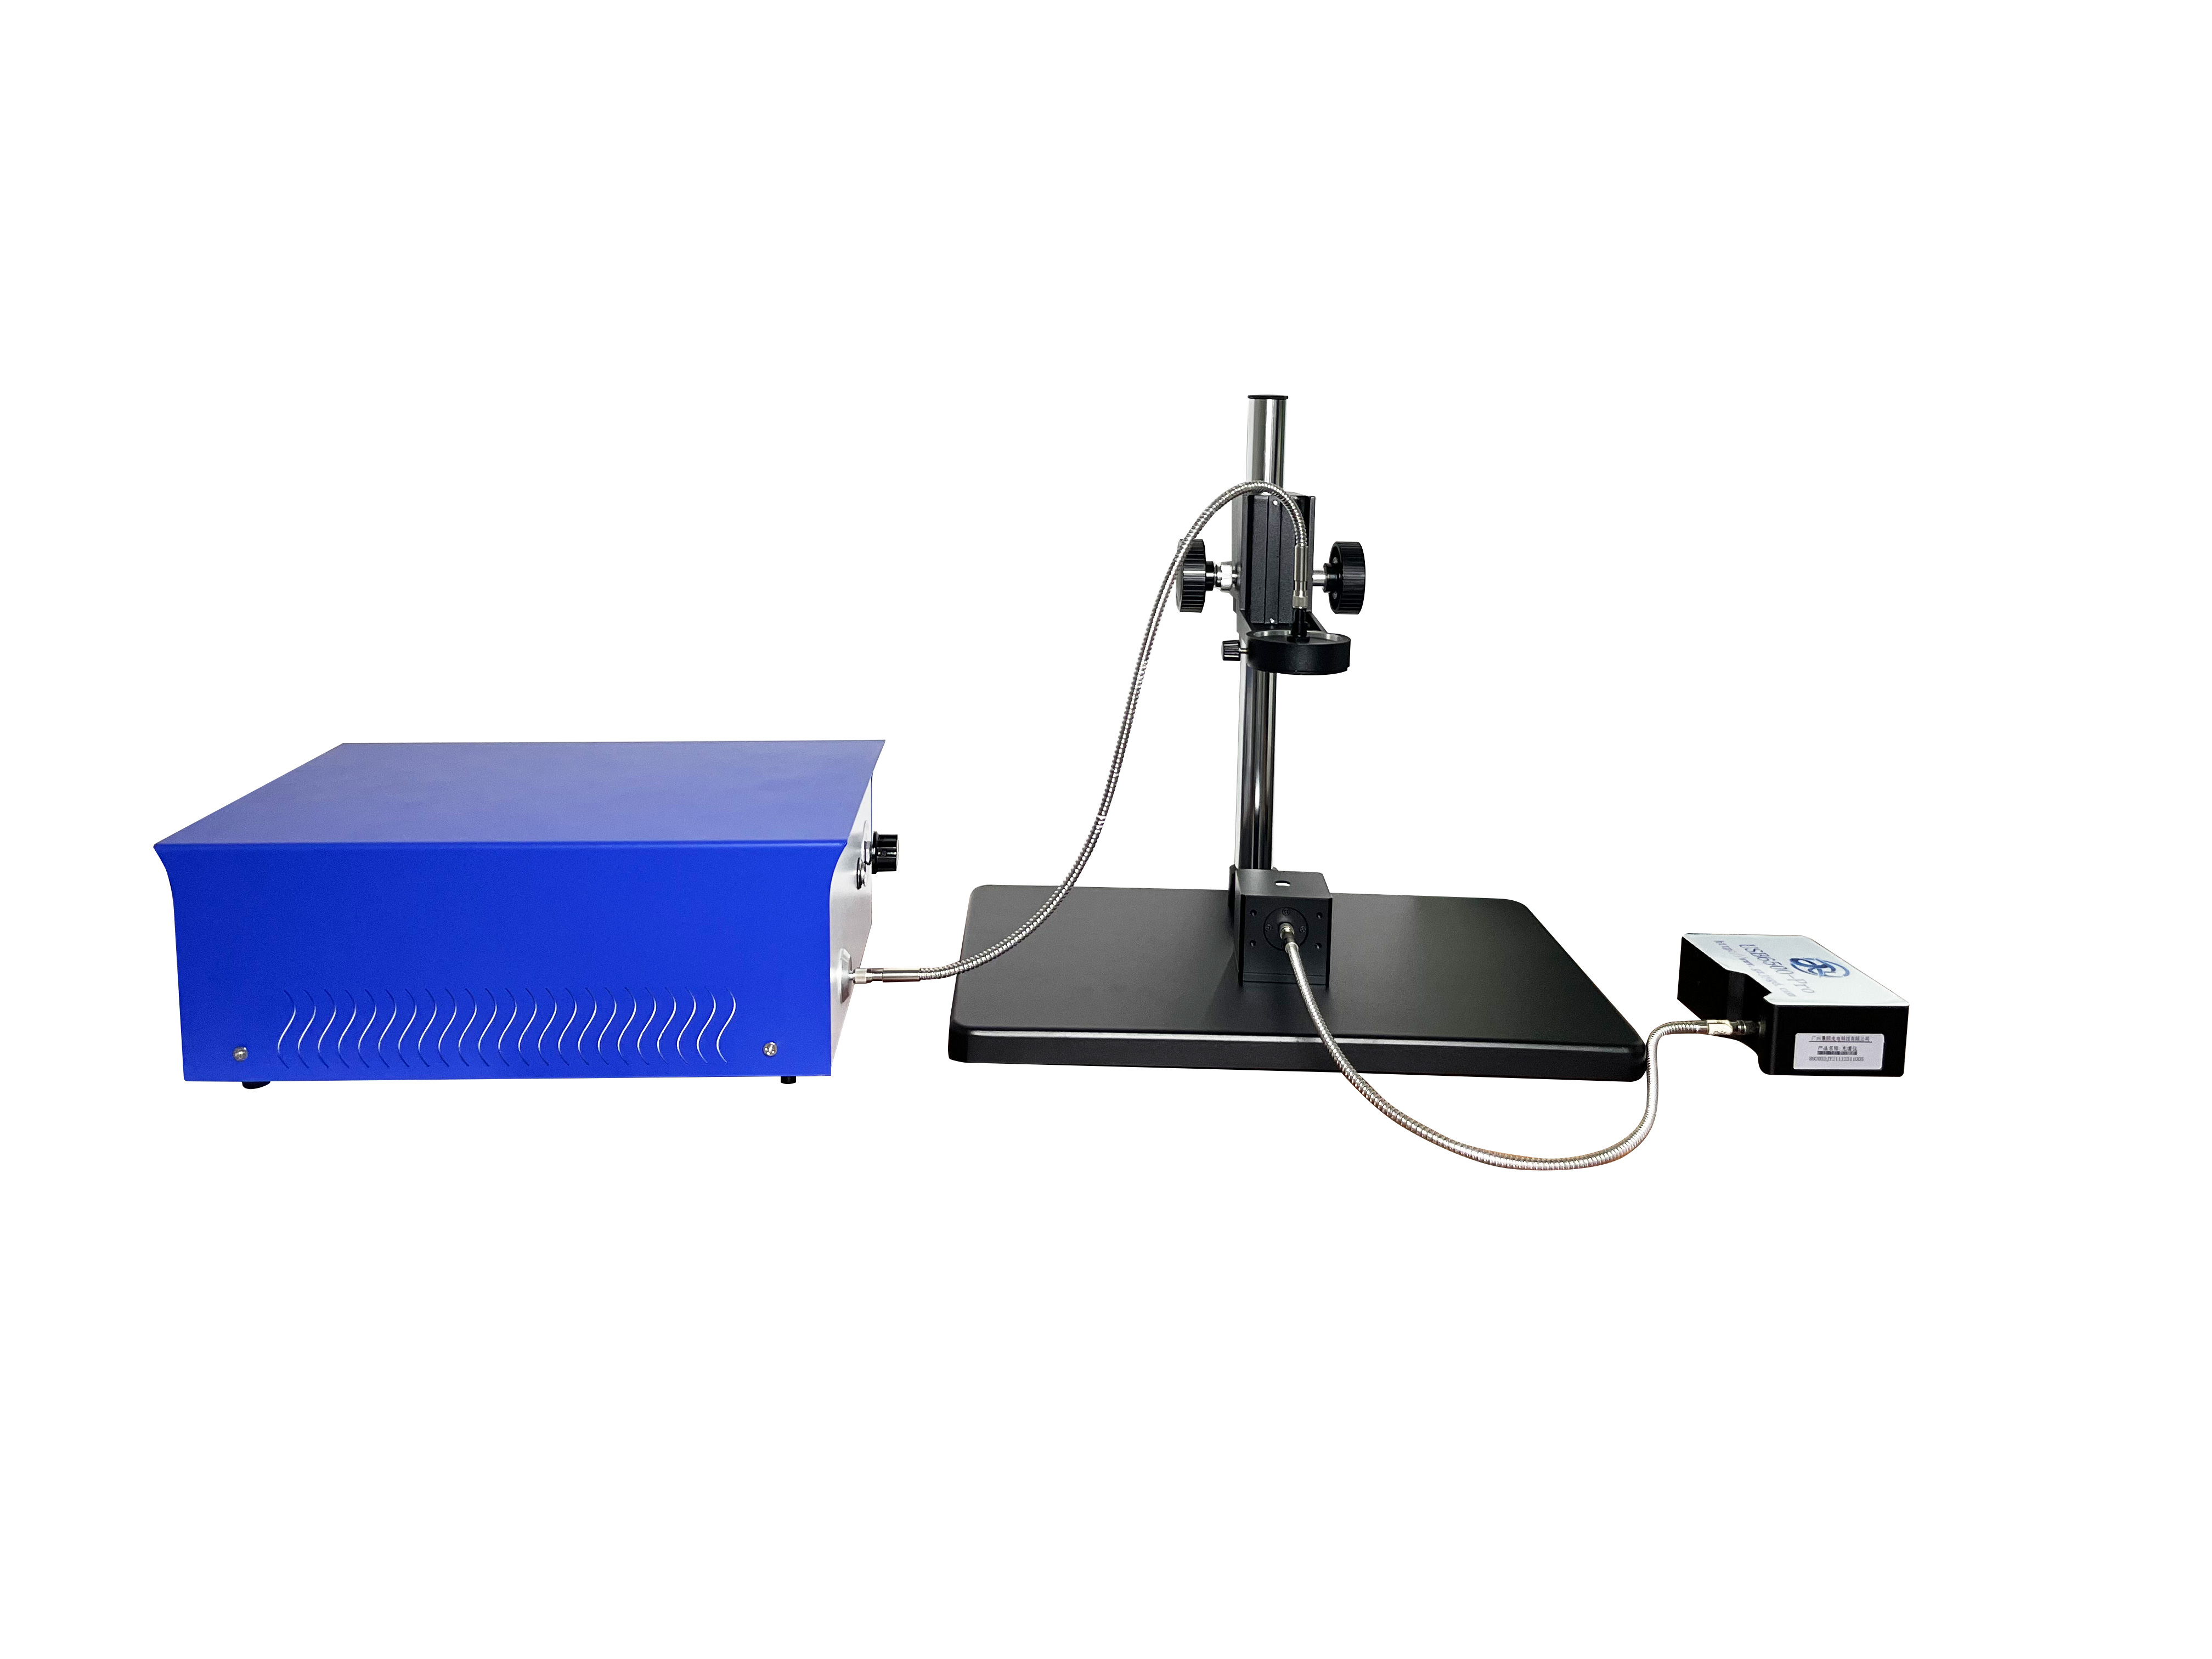
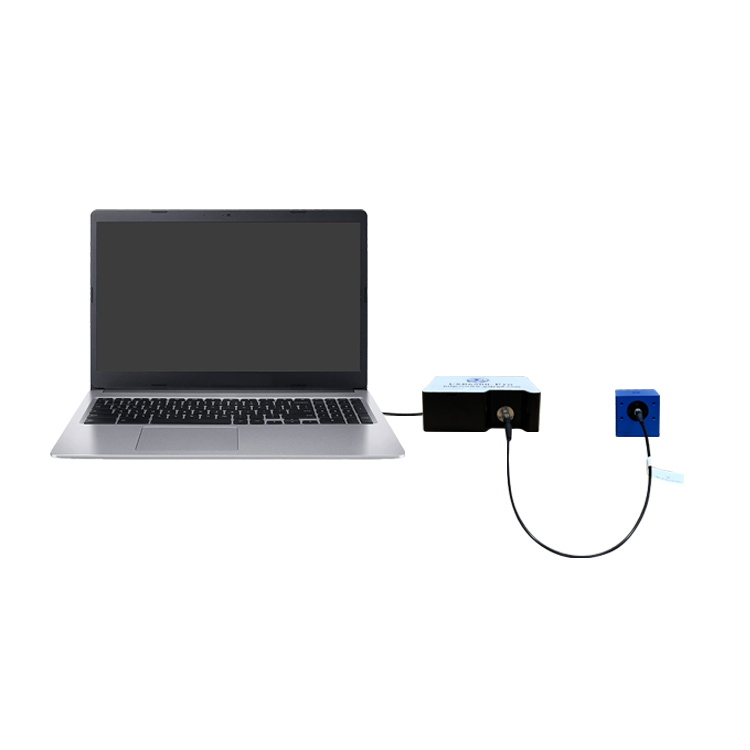
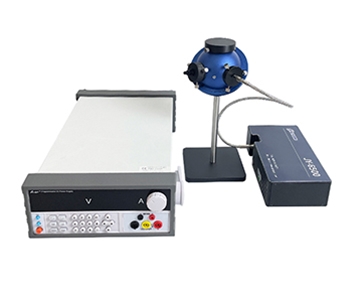
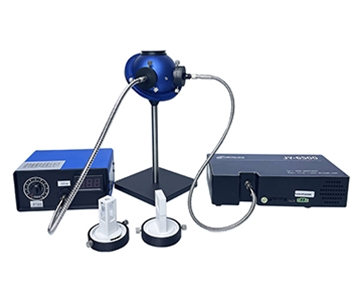
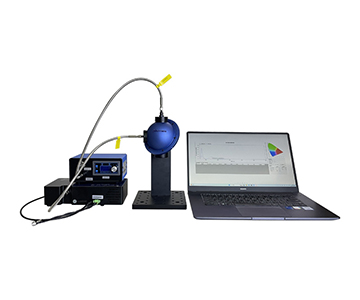
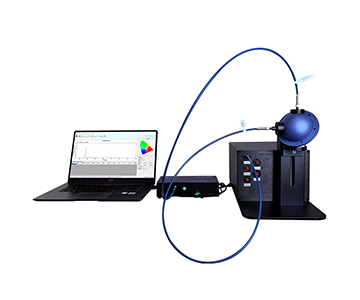
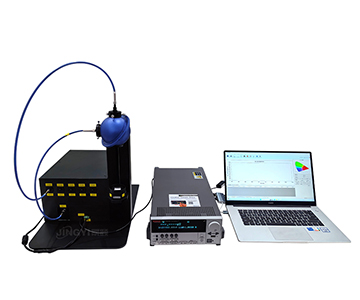
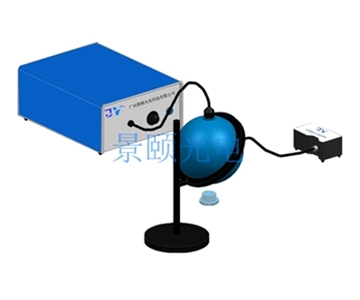
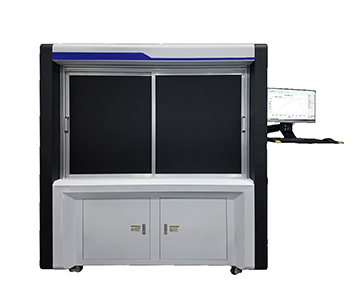
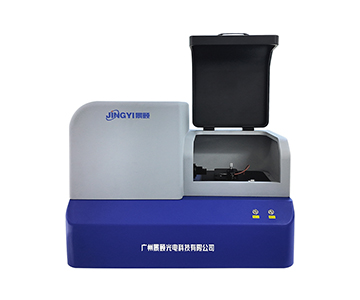
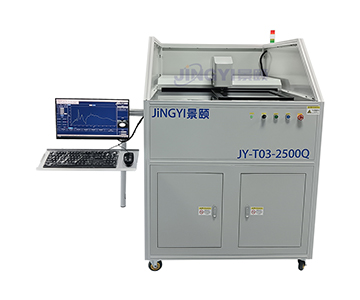
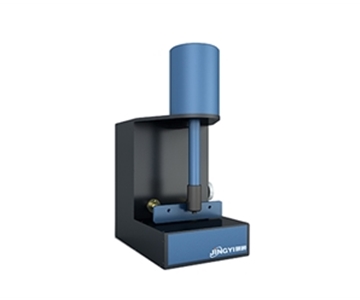
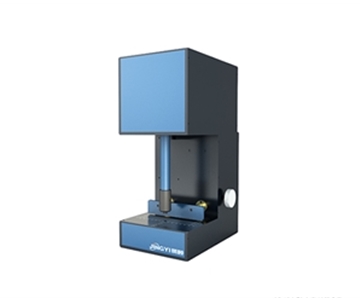
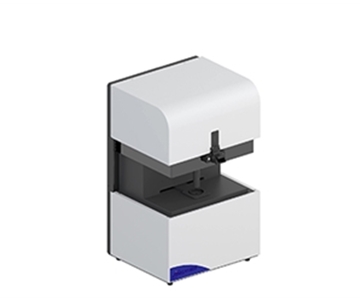
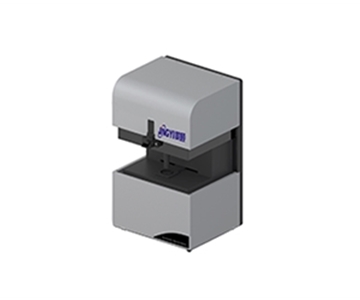
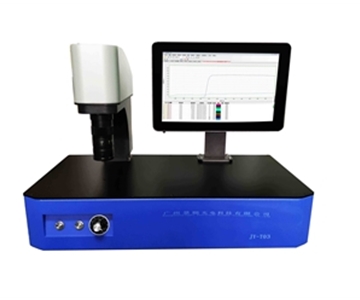
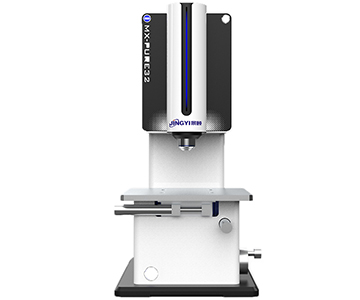
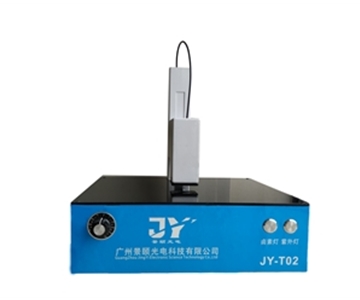
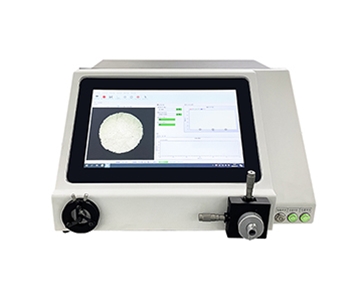
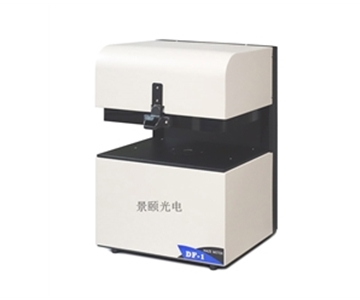
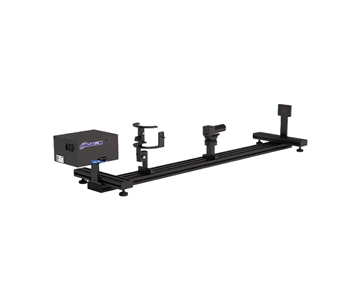
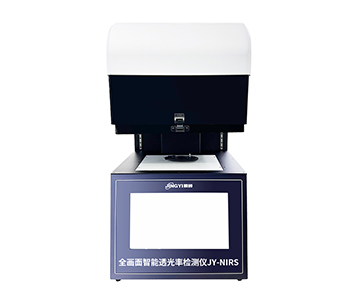
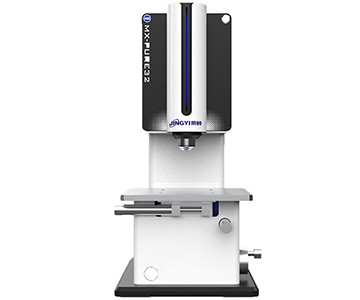
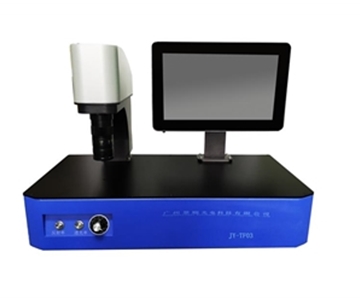
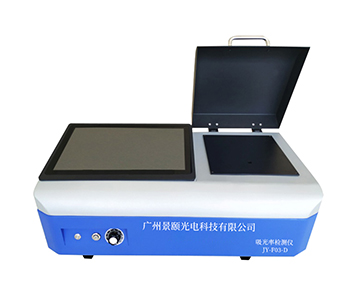
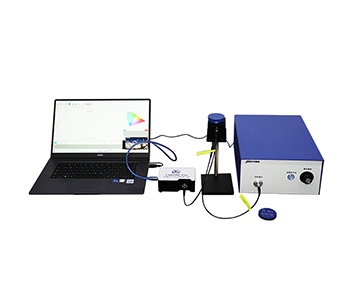
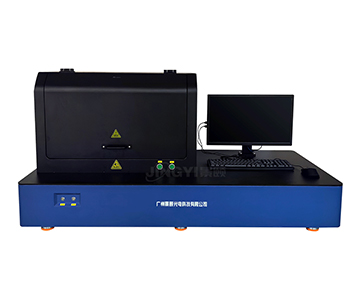
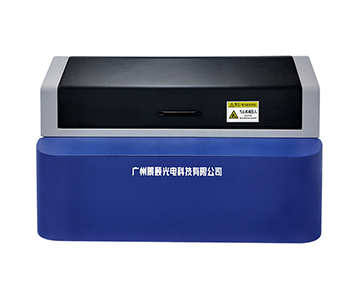
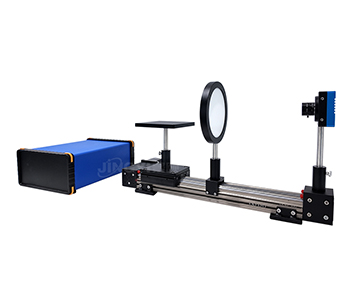
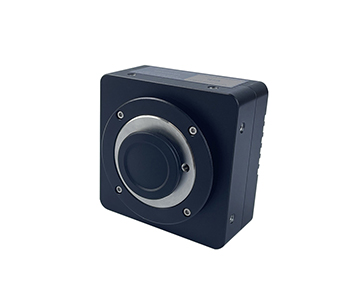
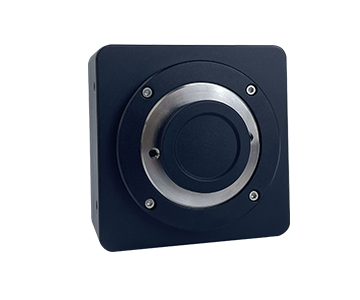
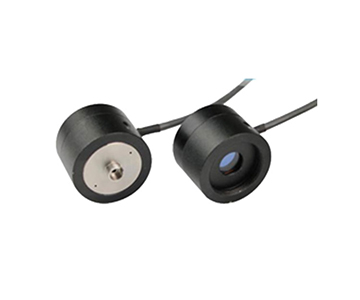
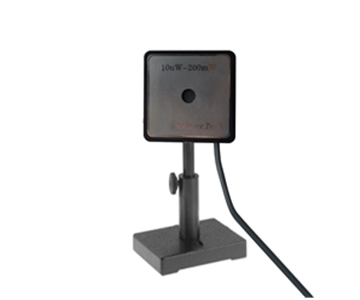
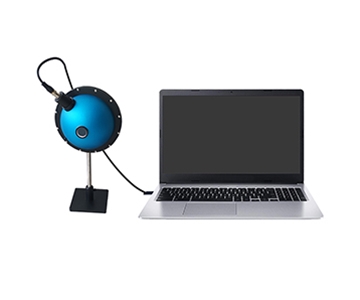
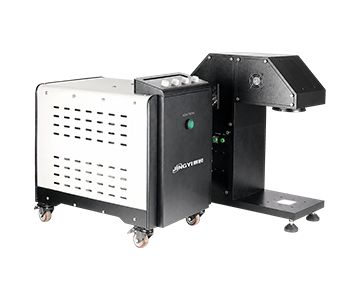
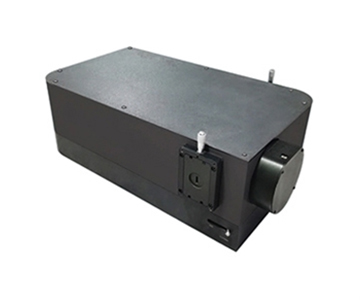
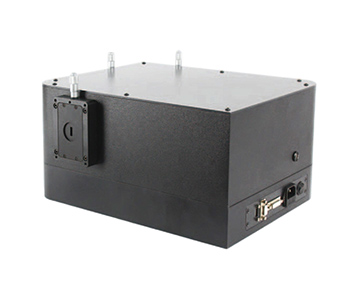
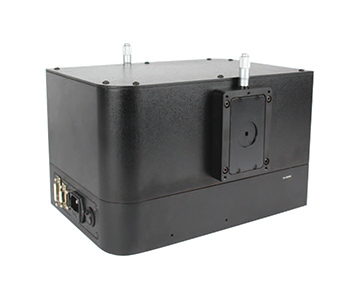
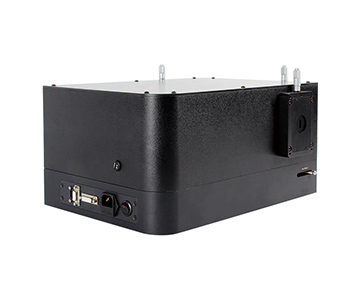
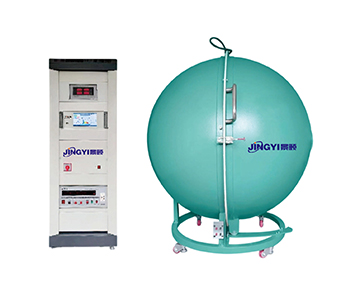
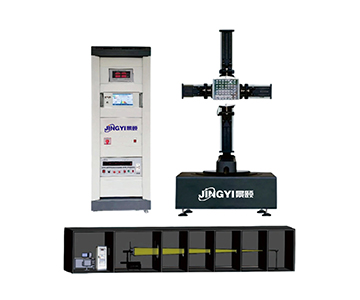
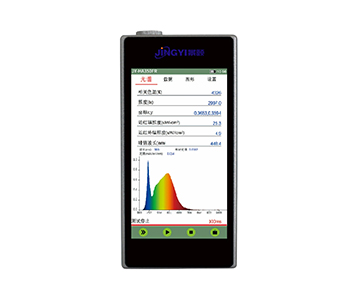
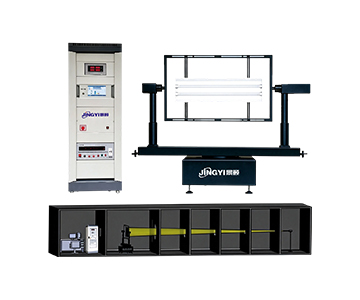
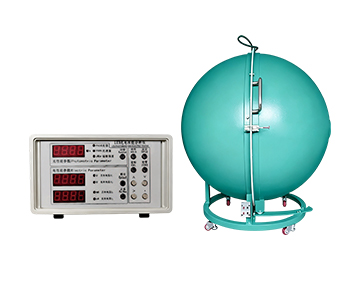
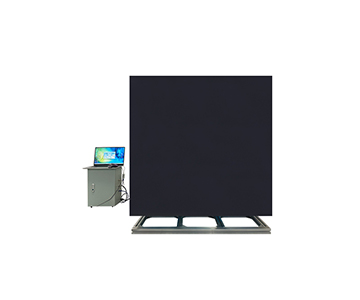
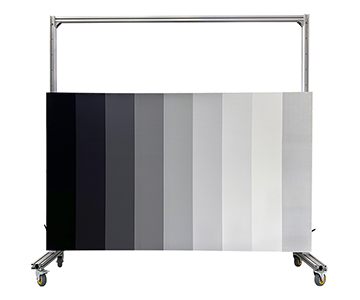
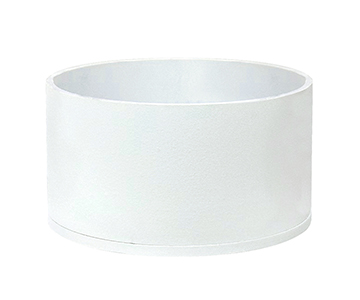
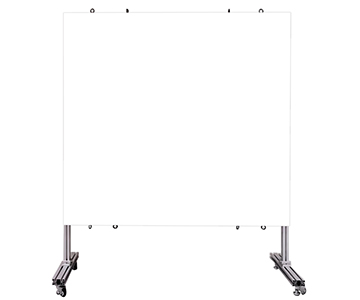
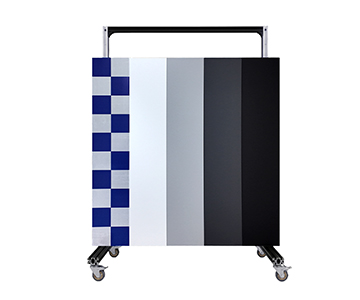
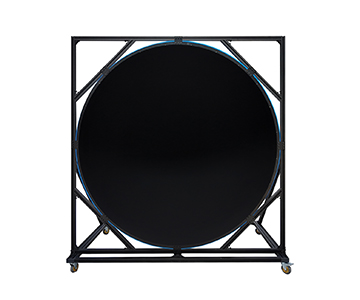
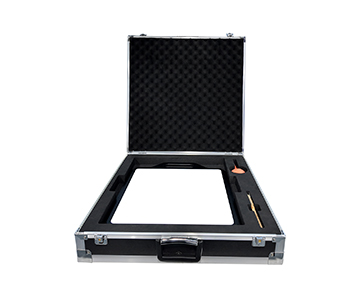
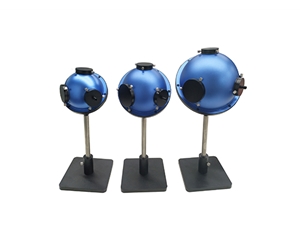
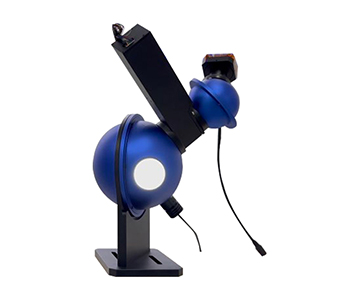
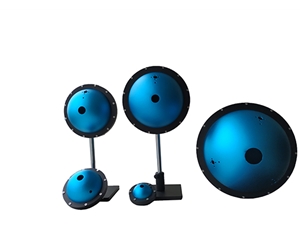
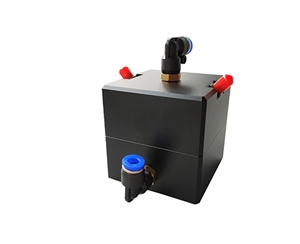
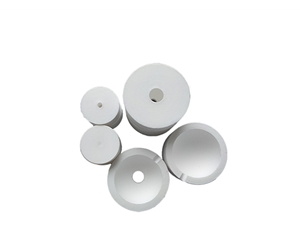
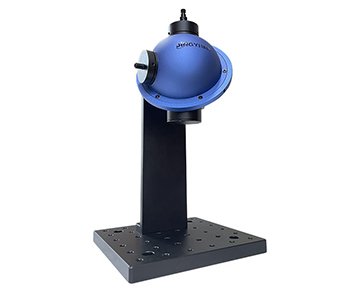
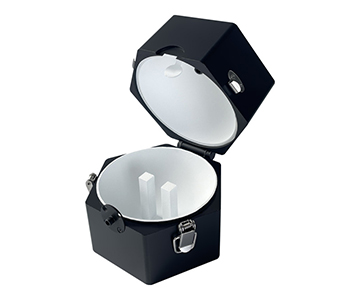
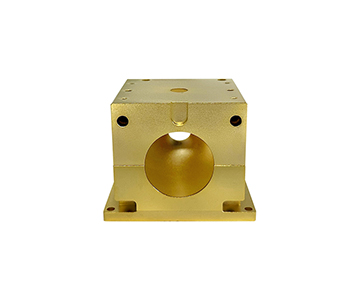
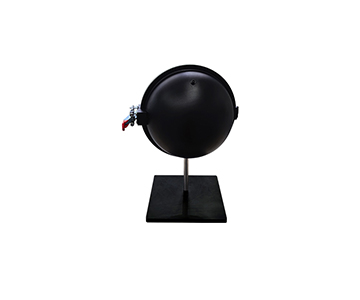
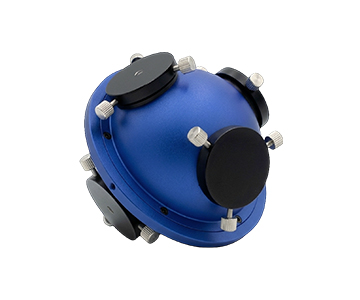
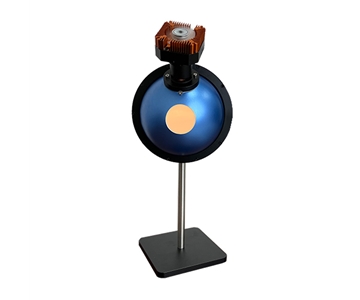
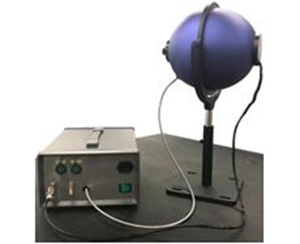
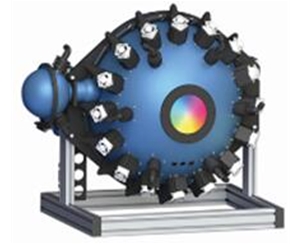
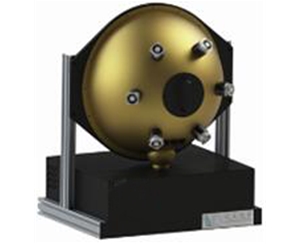
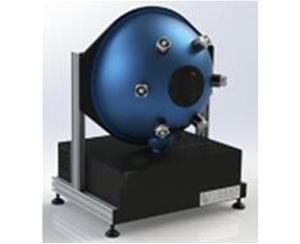
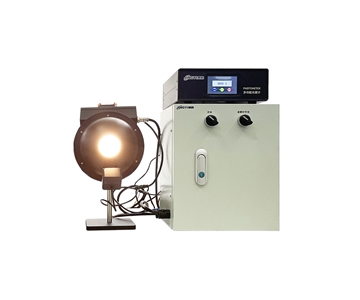
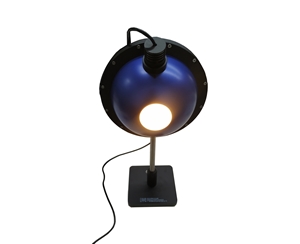
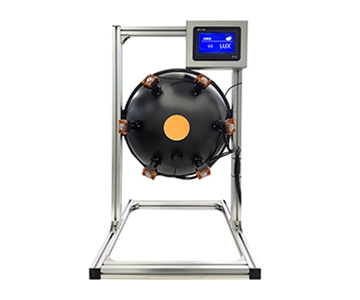
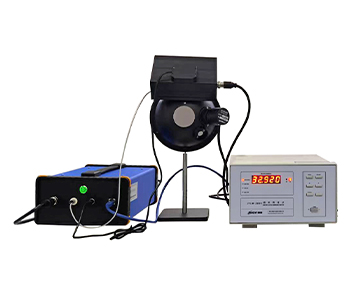
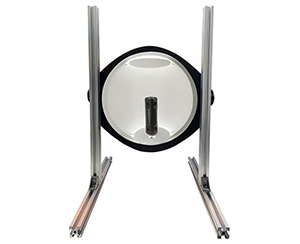
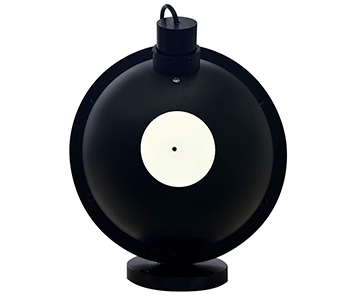
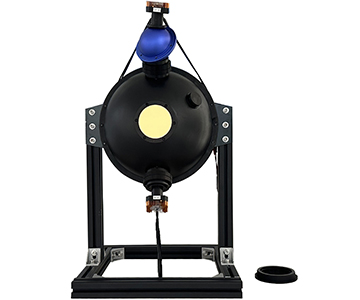
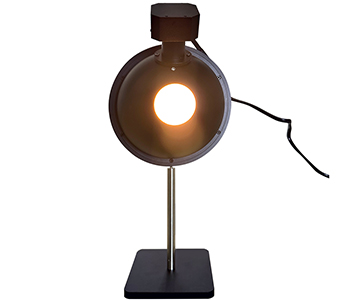
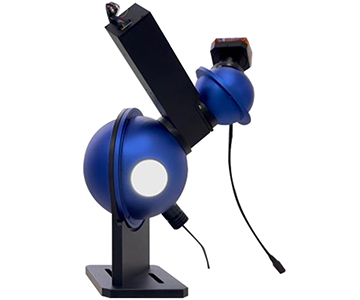
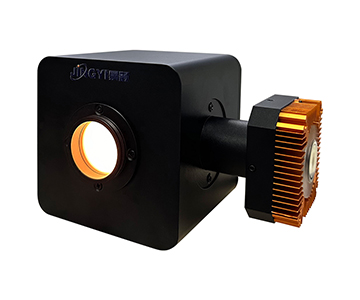
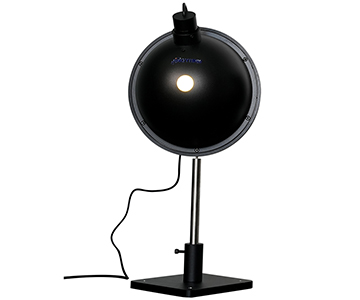
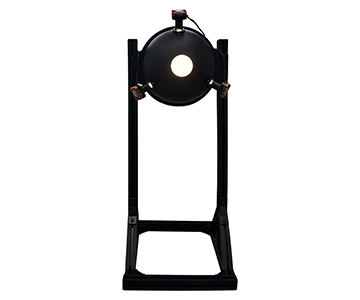
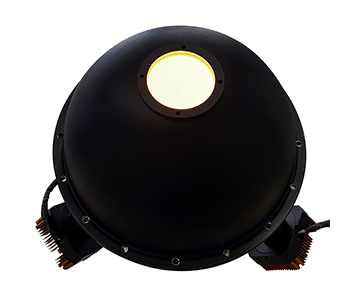
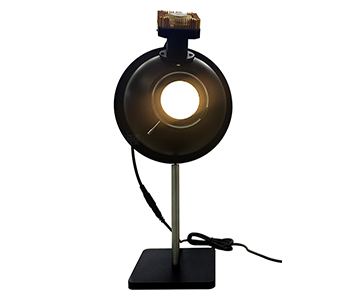
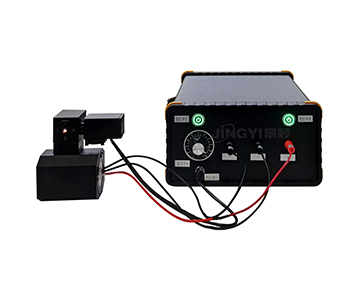
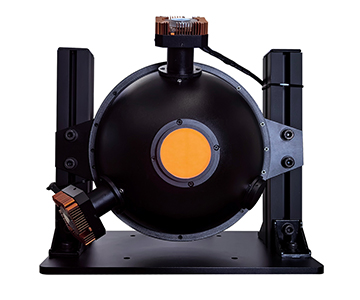
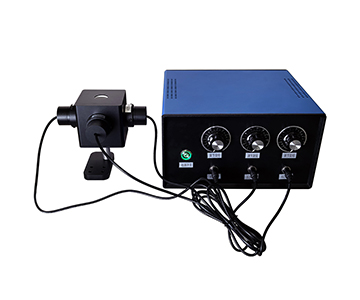
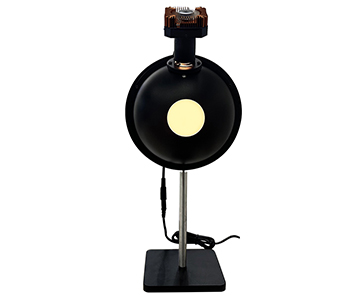
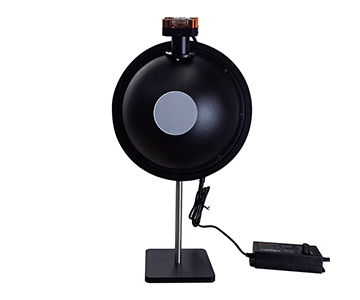
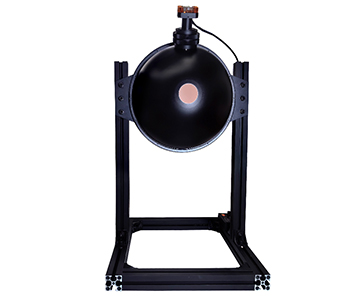
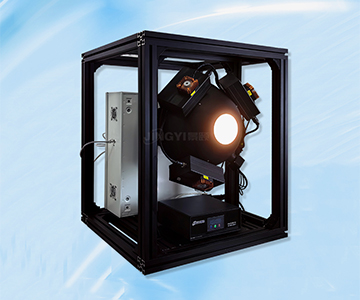
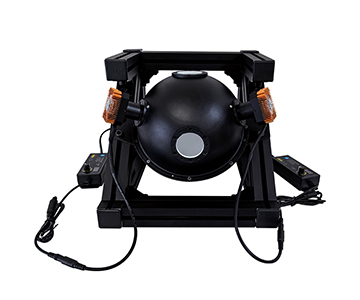
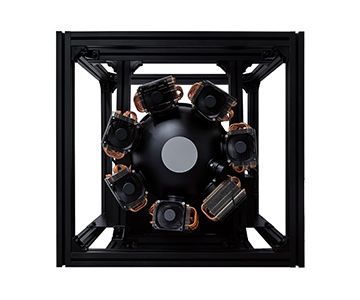
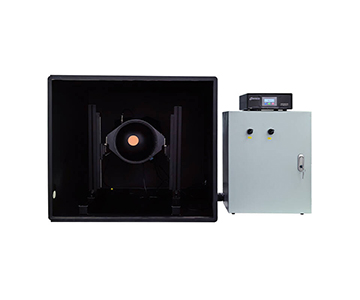
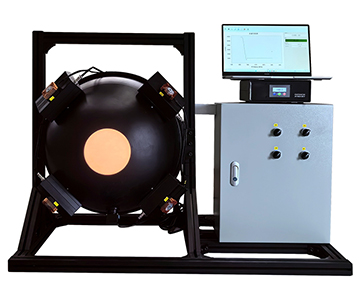
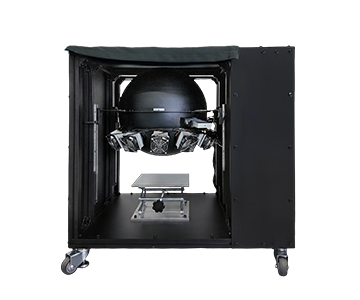
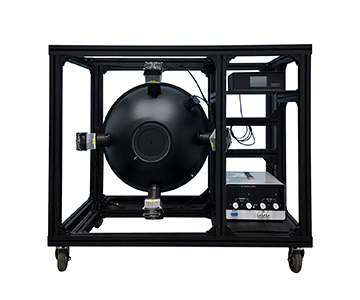
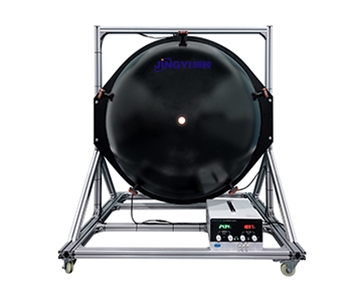
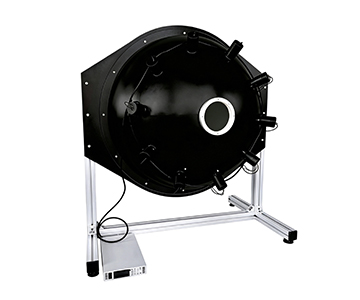
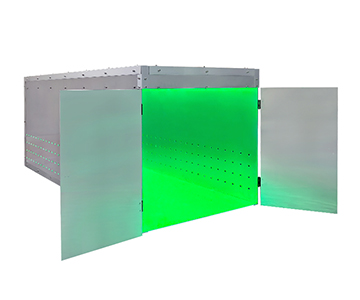
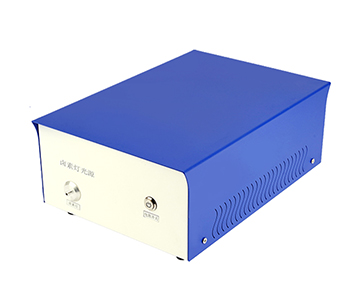
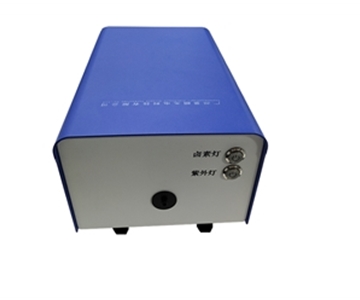
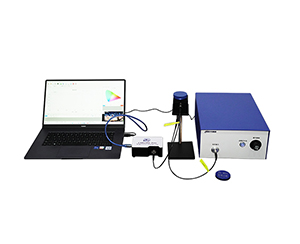
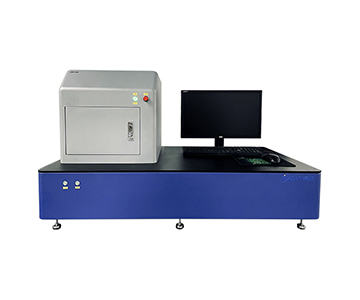
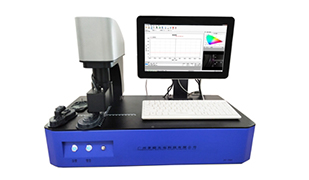
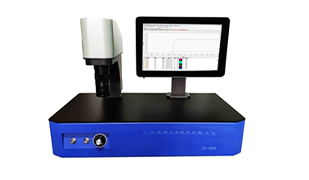
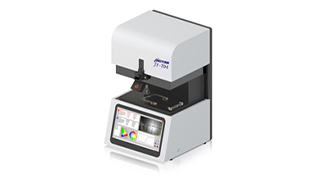
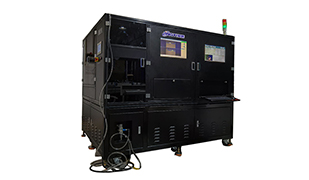
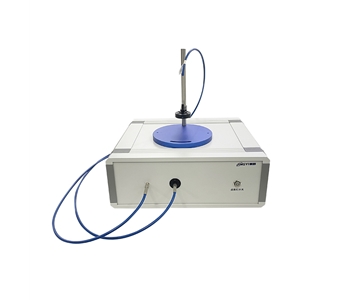
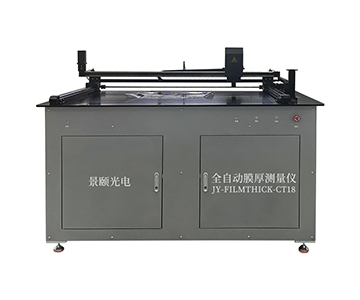
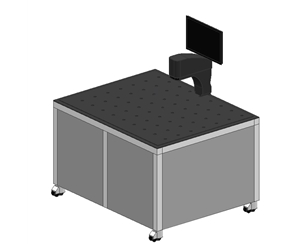
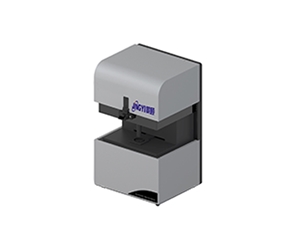
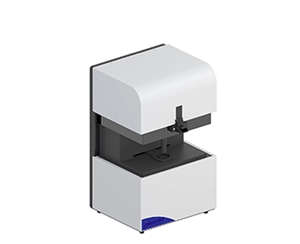
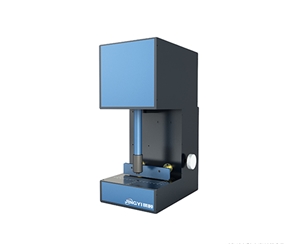
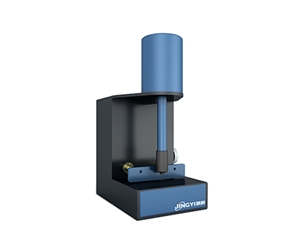
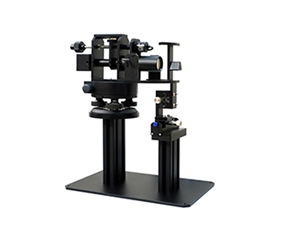
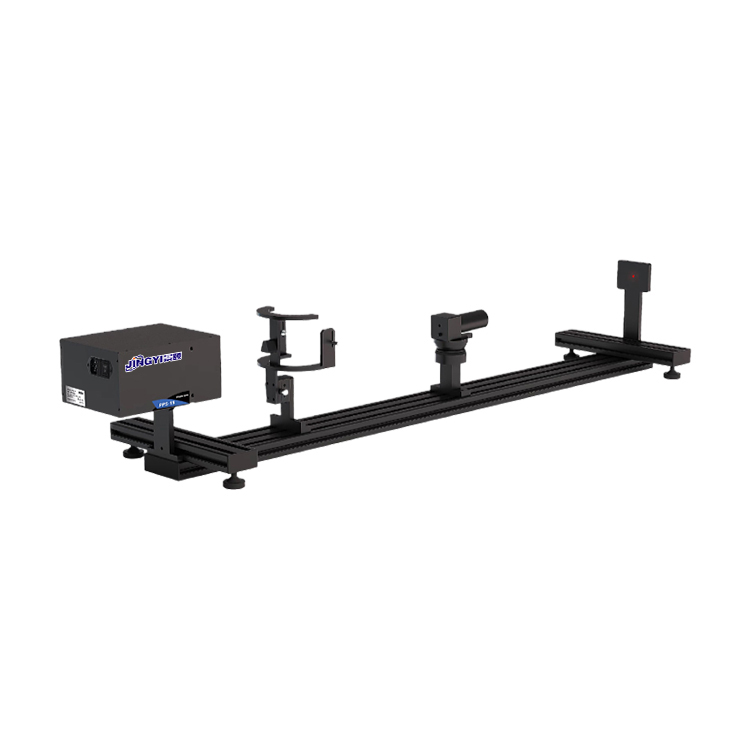
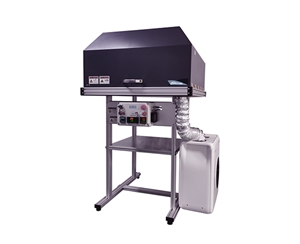
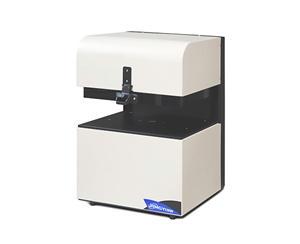
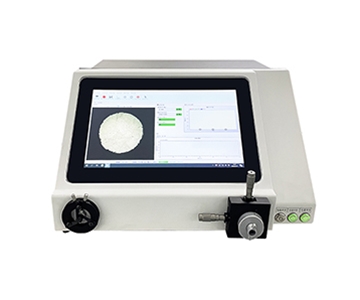
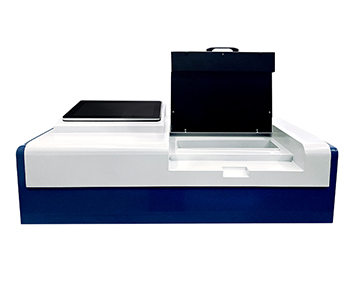
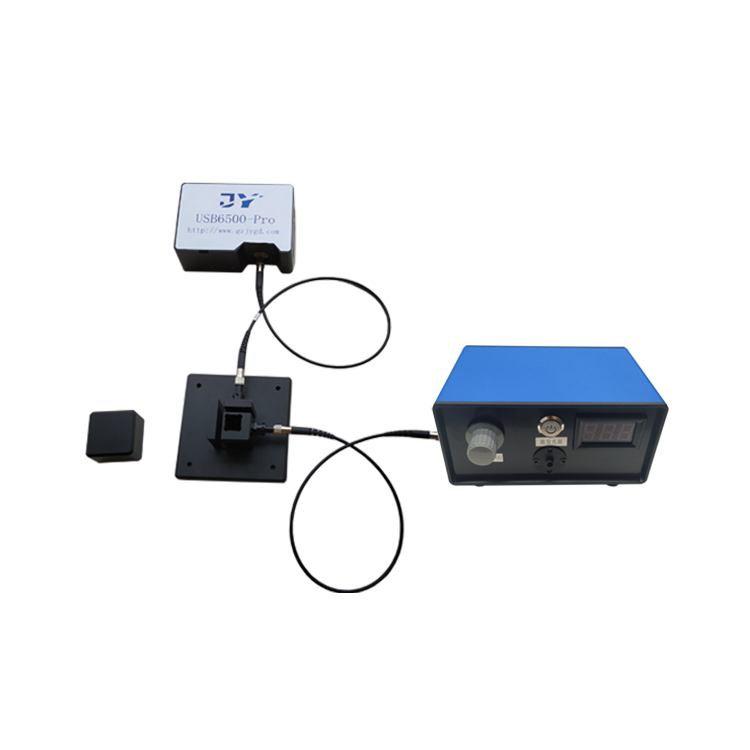
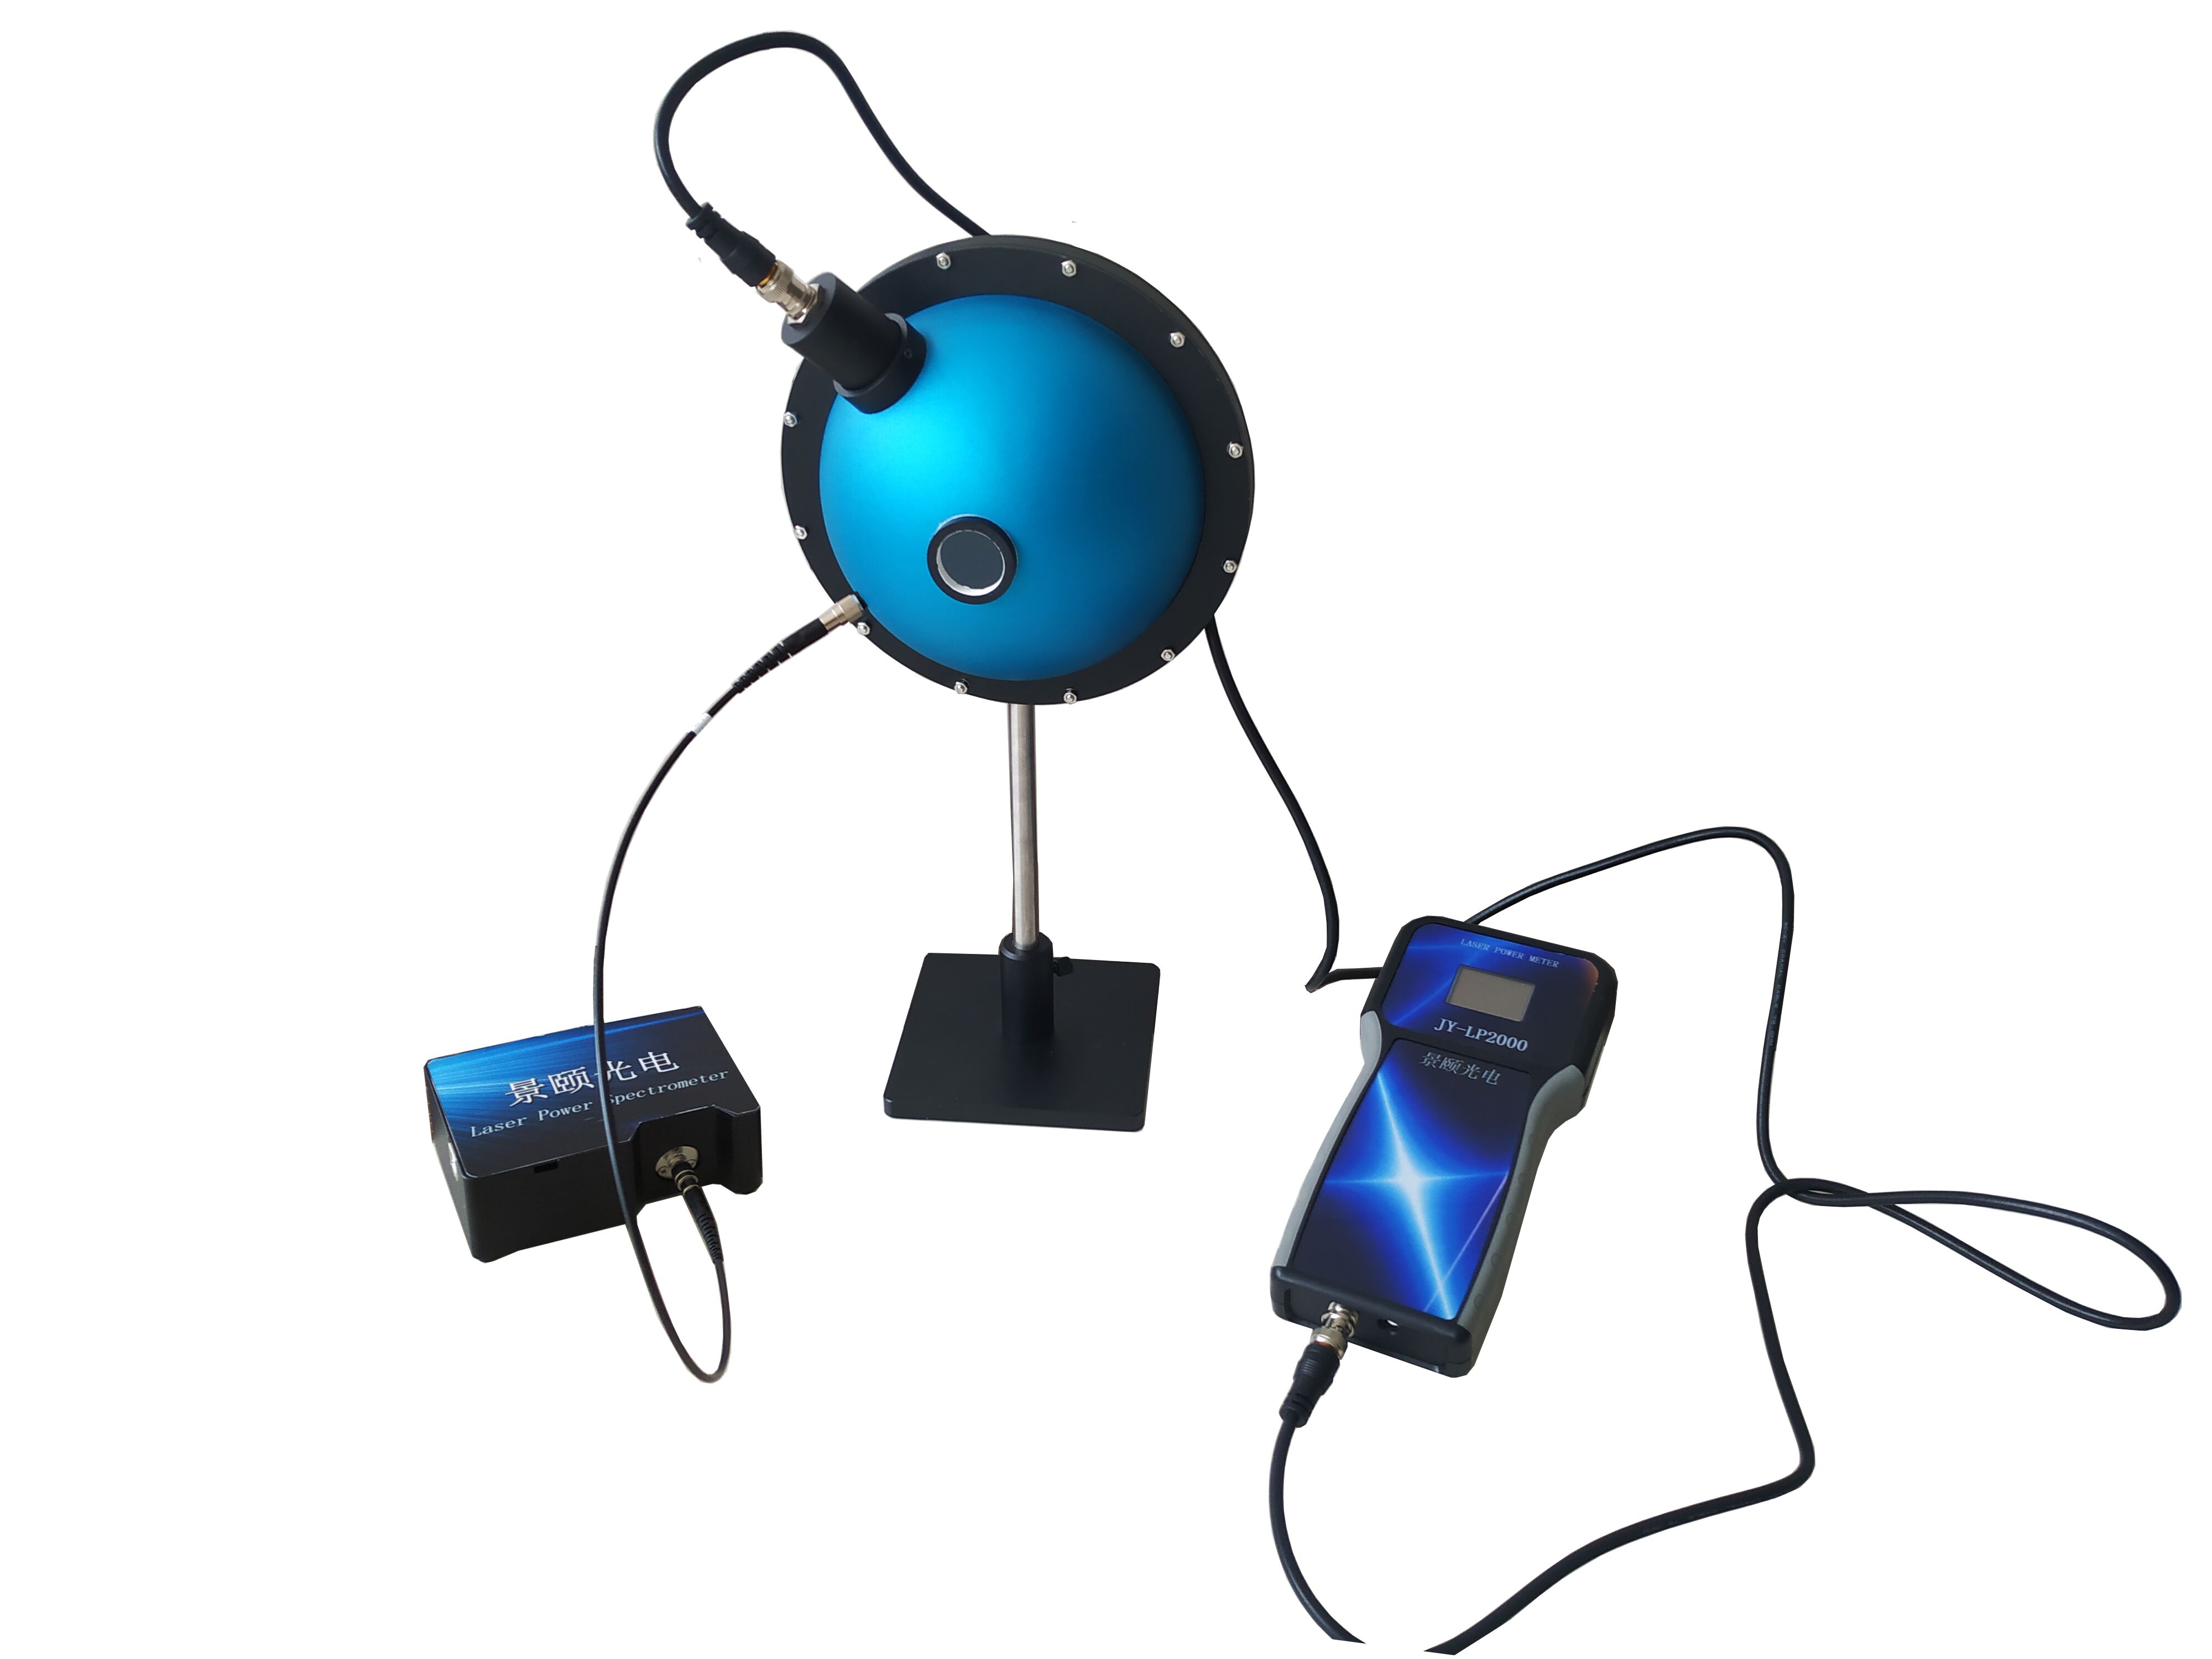
In CMOS sensor correction, remote sensing instrument calibration, and low-light imaging tests, the value of an integrating sphere uniform light source depends not only on nominal uniformity but on whether the monitoring feedback sampling interval and data chain form a closed loop. A mainstream system with PTFE high diffuse reflection coating achieves 98% to 99% spatial uniformity, paired with motorized iris, brightness or illuminance monitoring, and 0.01-class resolution, covering weak light simulation, absolute radiation calibration, and production line flat-field correction. Coarse sampling intervals miss halogen lamp thermal equilibrium fluctuations and iris step hysteresis. Separating continuous monitoring, grid-based retesting, and independent reference detectors converts output stability into traceable data. Applicable scenarios include photoelectric imaging QC, environmental monitoring remote sensor calibration, and automotive camera online monitoring.
The Overlooked Time Dimension in Production Calibration
During an overnight shift at a CMOS module assembly line in Southeast Asia, a routine patrol discovered that the non-uniformity correction curves for a batch of sensors had shifted by 0.42% during retesting. The cameras were not defective; the standard light source had only logged setpoints, leaving no sufficiently dense record of actual output curves.
This failure chain is typical in optical inspection: power supply ripple, halogen lamp warm-up, iris backlash, and coating temperature drift stack up, eventually manifesting as vignetting or gray-level steps. When a uniform light source only advertises “>98% uniformity” without clarifying the monitoring cadence, the production line still receives fragmented data.
Pulling together remote sensor calibration, low-light imaging, and automotive camera online monitoring reveals a shared pain point: an incomplete time axis. A CMOS sensor correction source cannot merely “shine evenly”; it must answer how often uniformity is verified.
Building a Monitoring Closed-Loop Around Sampling Interval
Monitoring Interval Is Not a Race to the Bottom
After a mainstream system is equipped with brightness or illuminance monitoring, the key is not to push the sampling interval into milliseconds but to match it to physical processes. Halogen lamp thermal equilibrium, motorized iris settling, and detector reading stabilization each have their own time scales. Sampling too densely only records noise; sampling too sparsely misses transition phases.
The evaluated system offers 0.01 lx resolution, motorized iris, and Ethernet communication. A practical engineering approach uses dense sampling during warm-up, minute-level archiving during stable operation, and flags the first several data points after each iris step.
Separating Built-In Monitoring from Independent Retesting
Built-in detectors are suited for real-time closed-loop control, while an independent reference detector periodically calibrates itself. Following the grid-based measurement points and multiple sampling per point outlined in IES LM-79 and ISO 17025 traceability frameworks, planar radiance non-uniformity must be calculated using spatial grids plus temporal averaging. Internal control values cannot replace external metrology results.
This gives the sampling interval two distinct meanings: the feedback interval during device operation and the recording interval during calibration retesting. The former keeps the production line continuous; the latter ensures traceability.
Technical Boundaries of Low-Light Ranges and Wide Dynamic Range
Low-Light Output: Look at the Lower Limit First
A micro-illumination integrating sphere achieves exit port illuminance from 0.0001 to 100 lux. Dual-sphere structures can extend to even lower illuminance levels, simulating starlight, moonlight, and weak signal environments for fluorescence measurement systems.
When testing low-light imaging systems, the sampling interval must follow the signal-to-noise ratio. At low light, integration times lengthen. If the monitoring channel沿用s the high-light rhythm, the recorded curve will fall out of sync with the camera’s actual exposure. The correct approach redefines the acquisition window based on target illuminance, aligning the standard source output, camera exposure, and log timestamps.
Wide Dynamic Range Cannot Rely on Current Adjustment Alone
The documented brightness range spans 0.01 to 100,000, accomplished through a combination of light source layout, motorized iris, and multi-stage attenuation. Simply adjusting current causes the visible-to-near-infrared ratio to drift. Pairing the iris with constant-current drive better suppresses nonlinearity.
PTFE coating covers 200–2500 nm with 98% reflectivity, flattening the light field after multiple diffuse reflections. However, coating contamination, port ratio, and baffle structures still determine edge uniformity—these must be verified on-site during acceptance.
Comparative Metrics Before and After Deployment
A laboratory that replaced manual meter reading with a monitoring-feedback integrating sphere system standardized its records across four dimensions:
| Metric |
Before Deployment |
After Deployment |
| Non-uniformity retest cycle |
Once per shift |
Grid sampling, ≥10 averages per point |
| Anomaly tracing |
Handwritten illuminance values |
Timestamped output curves |
| Iris status |
Manual estimation |
Buffered sampling after settling |
| Warm-up data |
Not retained |
Fully archived |
Retest preparation time dropped from approximately 47 minutes to 18 minutes. Non-integer records made offset points easier to locate. Batch-to-batch dispersion of flat-field correction curves decreased, though exact values vary with camera and lens combinations.
The reference to ISO 17025 and IES LM-79 methodologies chains planar radiance non-uniformity, angular uniformity, and multi-sampling into one验收 framework, allowing purchasers to use the same yardstick. For thin-film interferometry calibration system standards (analogous to ASTM E1776), traceability requirements can serve as a system linkage reference without being forced onto all uniform light source specifications.
Three Cross-Scenario Reusable Principles
Remote sensor calibration sources, CMOS sensor correction sources, and automotive camera online monitoring differ in aperture and spectrum on the surface, but share underlying logic.
First, uniformity is a spatial metric; stability is a temporal metric. Both grids must be measured. Relying solely on factory reports does not guarantee daily reproducibility on the production line.
Second, sampling intervals must bind to physical events: warm-up, iris action, color temperature switching, camera exposure. A single global period is insufficient.
Third, built-in monitoring handles closed-loop control; independent detectors handle evidence collection. When the two data sets diverge, check the optical axis, baffles, and exit port contamination before investigating the power supply.
Environmental monitoring remote sensors prioritize long-term drift. Defense and aerospace low-light imaging prioritizes low-illuminance lower limits. Quality inspection production lines prioritize cycle time and traceable records. Allocate selection权重 accordingly.
Applicability Boundaries and Practical Constraints
An integrating sphere uniform light source is not a universal standard. Pursuing high uniformity with large exit ports involves trade-offs among sphere diameter, port ratio, and internal baffling. A nominal >99% typically corresponds to a specific measurement zone and acceptance conditions, not the entire hemispherical space.
PTFE coating has operating limits of 5°C to 80°C. Oil smoke, organic solvent vapor, and frequent touching will degrade edge uniformity first. Low-light ranges are also constrained by stray light control; without a darkened lab, even the best sphere cannot measure true lower limits.
Operators must establish warm-up and retesting habits. Providing motorized adjustment and monitoring interfaces does not mean the first power-on can proceed directly to formal calibration. Archiving two weeks of warm-up curves resolves production drift more effectively than simply upgrading to a higher-power source.
Frequently Asked Questions
Q1: What sampling interval works for CMOS flat-field correction?
After stabilization, 30- to 60-second archiving is usually sufficient. During warm-up, increase to several seconds per point. The key is alignment with camera frame timestamps—avoid recording setpoints only.
Q2: Can built-in brightness monitoring replace external metrology?
No. The internal channel serves real-time closed-loop control. External reference detectors performing grid multipoint sampling constitute the acceptance basis. The two mutually verify each other.
Q3: How to judge uniformity at very low illuminance in micro-light scenarios?
Extend integration time, shield from stray light, fix probe positions, and take multipoint multi-sample averages per ISO 17025-aligned methods. Focus on repeatability rather than single readings.
Q4: For production line selection, should sphere diameter or monitoring function come first?
First determine sphere diameter based on camera field of view and exit port aperture. Then evaluate motorized iris, monitoring resolution, and communication interfaces. Without closed-loop recording, uniformity reports are difficult to reproduce on the production line.
Q5: How can I independently verify equipment status upon delivery?
Scan the exit port grid with an上级 calibrated detector, retain continuous output curves, and verify uniformity, stability, and iris step hysteresis. Preserving raw data is more reliable than reading panel values.
About This Guide
Data Sources
: In-house product documentation parameters, IES LM-79 photometric testing guidelines, ISO 17025 calibration framework, public standard platform specifications for uniform light sources.
Author
: Cai Xiaodong, Senior Application Engineer, Jingyi Optoelectronics, 12 years in optical metrology and integrating sphere system design.
Disclosure
: Jingyi Optoelectronics manufactures integrating sphere uniform light sources and related optical calibration equipment. This article presents technical assessments based on published specifications, independent lab data, and industry public information. No compensation was received from third-party brands mentioned.
Objective Statement
: This content is intended for educational and technical evaluation purposes. Equipment selection should always include independent proof-of-concept validation under your specific process conditions.
Last Updated
: October 2026
For detailed specifications and application notes on integrating sphere uniform light sources, search "Jingyi Optoelectronics + integrating sphere uniform light source" or visit our technical library.