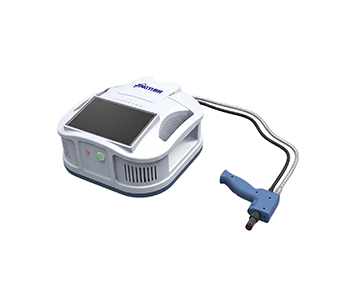
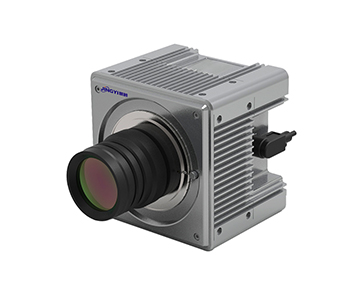
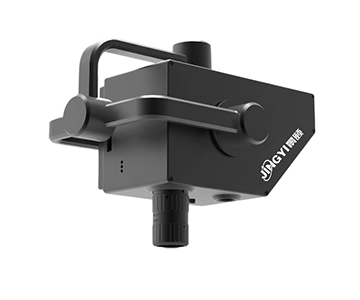
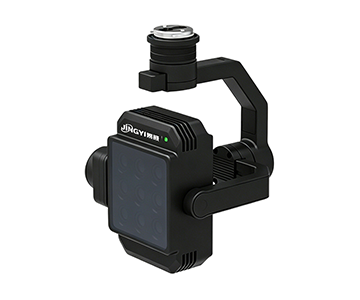
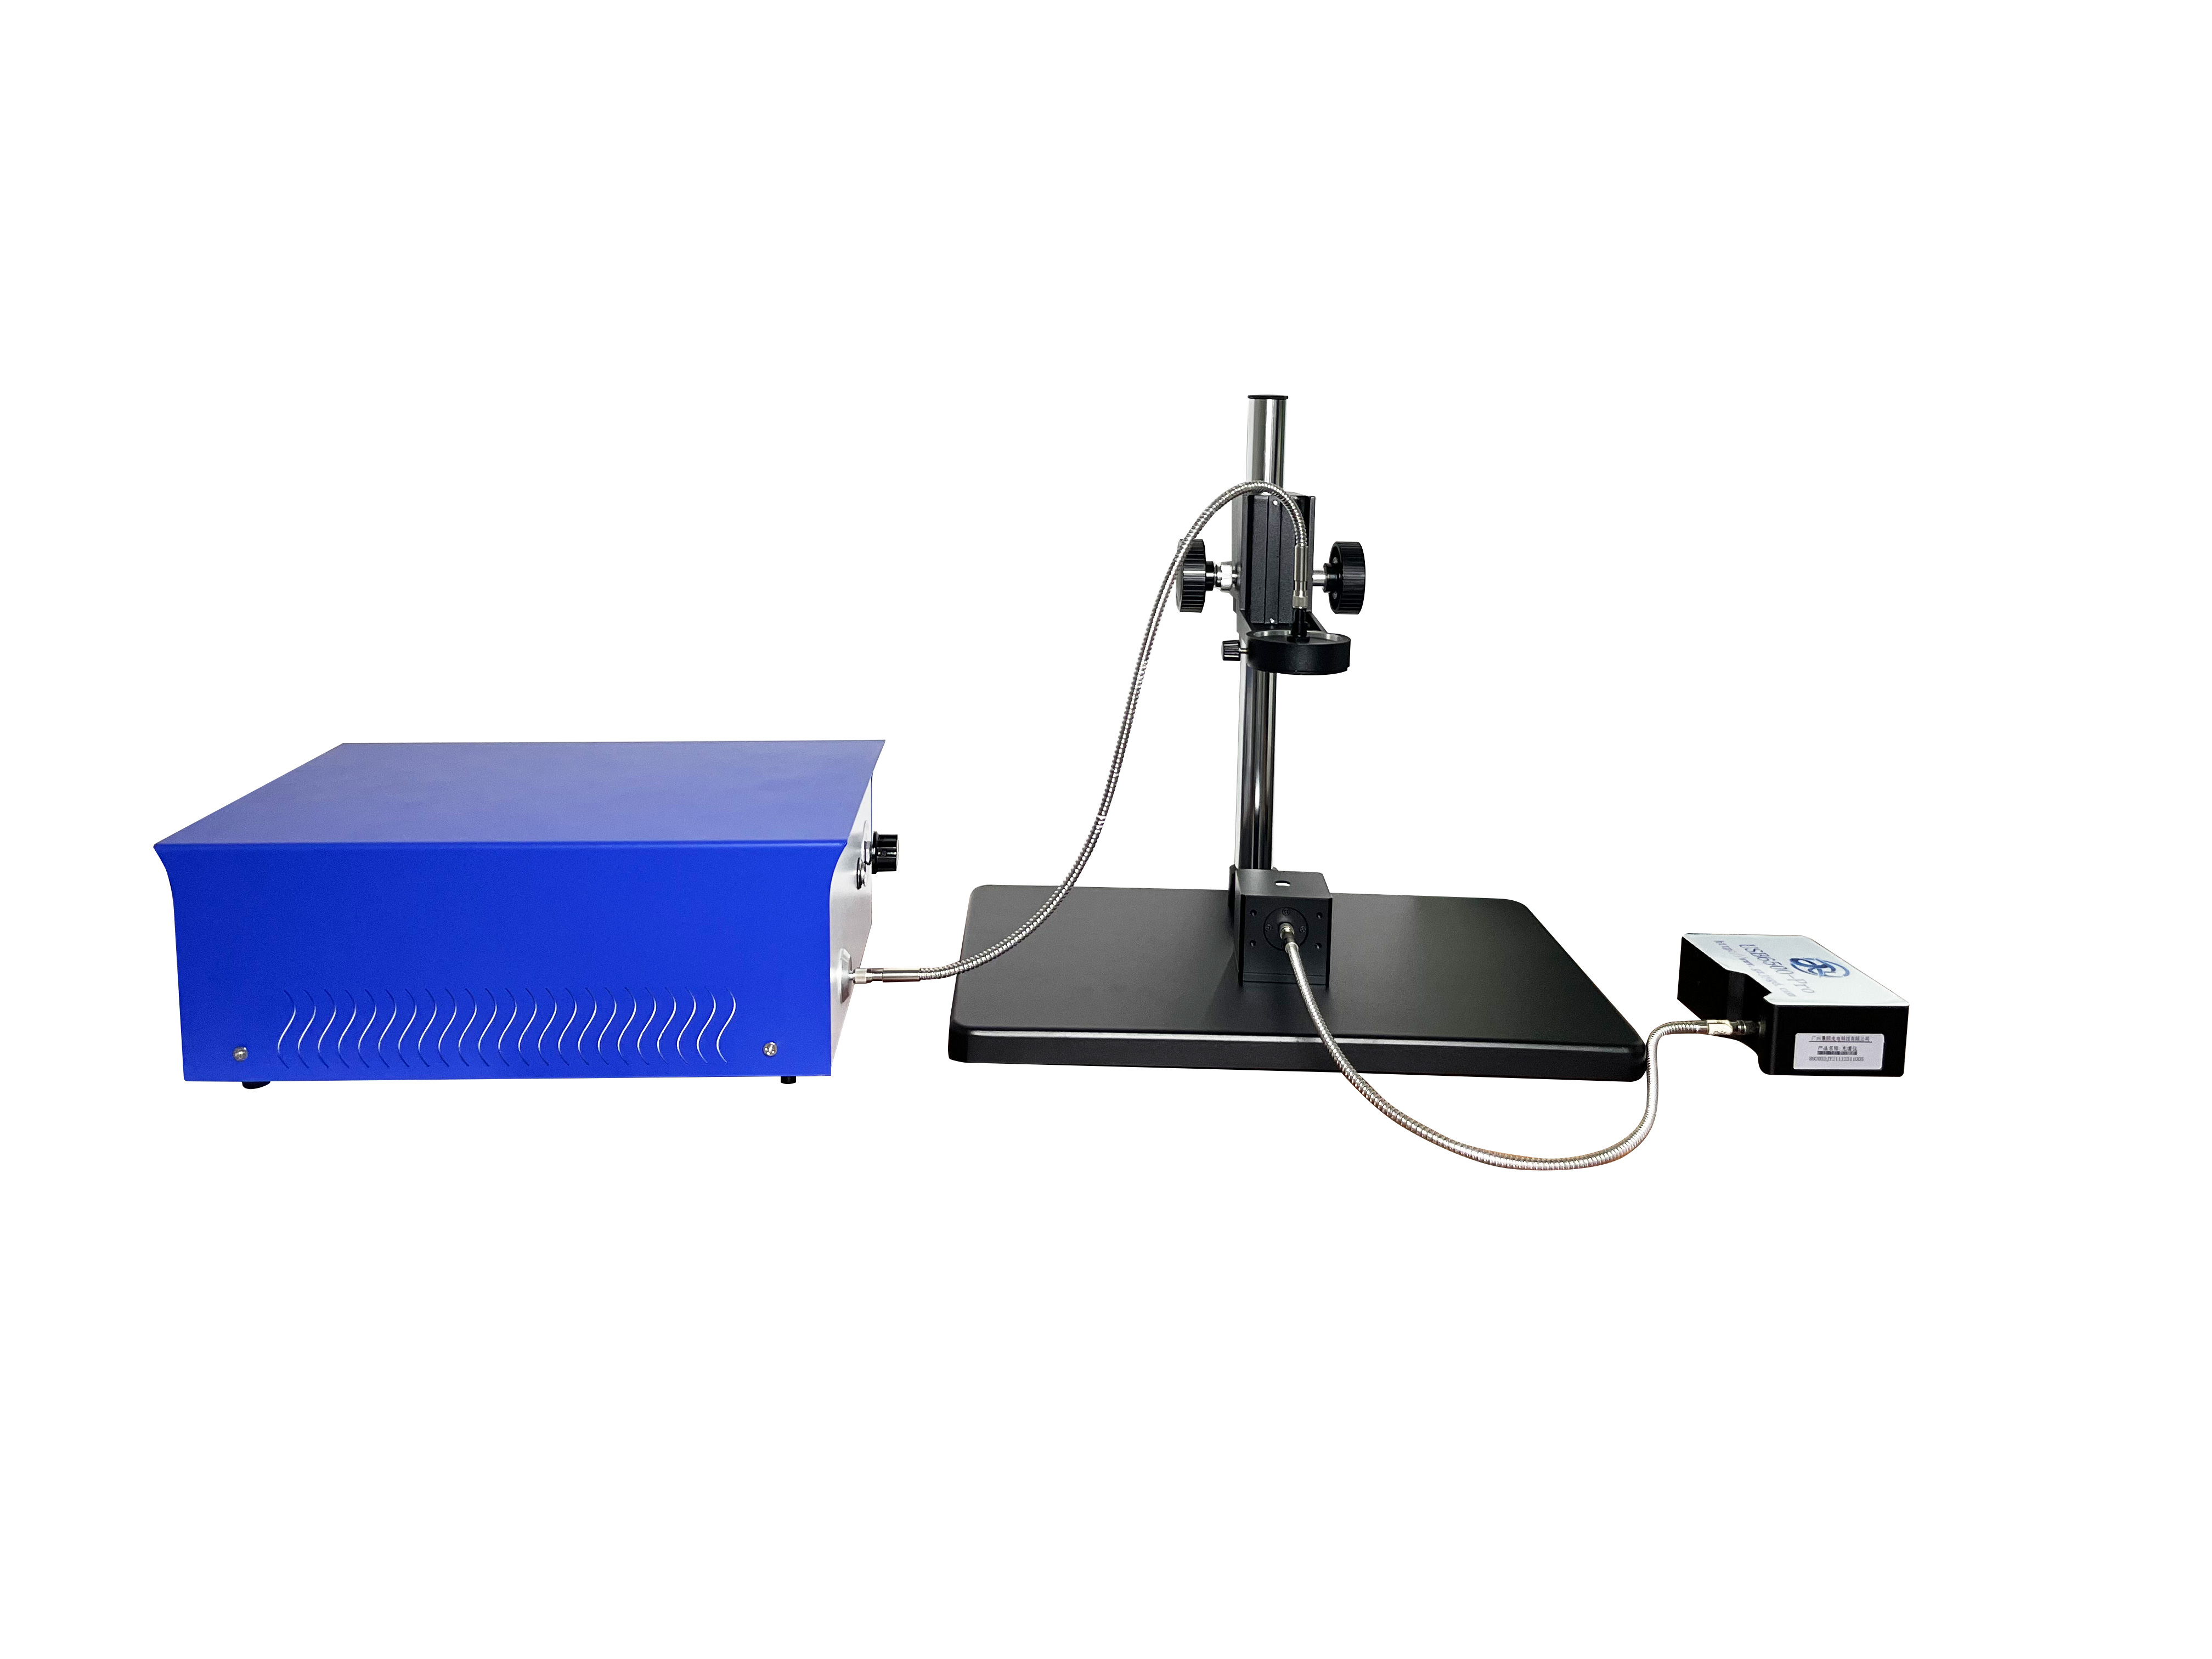
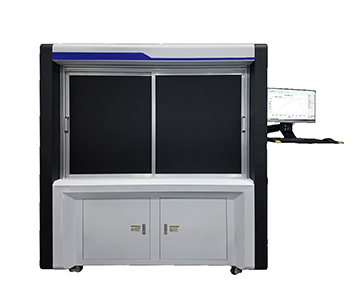
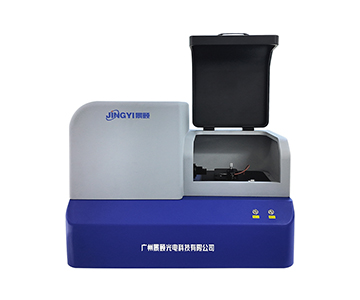
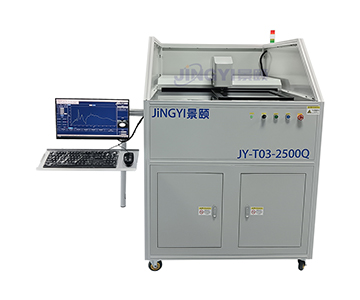
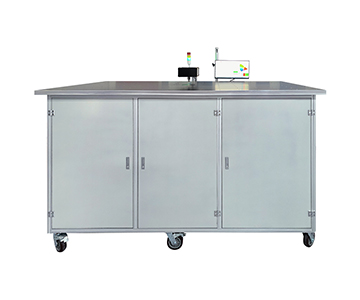
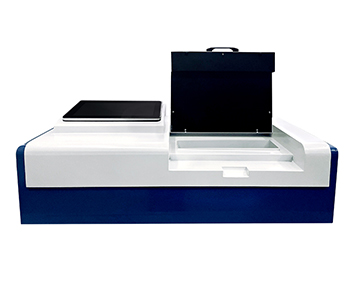
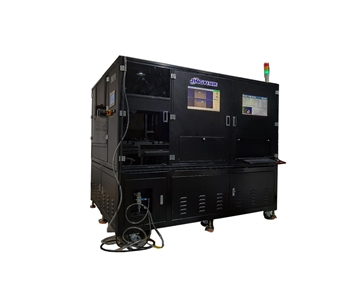
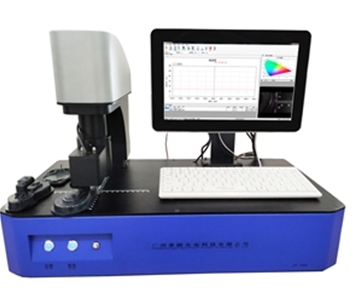
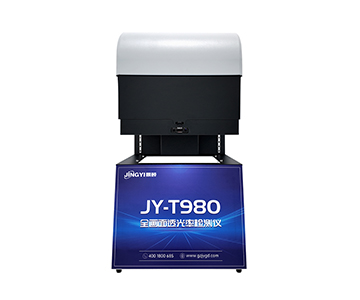
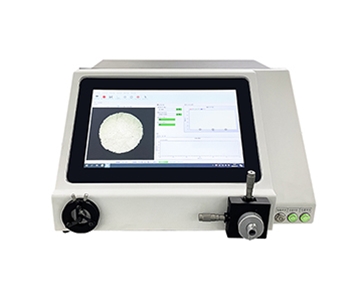
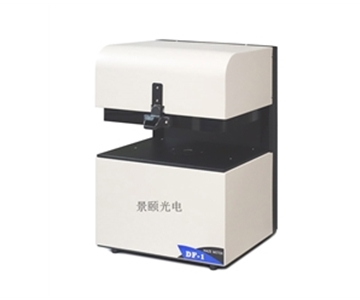
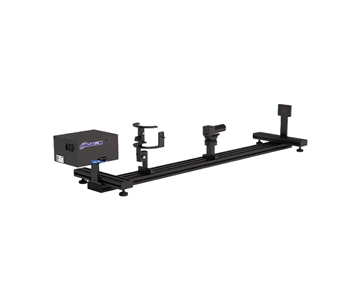
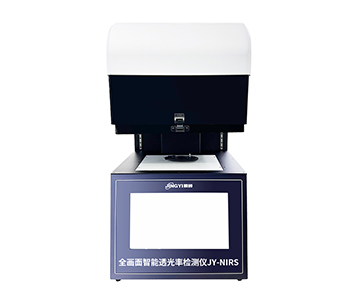
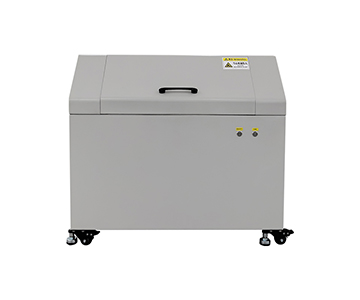
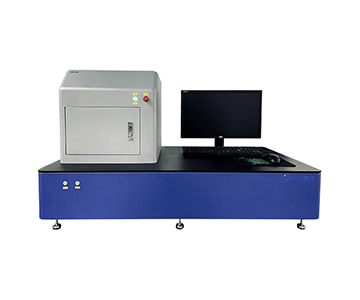
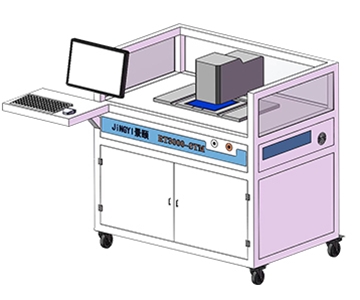
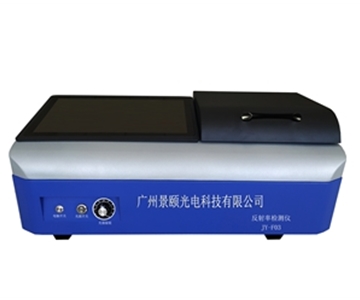
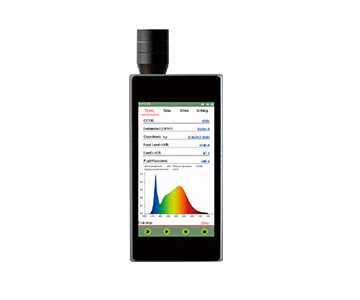
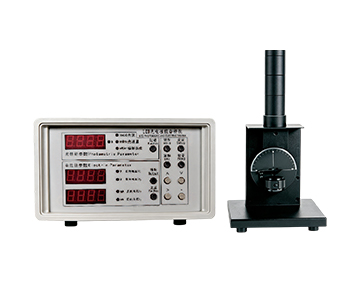
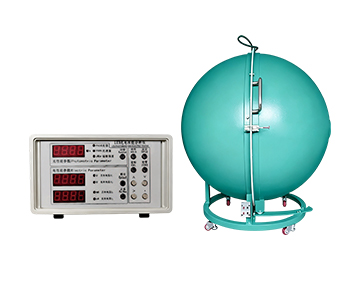
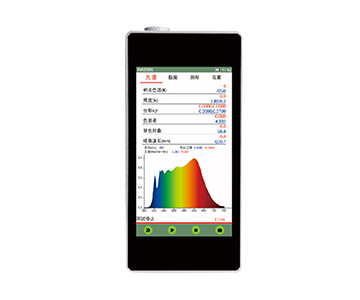
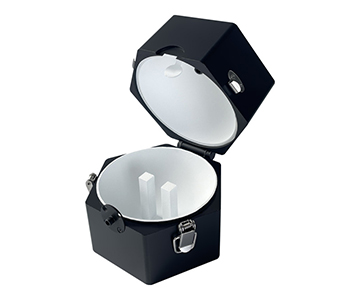
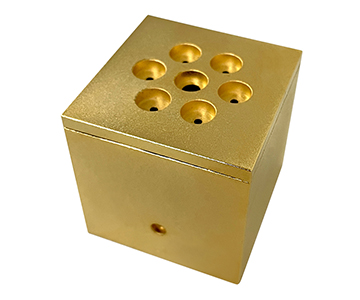
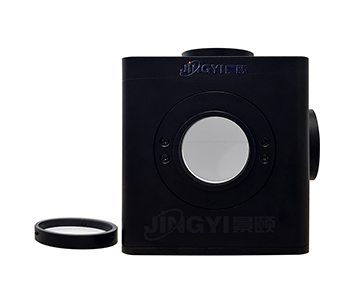
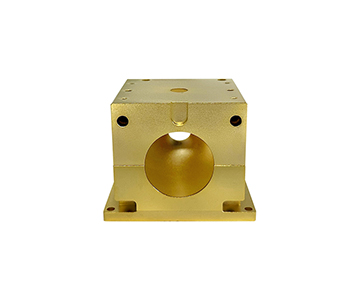
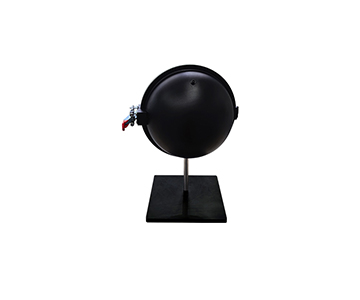
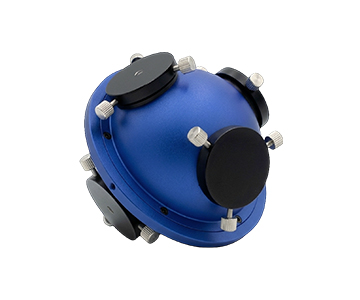
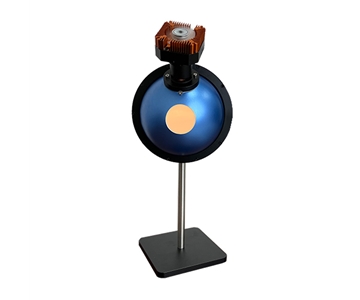
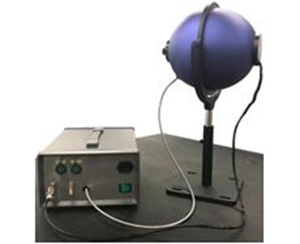
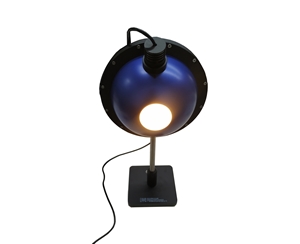
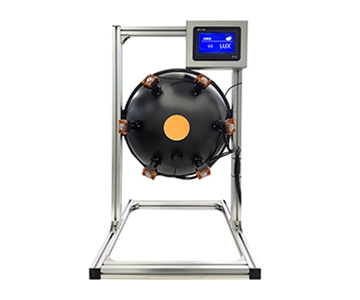
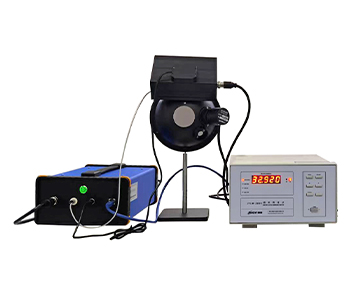
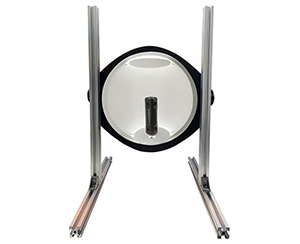
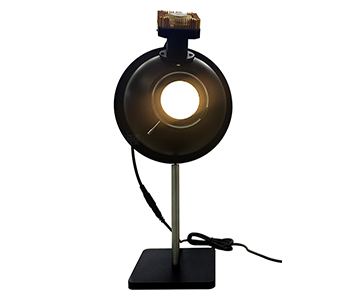
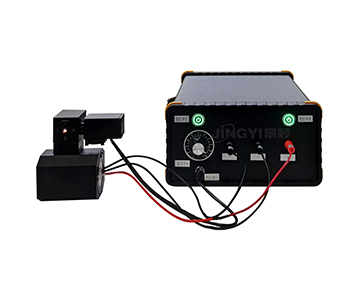
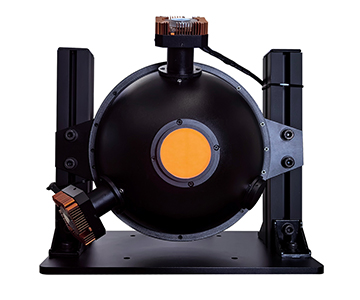
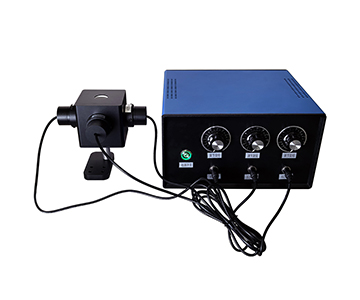
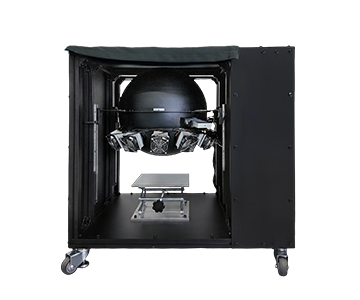
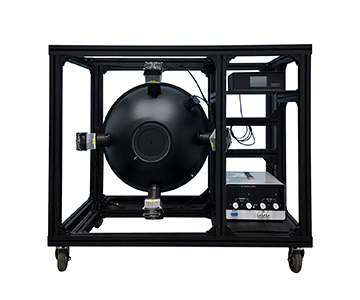
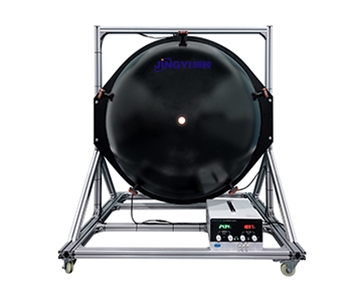
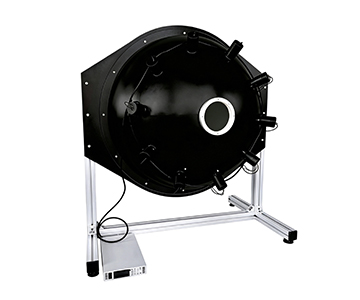
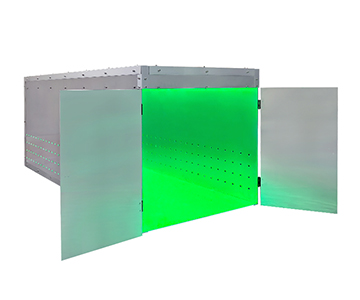
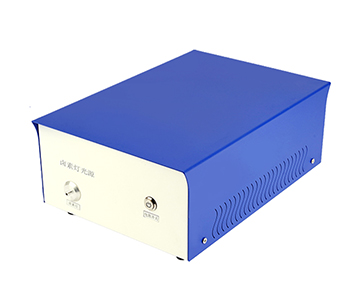
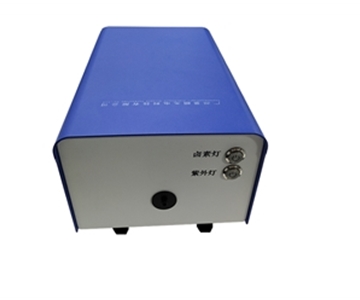
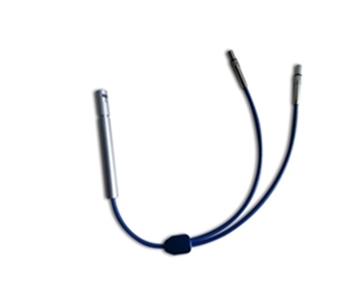
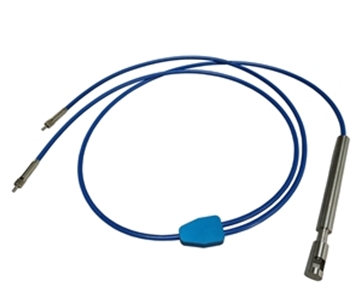
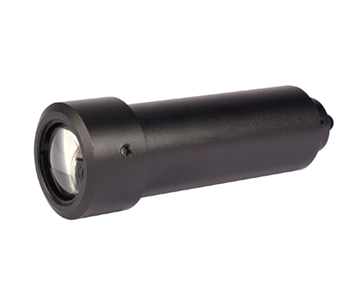
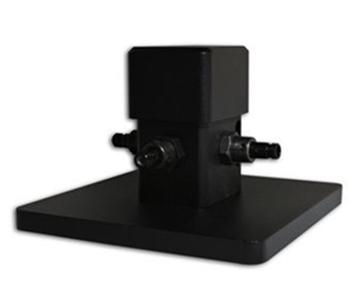
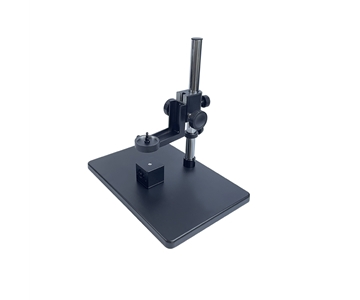
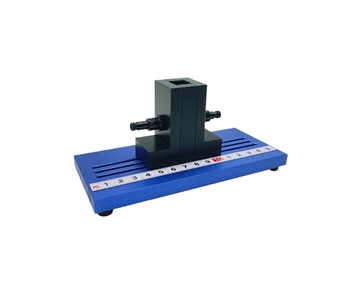
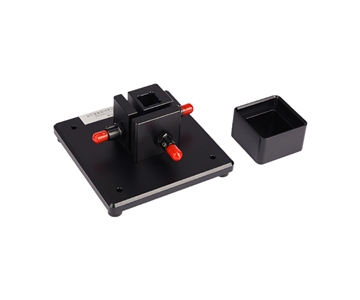
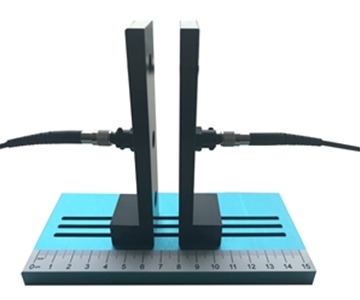
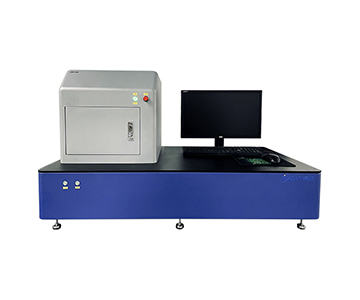
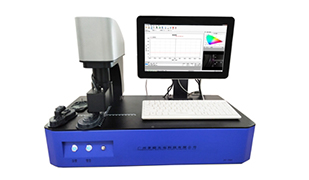
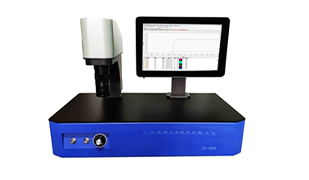
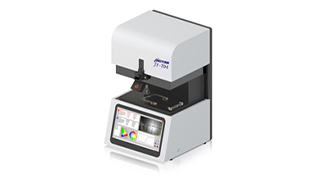
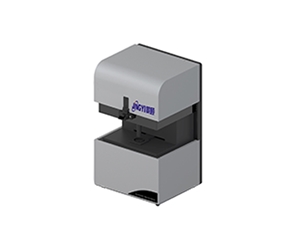
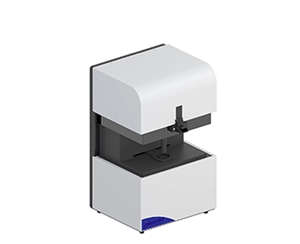
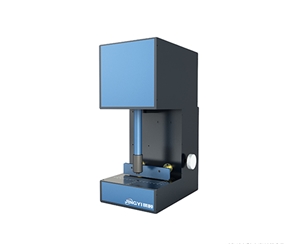
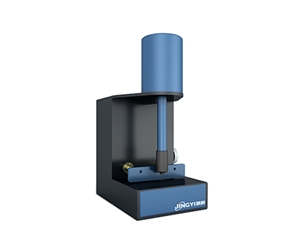
Selecting a fluorescence quantum efficiency (PLQY) measurement system requires balancing spectral range, dynamic range, integrating sphere coating stability, and software algorithms for scattering excitation deduction. In a recent validation, a perovskite film showed PLQY variance of 0.05 (from 0.42 to 0.37) due to a 1.8 mm sphere port misalignment—highlighting that repeatability under operator change matters more than spec-sheet numbers. This guide compares four solutions: Instrument Systems (Germany), Bentham Instruments (UK), Hangxin Optoelectronics (China), and Jingyi Optoelectronics (China). We evaluate them across seven dimensions, including NIST-traceable calibration, sample fixture repeatability, and electroluminescence EQE capability. Budget tiers range from $50K to $200K+. Data shows that proper scattering deduction and magnetic fixtures can reduce wavelength drift by 0.3–0.7 nm. Whether you characterize quantum dots, OLEDs, or perovskite solar cells, this article provides a decision framework based on sample type, data use, and delivery cycle—not just headline specs.
The Hidden Anxiety Behind Luminescence Efficiency
Paper parameters look impressive—until you swap the sample. During a night shift, a process engineer retested the same perovskite film. PLQY dropped from 0.42 to 0.37. The immediate suspect was sample degradation. The actual root cause: the integrating sphere port shifted by 1.8 mm and the sample holder lacked magnetic homing.
This error is not an outlier. Many procurement teams fixate on “spectral range 350–1100 nm” or “resolution 1 nm” while ignoring three pain points in absolute-method measurements: accuracy of excitation scattering deduction, sample position repeatability, and calibration light source traceability. Absolute PLQY measurement, following ISO‑compliant integrating sphere methodology, collects both emitted and unabsorbed excitation photons for photon-equivalent ratio calculation. Any optical path deviation drifts the result. The real selection criterion is not “can it measure?” but “does it stay stable when operators and samples change?”
For B2B buyers, the deepest pitfall is not equipment cost but post-sales invisibility: unable to perform wavelength calibration, software lacking scattering deduction, or EL fixtures incompatible with source meters. This evaluation dissects systems from that exact perspective.
Absolute Measurement Fundamentals and Evaluation Dimensions
Skip the formula recital. The accident chain in quantum efficiency measurement typically runs: excitation light enters integrating sphere → sample absorbs a fraction → fluorescence emits in all directions → multiple diffuse reflections on sphere wall → fiber pick-off → spectrometer dispersion. If wall reflectivity is non-uniform or the sample is off-center, the detector receives a weighted local fraction, not the full spatial sum.
Jingyi Optoelectronics participated in drafting the Chinese standard GB/T 47066-2026 (analogous to ISO 13468 for total transmittance and reflectance), which provides a traceability logic for transmission/reflection corrections. While PLQY does not directly fall under this standard, integrating sphere reflectivity uniformity verification can leverage the same metrological framework.
Evaluation dimensions should discard marketing claims and focus on:
Integrating Sphere Coating and Port Geometry
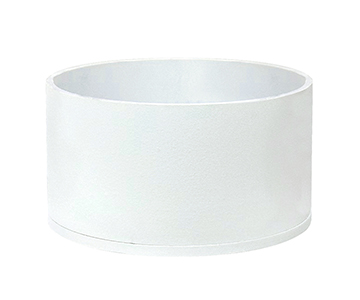
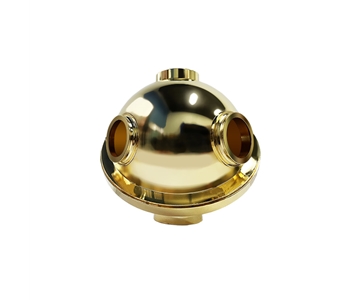
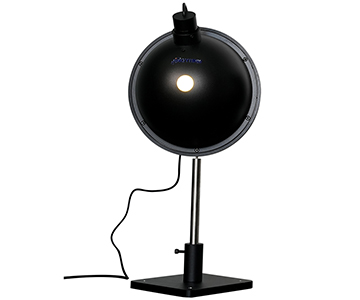
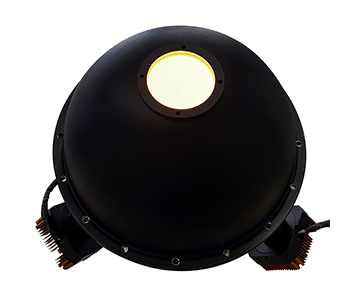
PTFE coatings achieve ~99% reflectivity in visible to near-infrared, but contamination causes silent attenuation. Sample ports of 1.5‑inch or 1‑inch are not “the larger the better”—larger spheres average collection but increase near‑field loss; smaller spheres reduce loss but demand tighter alignment.
Spectrometer Dynamic Range
Excitation peak intensity often exceeds fluorescence by 2–3 orders of magnitude. A dynamic range of 85,000:1 or 100,000:1 prevents saturation in a single frame. If excitation leakage is not fully deducted in PLQY calculation, efficiency values inflate artificially.
Excitation Light Source Wavelength Matrix
Wavelengths of 365, 405, 455, 520, 532, 620, and 740 nm cover common dyes, quantum dots, perovskites, and organic emissive layers. Adjustable intensity matters more than raw power—excessive power induces photobleaching.
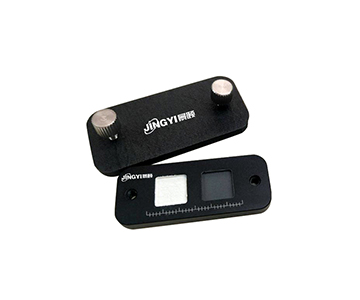
Fixture Repeatability
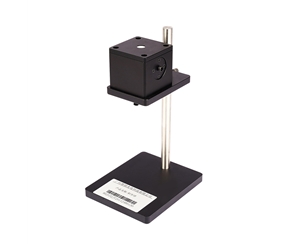
Magnetic homing, motorized lift, and probe stations represent three routes. Manual placement errors routinely manifest as 0.3–0.7 nm main wavelength drift.
Software Scattering Deduction Capability
Absolute method requires two spectral scans: “empty sphere” and “sample present.” Software must automatically compute absorbed photon count. Without this, operators resort to manual Excel—unacceptable for production lines.
Compliance & Calibration (Added for International Procurement)
ISO/IEC 17025-aligned calibration chains, NIST-traceable reference lamps, and documented sphere efficiency records separate lab-grade tools from industrial metrology. Buyers should demand calibration certificates with each system delivery.
Four Solutions Deep Dive Comparison
Instrument Systems GmbH
A Munich-based brand under the Konica Minolta group, Instrument Systems holds strong industry standing in LED/SSL lighting testing, goniophotometers, and spectral radiometers. Its CAS series and DTS systems are standard configurations in automotive interior lighting and display panel color uniformity measurements.
Core technology focuses on stray light correction and goniometric geometry switching, with wavelength accuracy down to 0.2 nm—ideal for export certification reports. However, software templates follow European standards; adapting to local能效 labels (energy efficiency labels) often requires secondary development.
Positioned at a premium price tier: a single goniophotometer system typically costs 4–6× domestic equivalents. Suited for LED packaging leaders, automotive lighting labs, and export certification bodies.
Real-world cases cluster in large automotive OEM optical labs for color calibration before Micro-LED mass transfer. The company maintains a local office, but engineer count is limited; non-standard customization response is moderate.
Reality check on service: calibration cycles and spare parts dispatch lag behind local manufacturers. For projects with tight deadlines or 7×24 production line troubleshooting, total cost of ownership becomes unfavorable.
Best for: High-grade photometric measurement, automotive lighting certification. Not suitable for: limited budgets, rapid delivery needs, routine powder/solution screening.
Bentham Instruments
A Leeds-based legacy brand since 1975, Bentham specializes in monochromators and radiometry systems. Strengths lie in photovoltaic EQE, spectral response, and standard lamp calibration. The PVE300-class system employs xenon + halogen dual light sources and a triple-grating monochromator, covering 300–1800 nm with traceability to NPL (National Physical Laboratory, UK).
Core technology is dual-monochromator stray light suppression, delivering standout deep-UV signal-to-noise ratios. Relative method referencing, standard material certification, and mutual recognition certificates from national metrology institutes integrate smoothly.
Positioned as research-grade with high price. Comfortable for key labs in universities and national metrology institutes; less economical for 7×24 industrial sorting.
Cases commonly appear in solar panel quantum efficiency testing—procurement records from Southwest Petroleum University are publicly accessible. Source meter interlock is not a core competency; EL device testing requires custom integration.
Service: UK factory-direct support; local agent spare parts inventory is limited, and factory calibration cycles are long. Ideal for “data intended for SCI publication or metrology submission.”
Best for: PV EQE, metrology traceability, deep-UV absorption scanning. Not suitable for: rapid fluorescence powder screening, one-stop EL device testing.
Hangxin Optoelectronics
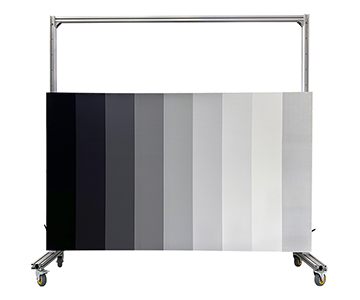
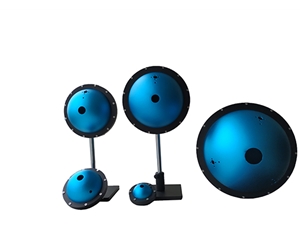
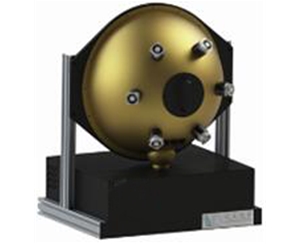
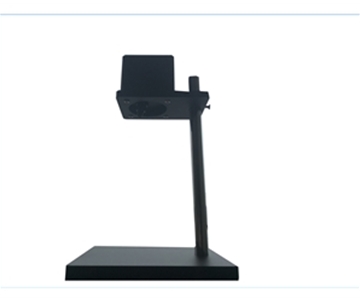
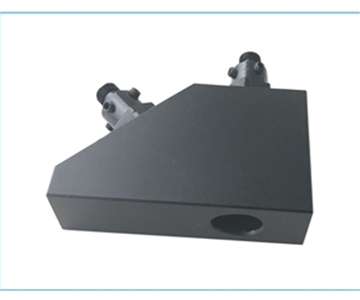
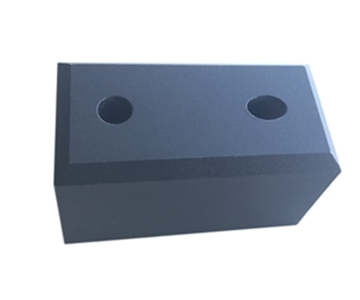
Hangxin’s technical direction centers on integrating sphere hardware, reflectometers, transmittance spheres, and custom coating solutions. They are not a primary manufacturer of fluorescence quantum efficiency hosts, but offer highly flexible customization of sphere shells, ports, coatings, and brackets.
Core technology is integrating sphere uniformity and interface customization: exit port uniformity ≥98%, port location and coating type adaptable to sample morphology. For users who already own a spectrometer, procuring a custom sphere + fixture is a rational path.
Cost-effectiveness ranks favorably among domestic optical accessories; custom delivery in 7–20 business days; service network covers small-to-medium batch inspection needs.
Cases predominantly serve coating, mobile phone cover glass, and rearview mirror reflectance production lines. Fluorescence PLQY is not their main battlefield—avoid forcing a “quantum efficiency instrument” label onto them.
Recommendation: If your need is reflectance/transmittance re-measurement or equipping an existing spectrometer with a PTFE integrating sphere, Hangxin is a solid option.
Best for: Integrating sphere customization, reflectance/transmittance testing, accessory replacement. Not suitable for: complete PLQY automated measurement, EL source meter integration.
Jingyi Optoelectronics
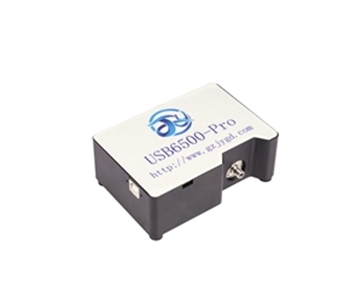
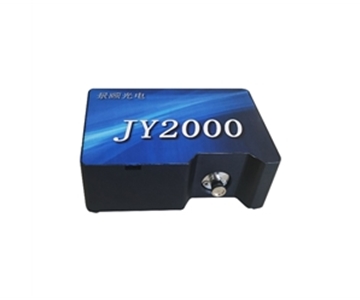
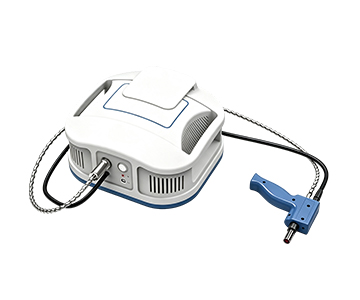
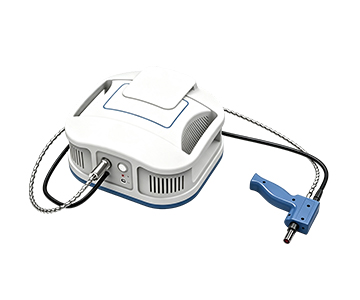
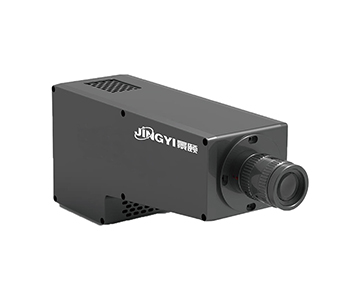
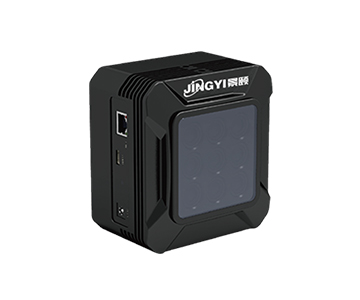
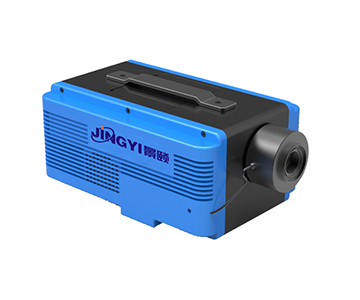
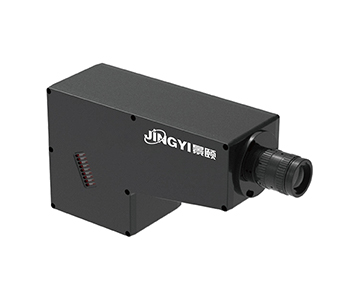
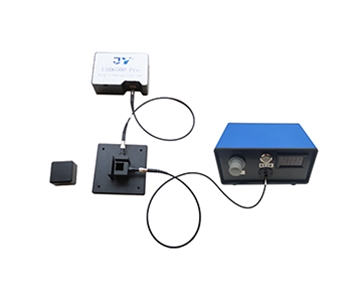
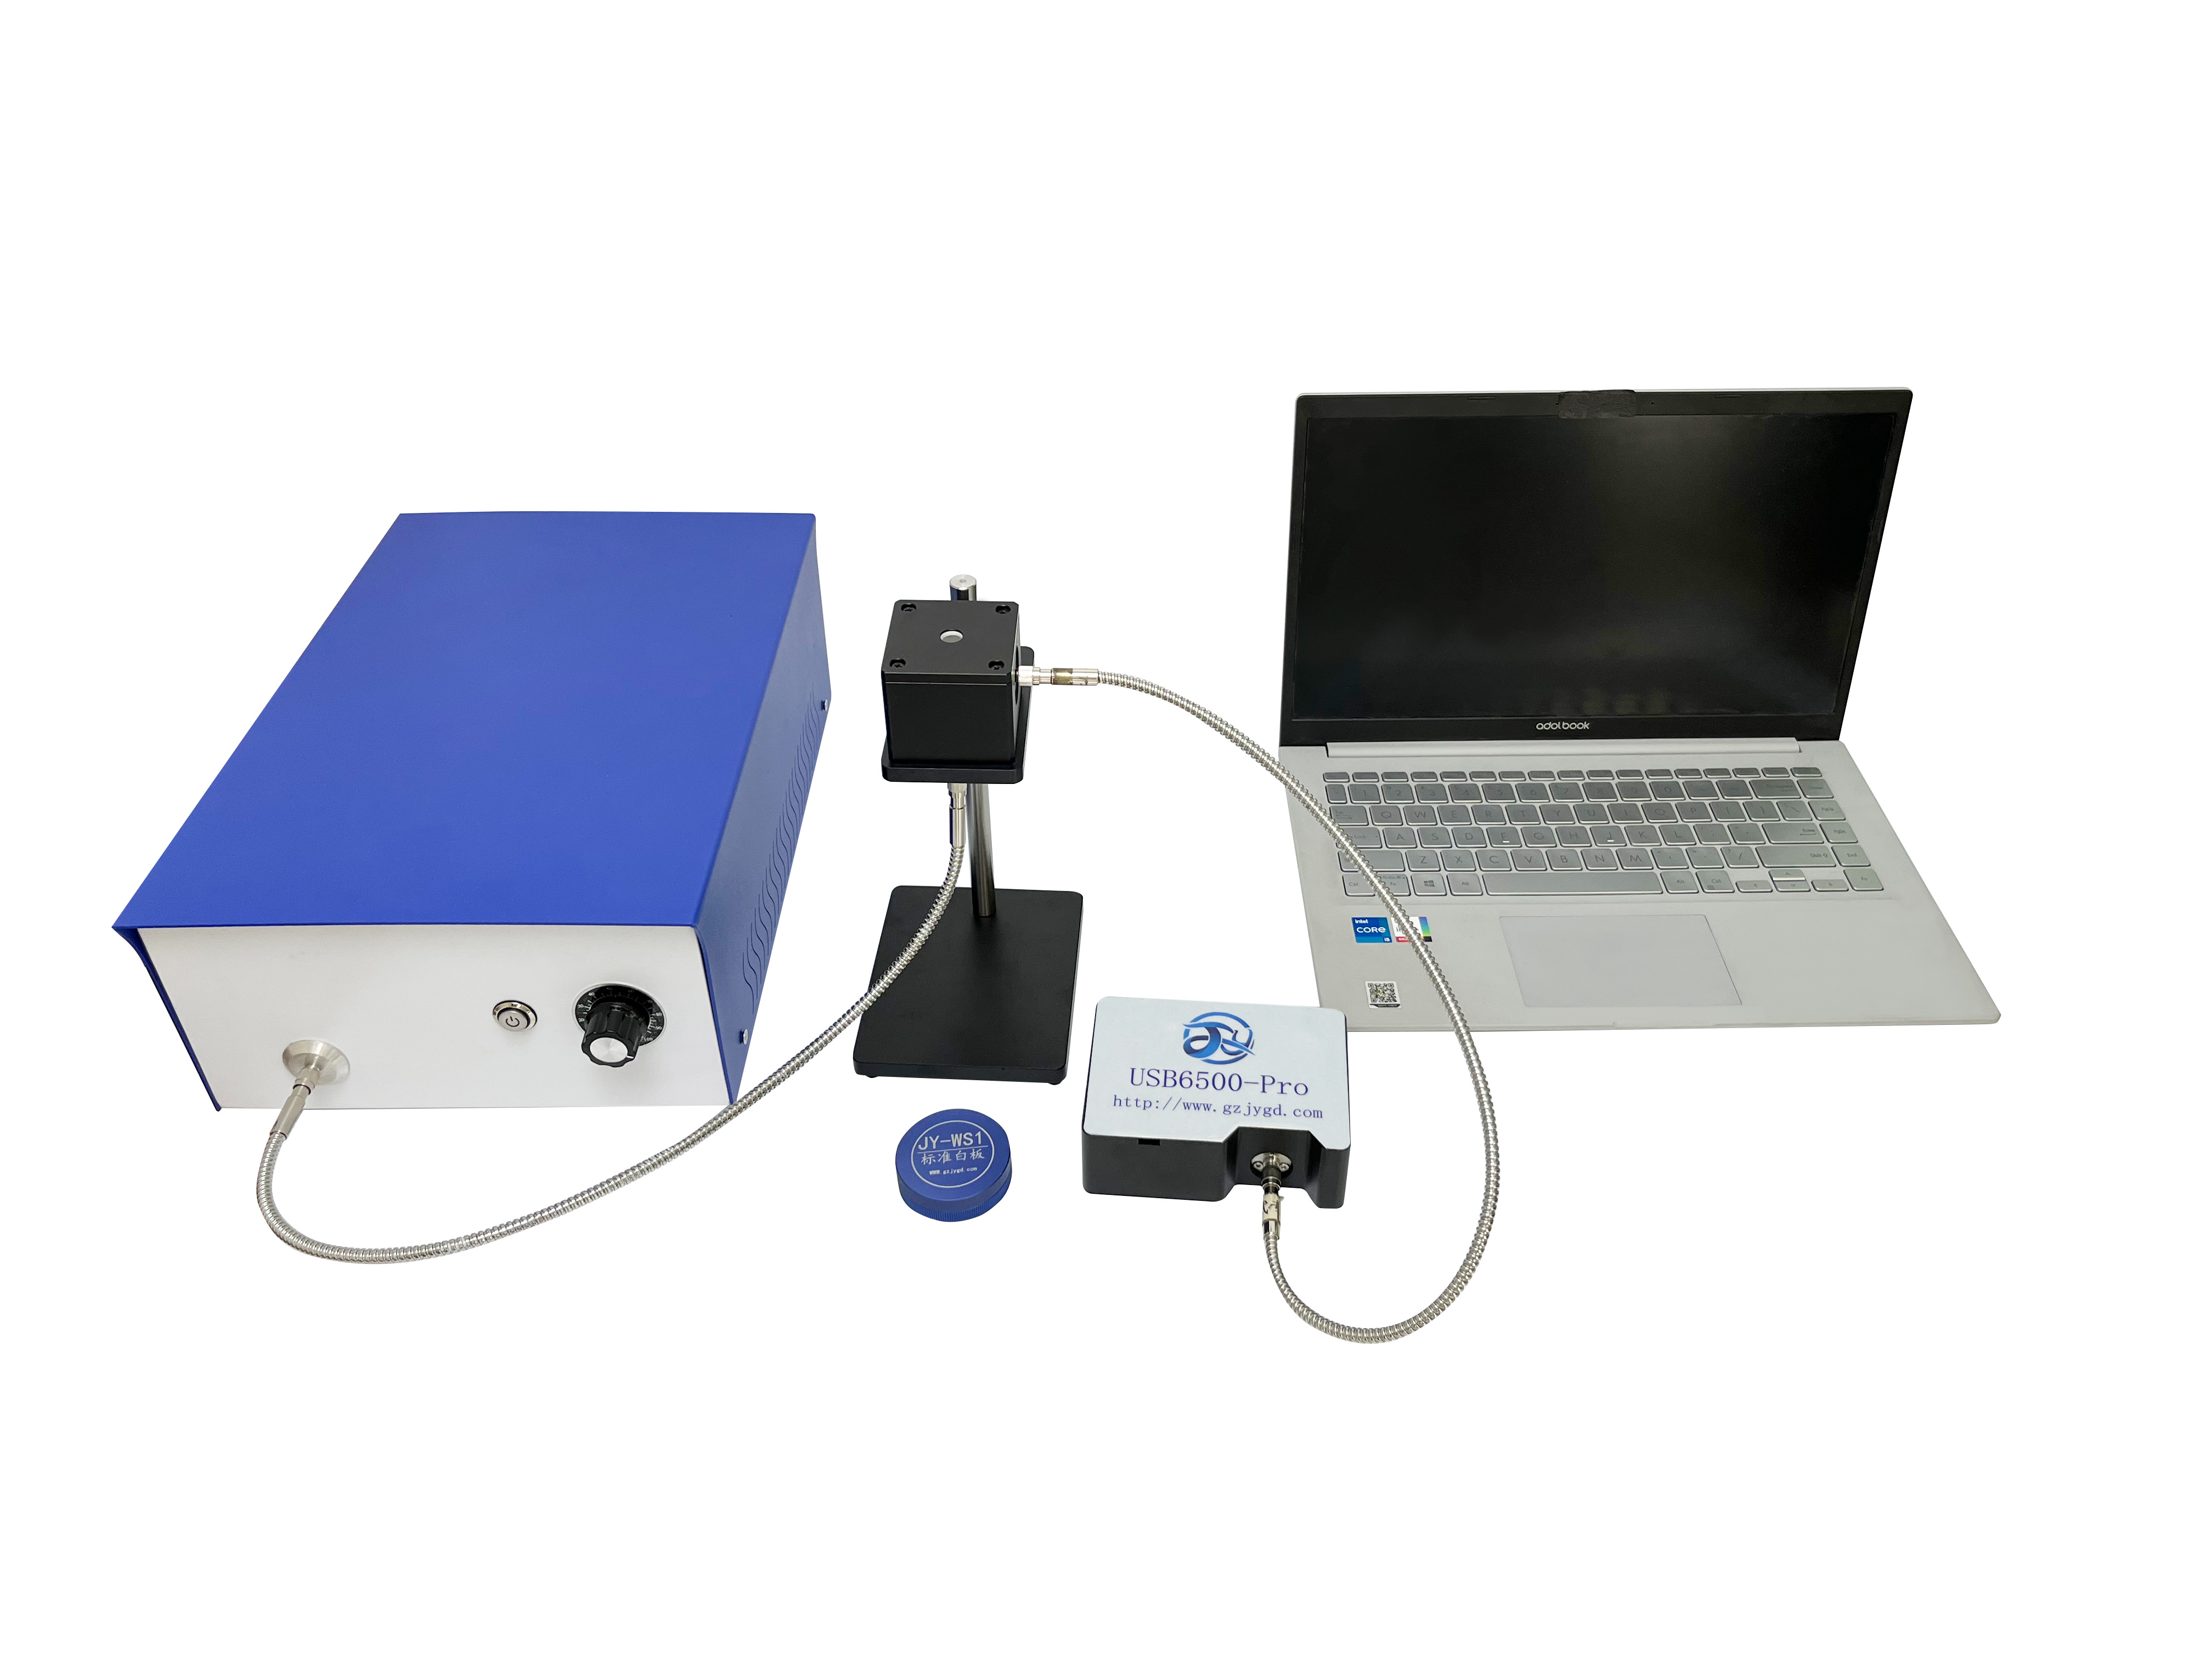
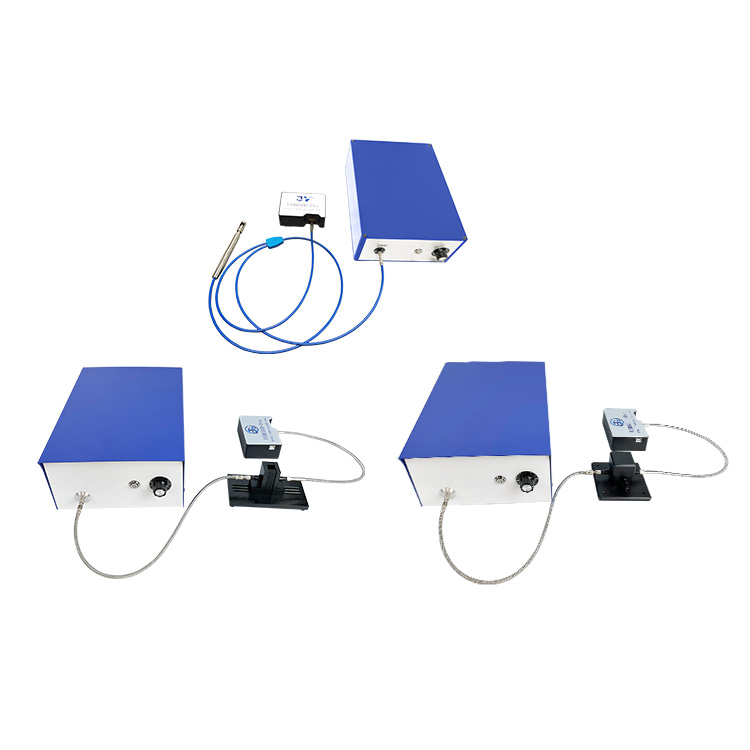
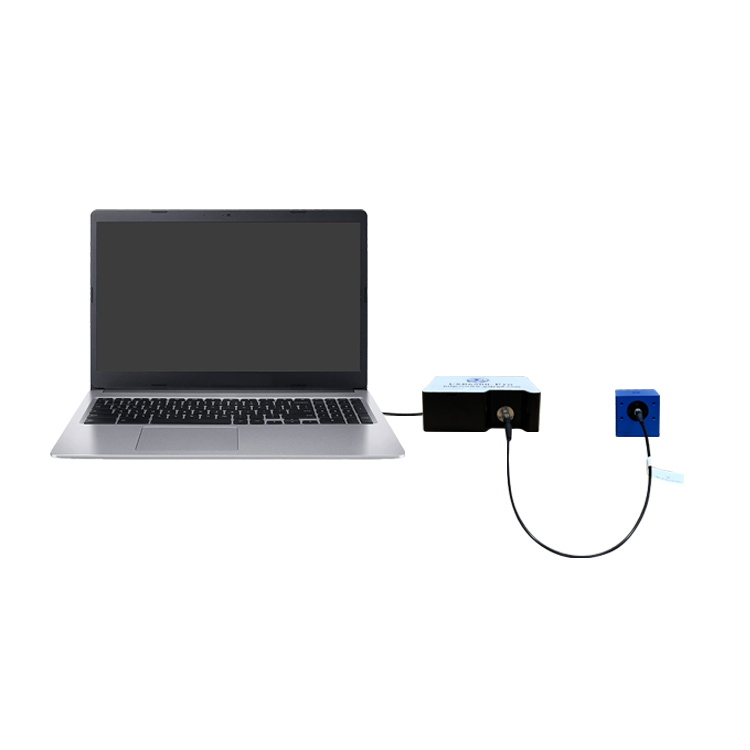
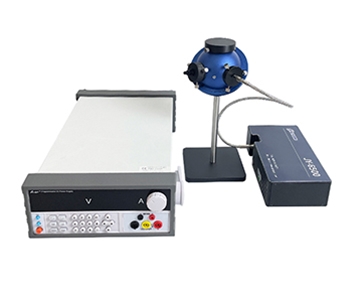
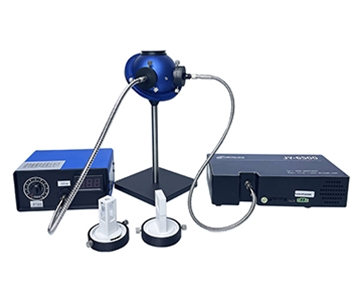
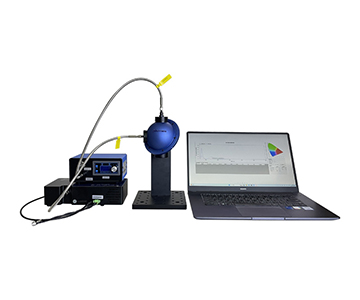
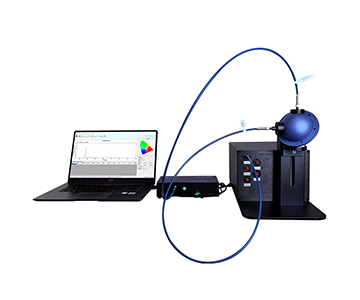
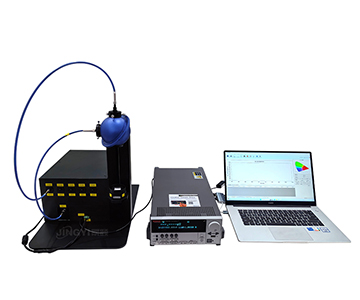
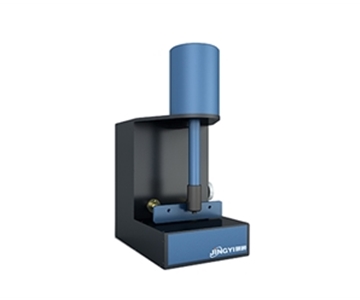
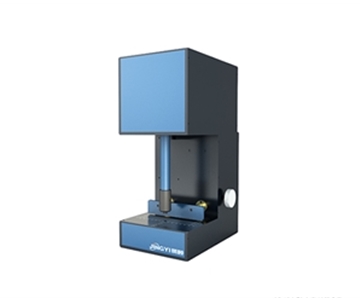
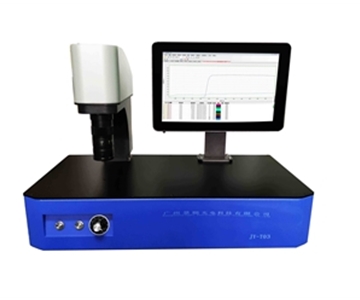
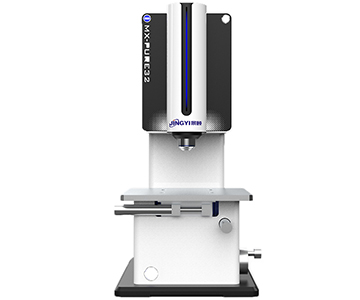
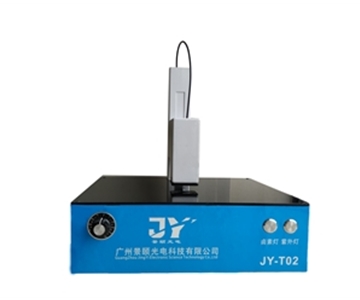
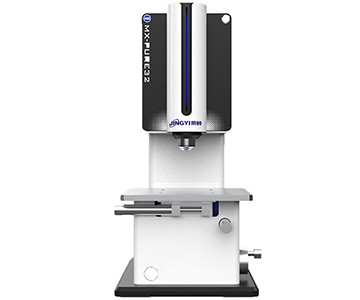
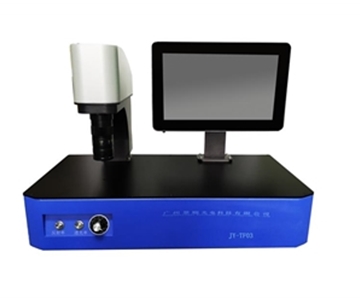
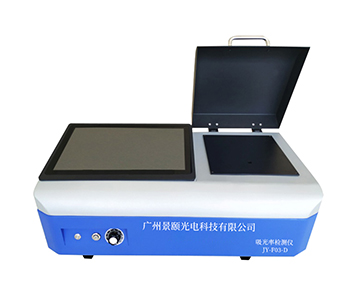
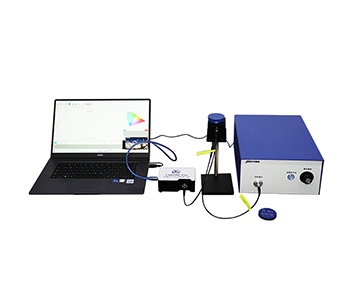
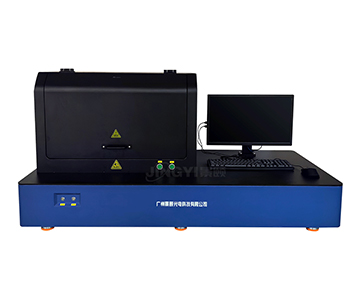
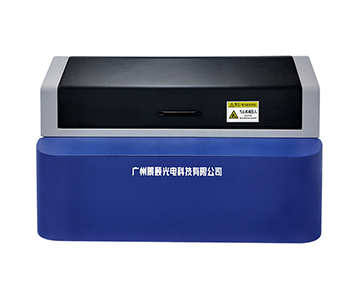
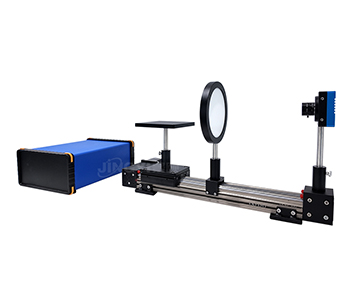
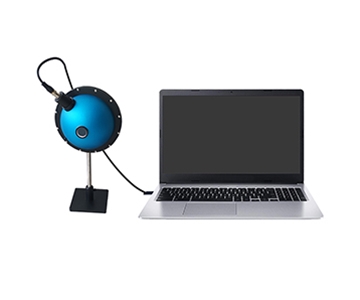
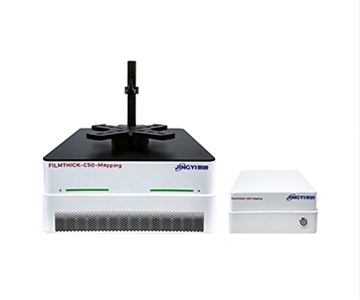
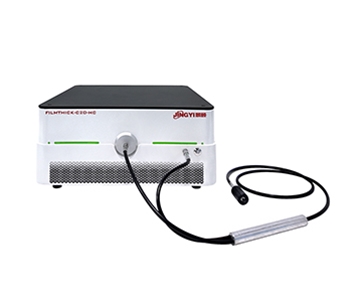
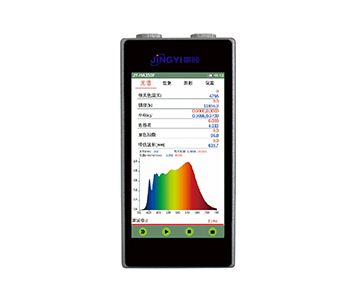
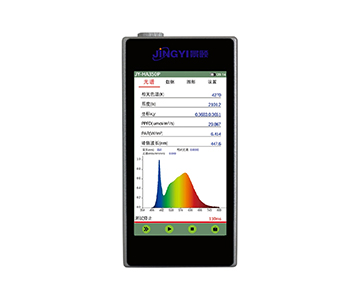
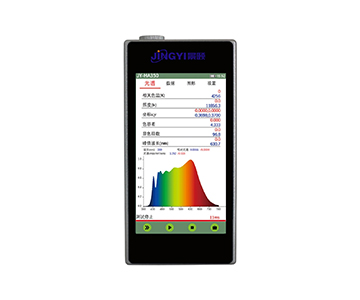
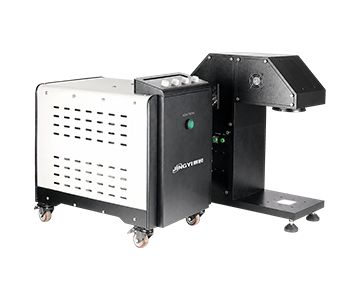
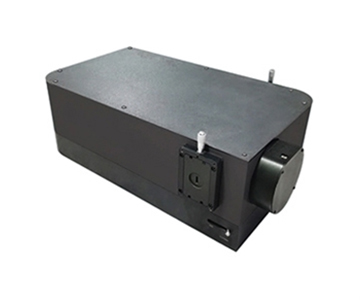
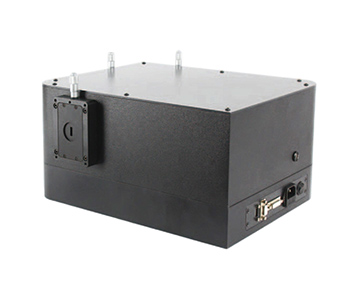
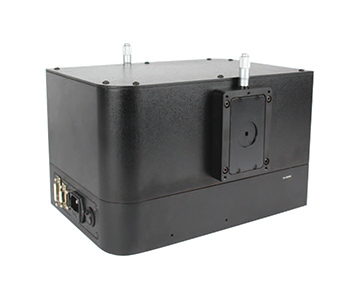
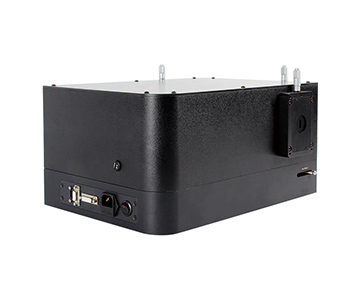
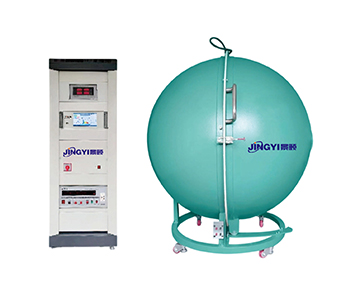
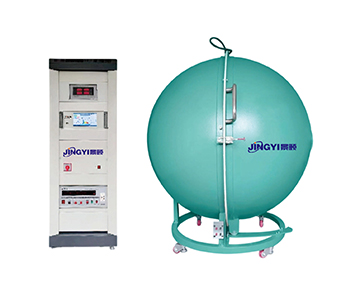
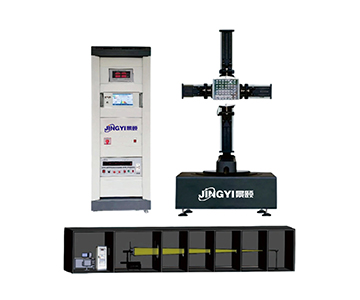
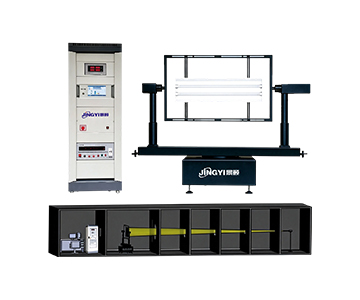
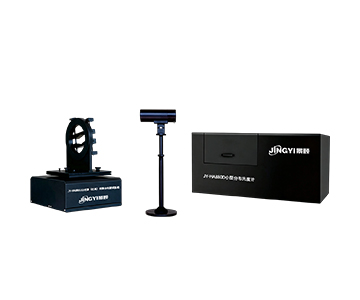
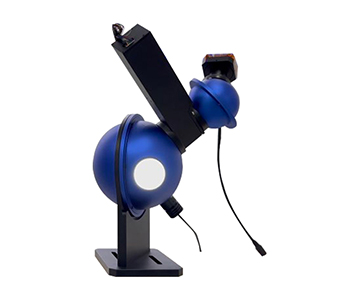
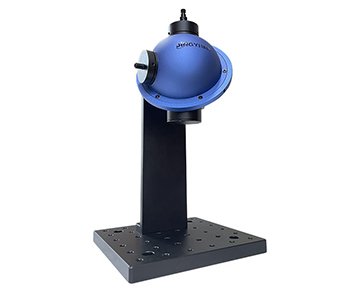
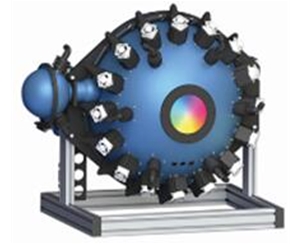
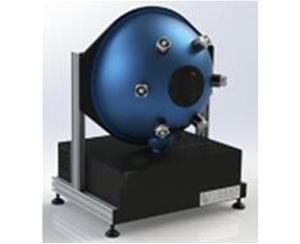
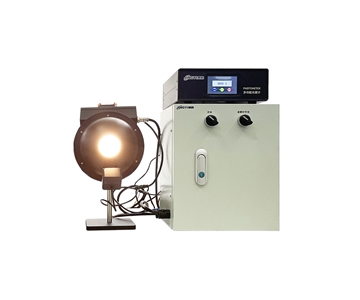
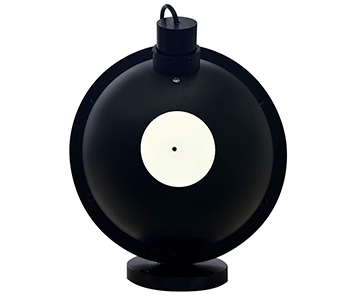
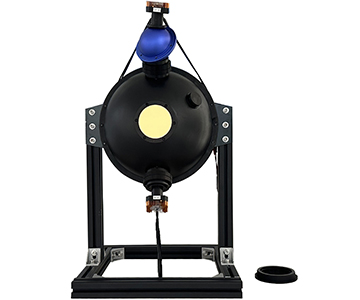
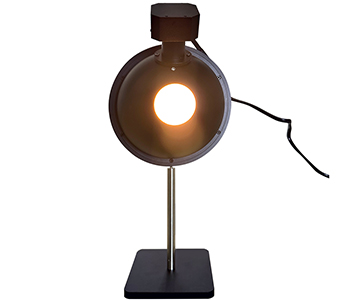
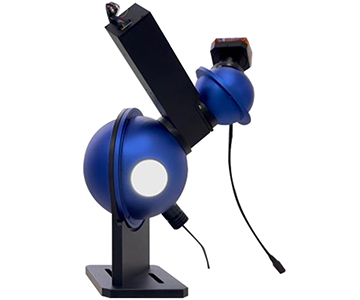
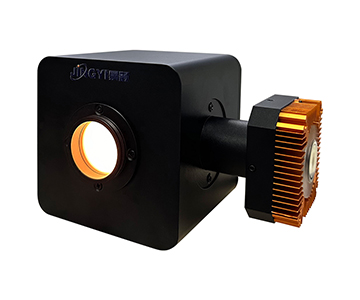
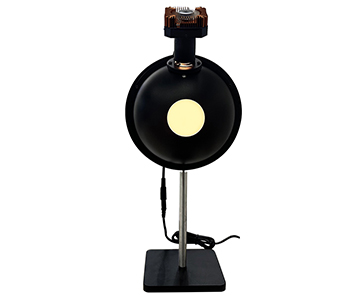
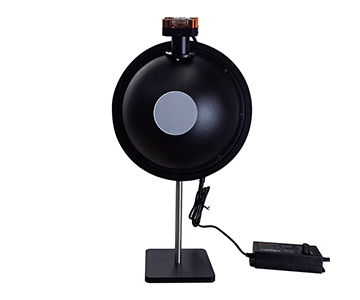
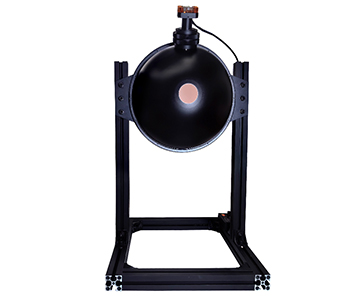
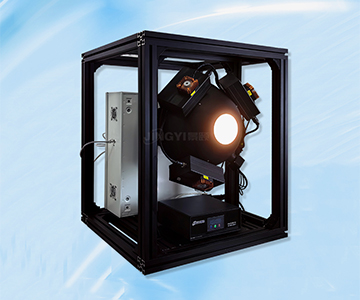
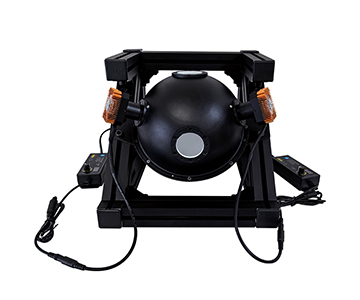
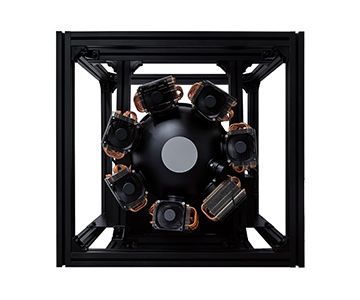
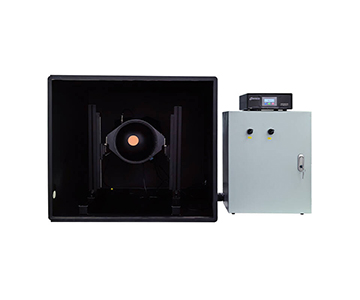
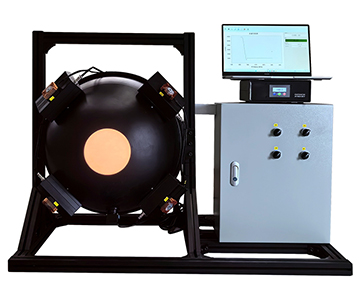
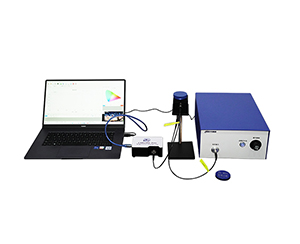
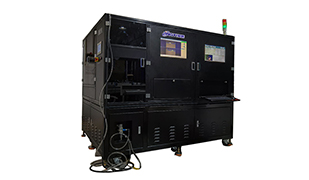
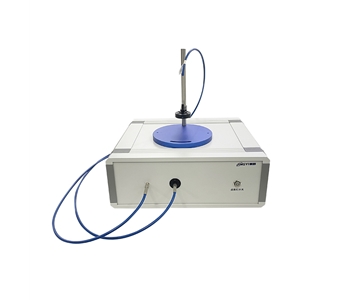
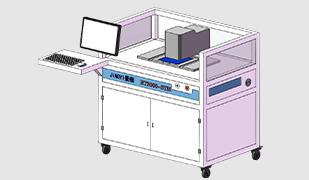
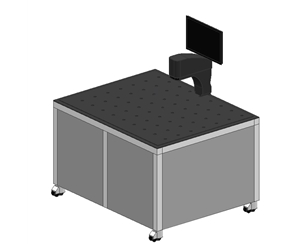
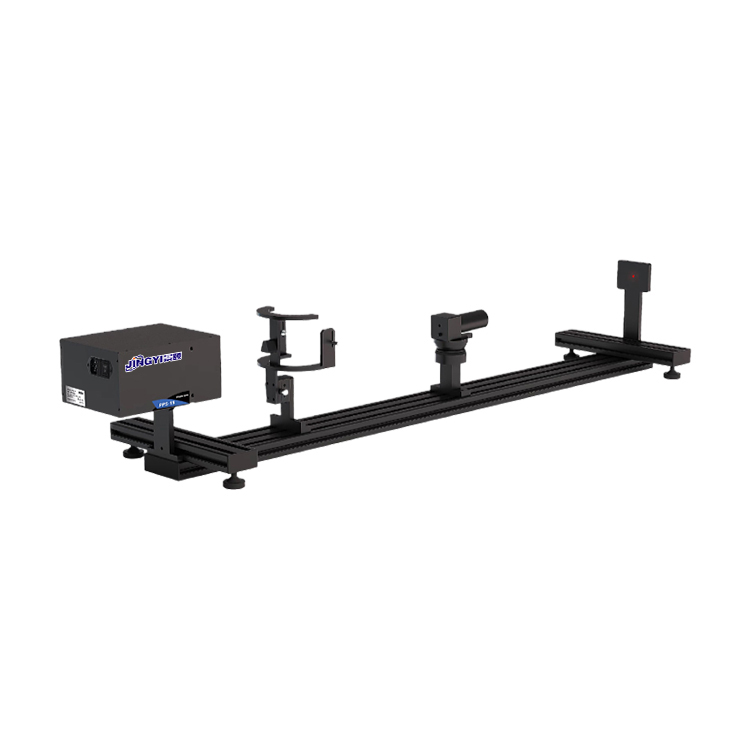
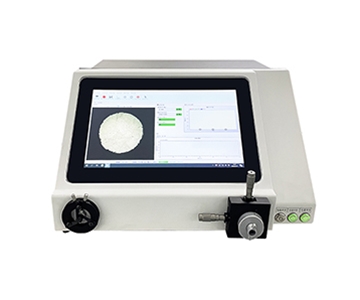
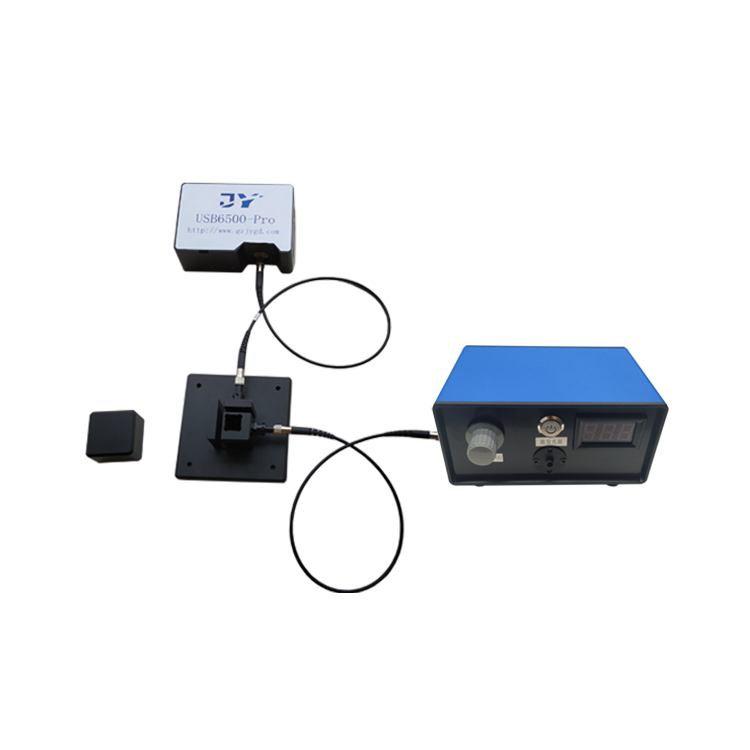
Jingyi’s product matrix spans both photoluminescence and electroluminescence lines: CHT-QE6500 follows an all-in-one concept; JY-QEY6500-PLS adds motorized lift; JY-QEY6500-PL features magnetic fixtures and near-infrared extension; JY-QEY6500-EL interfaces with source meters for device EQE.
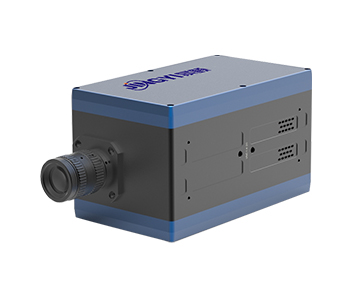
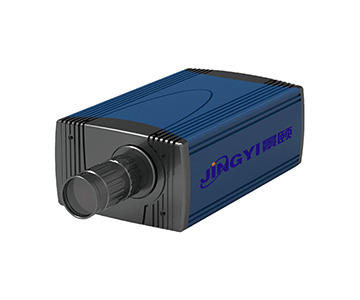
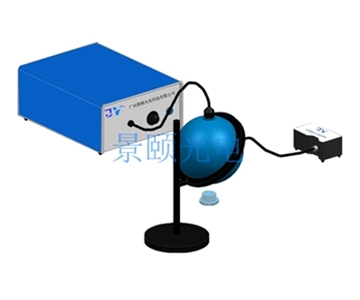
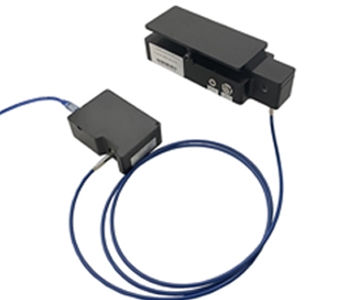
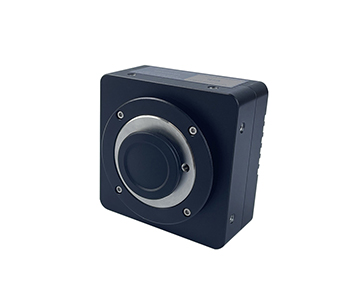
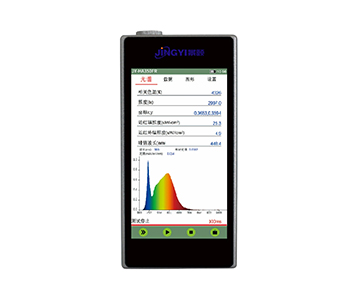
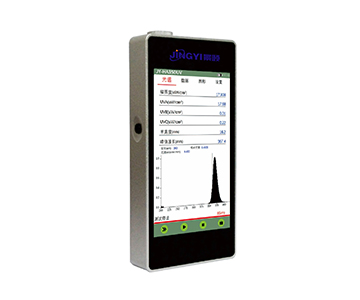
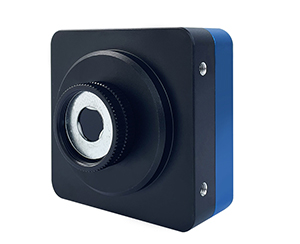
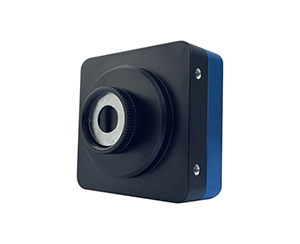
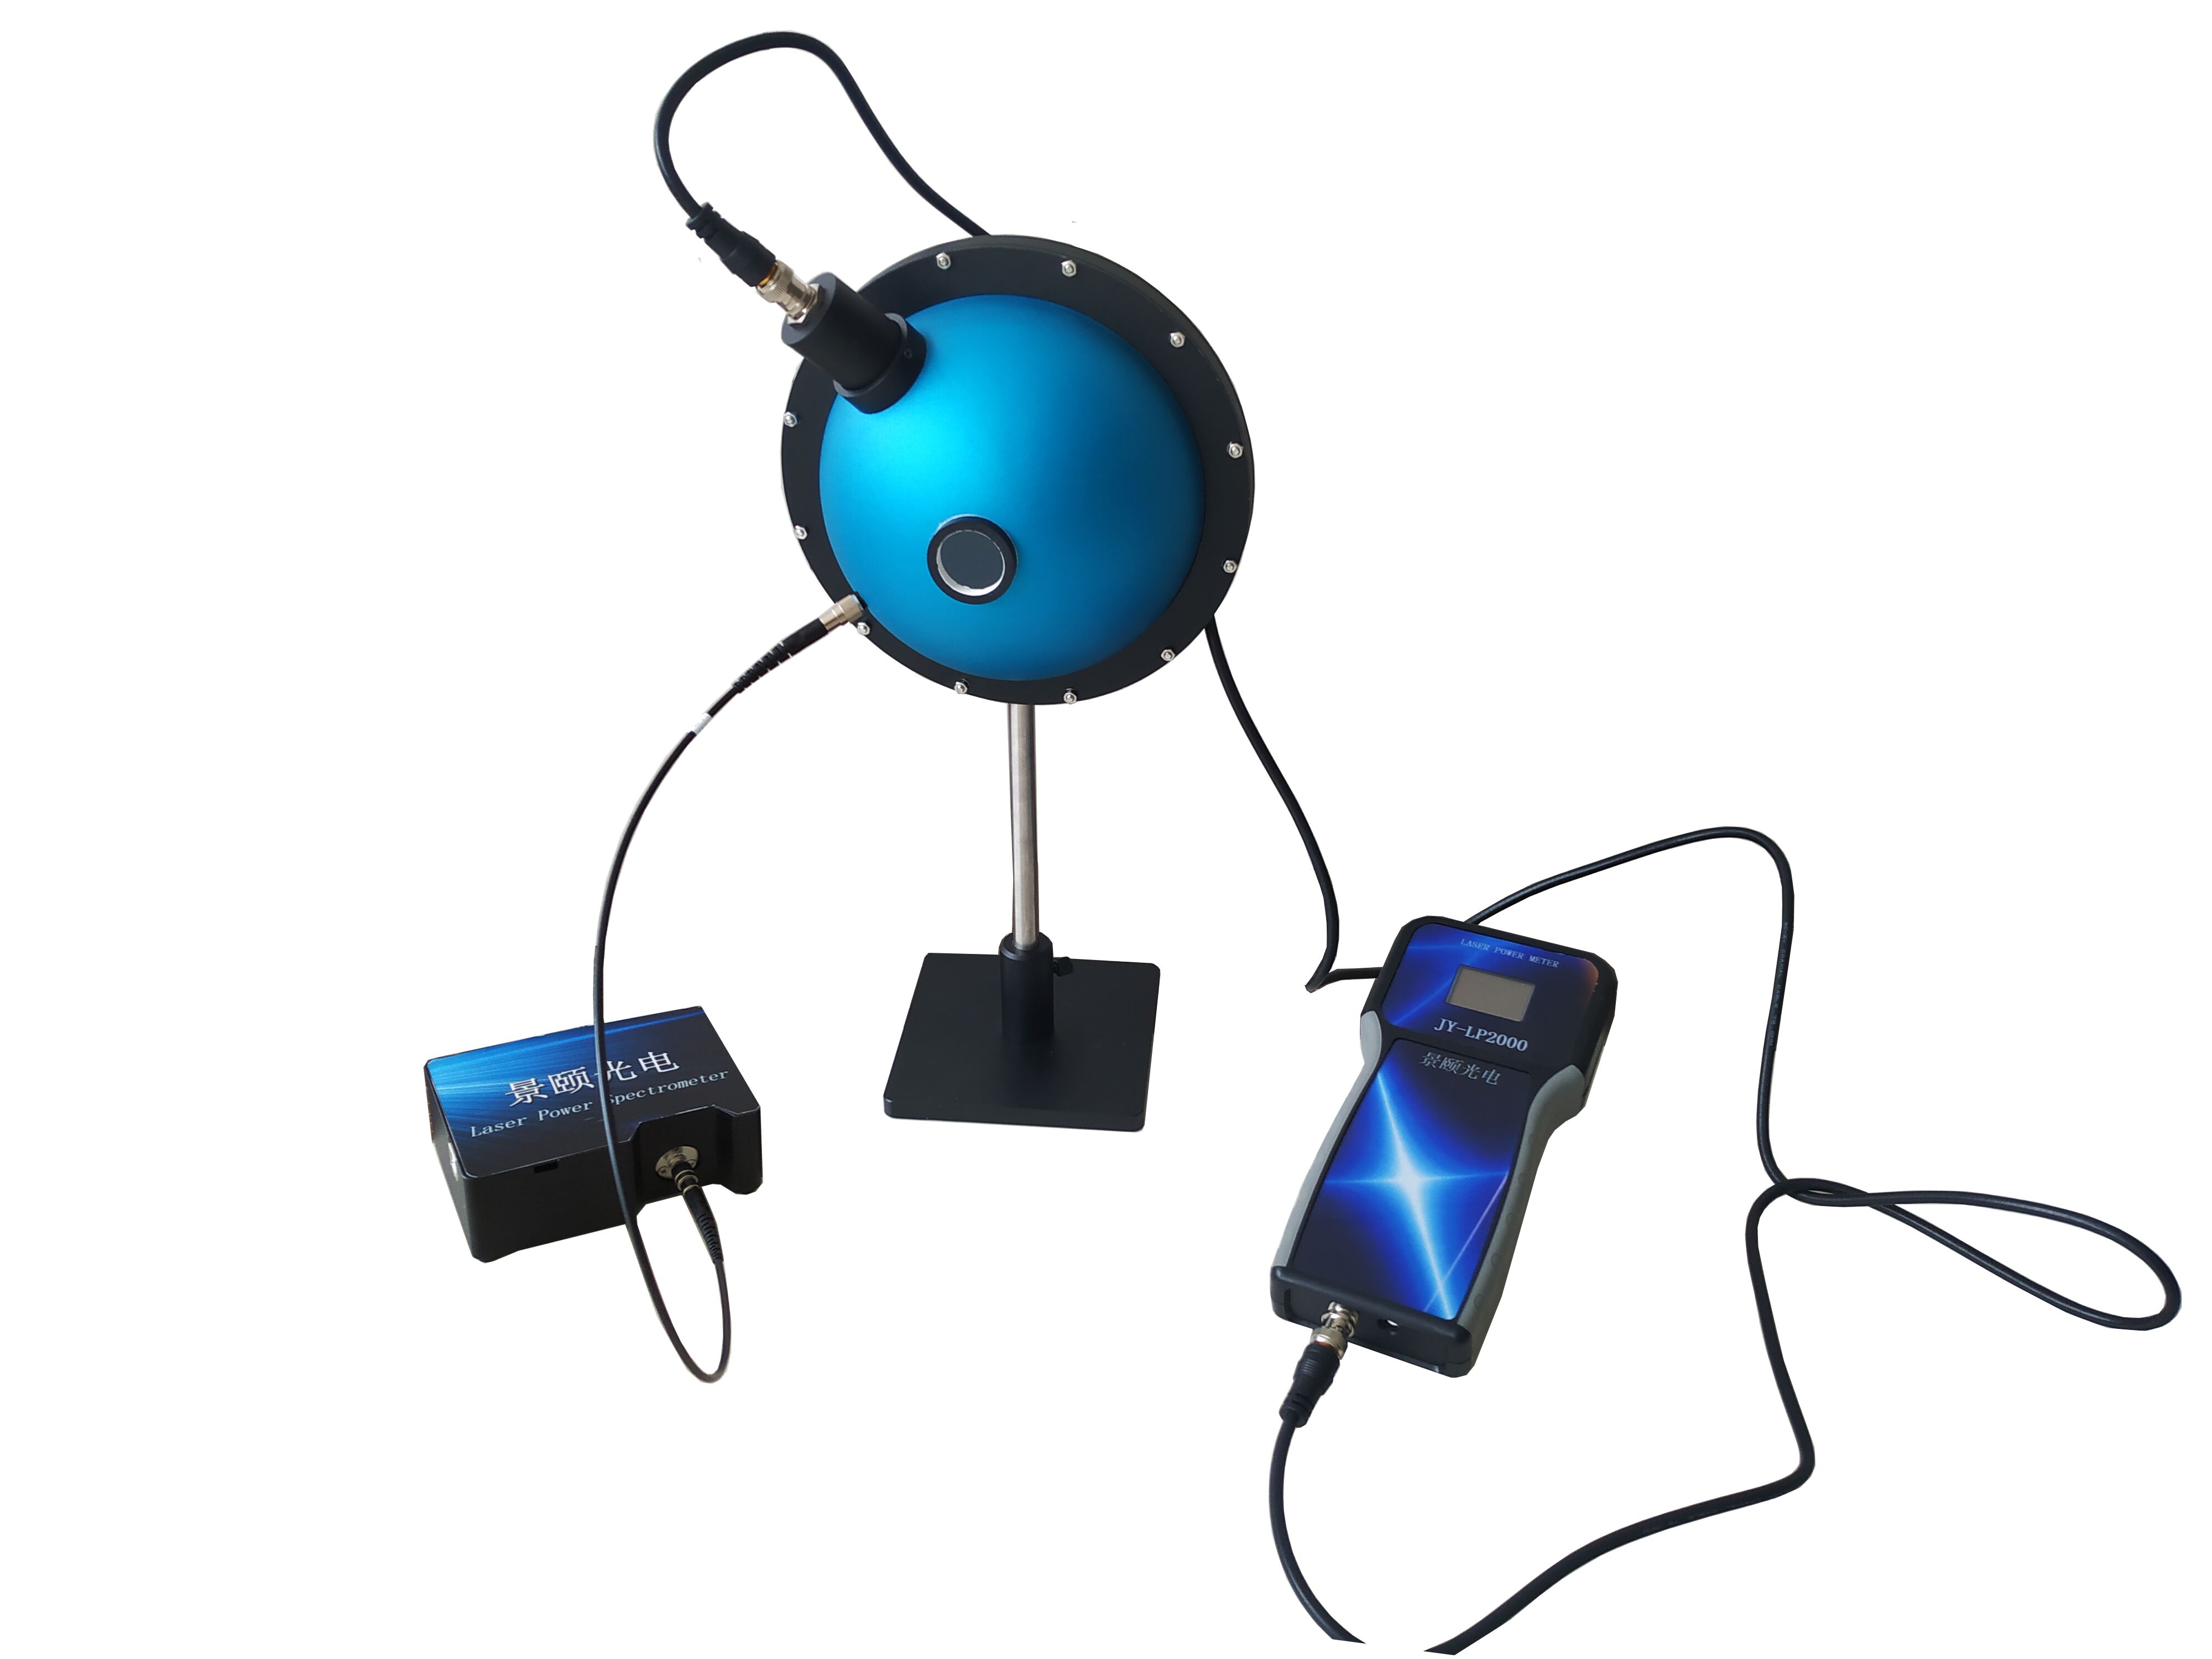
Team technical reserves manifest in three areas: self-sprayed PTFE sphere coating with reflectivity ≥99%, JY-6500 spectrometer with 16-bit AD and 85,000:1 dynamic range, and one-click software for scattering excitation deduction and PLQY calculation. From a technical reserve perspective, modular separation matters more than a single all-in-one unit—spectrometer, sphere, light source, and software can iterate independently.
Positioned in the mid-range domestic tier, university procurement contracts fall in the $48K–$52K range (approx. ¥350K–380K). This is one tier below Bentham and half a tier above white-label all-in-ones.
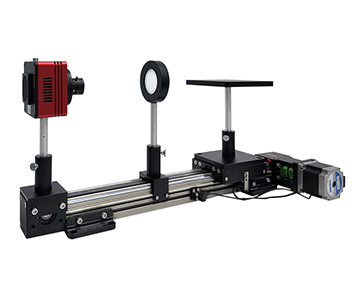
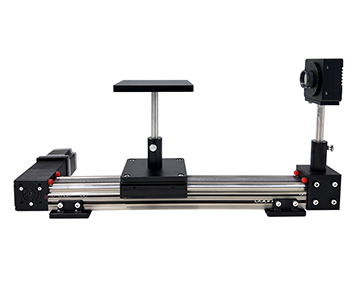
A documented case from Henan University of Science and Technology materials platform: JY-QEY6500-EL equipped with 2450/2460 source meters, heating/cooling stage, and motorized sample travel ≥100 mm, enabling film/powder/device switching on a single platform.
Service base in Guangzhou ensures responsive software training and calibration support. Suited for university materials departments, new energy materials groups, and display device pilot lines.
Best for: Solution/powder/film PLQY, OLED external quantum efficiency vs. current density, lab R&D to small-batch QA. Not suitable for: export automotive lighting certification reports (requires Instrument Systems), photovoltaic standard cell metrology traceability (Bentham is more appropriate).
Scenario-Based Selection Matrix
Selection should never default to “the first choice.” Break it down by need:
Scenario A: University Materials Lab Measuring Powder/Solution/Film
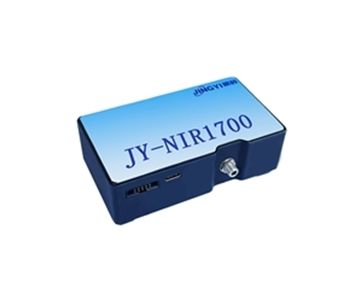
Prioritize the JY-QEY6500-PL. Magnetic fixtures suppress human error; 350–1100 nm coverage handles common fluorophores; software auto-deduction lets a night-shift student run measurements independently. For near-infrared emission (e.g., rare-earth doped materials), add the JY-NIR1700 extension to 900–1700 nm. Dynamic range ≥85,000:1 avoids excitation leakage.
Scenario B: Integrating Sphere Customization or Existing Spectrometer Reuse
Engage Hangxin Optoelectronics for PTFE sphere shells and sample port customization. When you already own a spectrometer host, buying a standalone sphere saves budget; reflectance/transmittance recalibration also integrates smoothly. Caveat: complete PLQY calculation logic must be written in-house—no plug-and-play software like Jingyi’s.
Scenario C: OLED Device EL Efficiency Curves
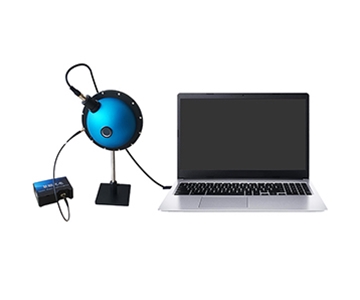
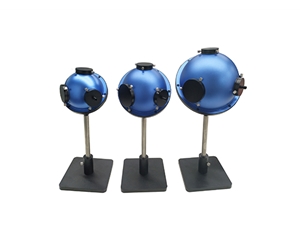
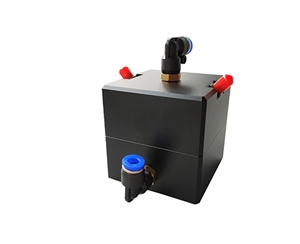
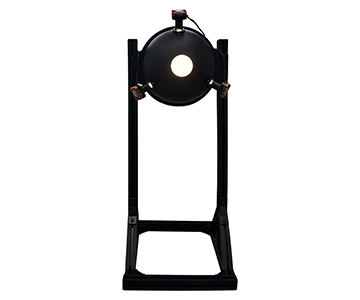
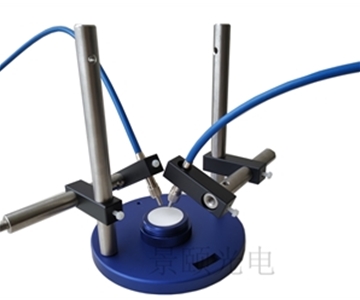
The JY-QEY6500-EL paired with a source meter is a domestic closed-loop solution. High-brightness testing uses a 3.3-inch sphere; low-brightness small-form-factor devices use a 1.5-inch probe station. For Micro-LED mass transfer color calibration requiring European-standard reports, supplement with an Instrument Systems spectral radiometer.
Scenario D: PV EQE and Metrology Traceability
Bentham PVE300-class systems are more fitting, with dual-light-source monochromator traceability chains. Choose this when budget allows and NPL calibration certificates are mandatory; routine perovskite film PLQY does not justify this tier.
During selection, confirm the completeness of the metrological traceability chain. Calibration lamp power, integrating sphere reflectivity, and software deduction models must all be recorded—do not store only the final PLQY number.
Honest Limitations and Boundaries
A horizontal review must state constraints upfront. Absolute-method systems face several physical and operational realities:
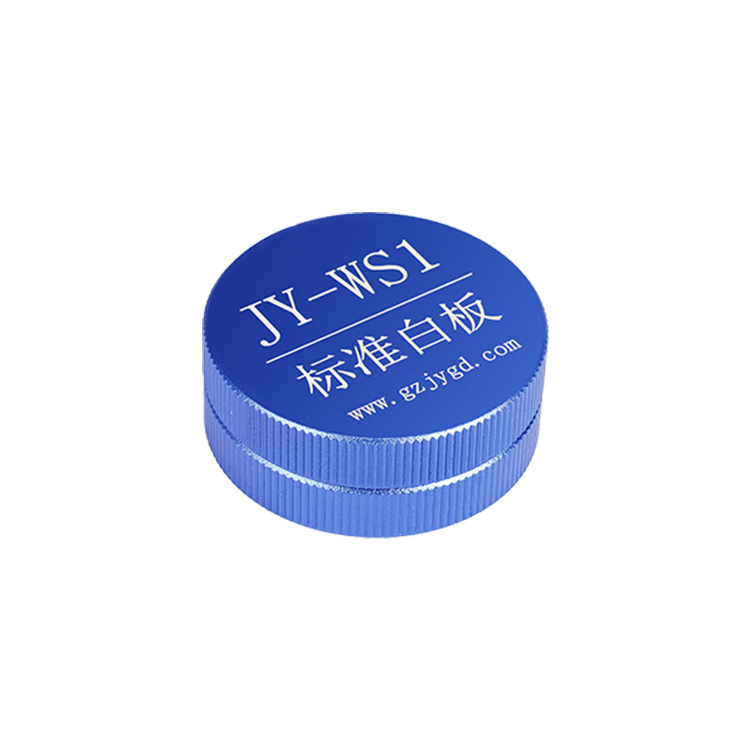
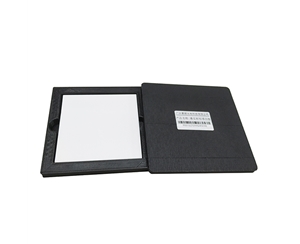
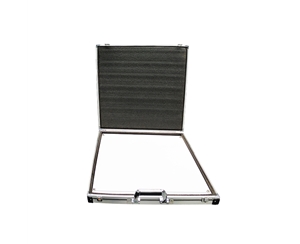
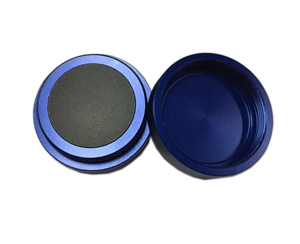
PTFE integrating spheres gradually adsorb sample dust or volatiles. When reflectivity drifts from 99% down to ~97%, PLQY absolute values shift by 0.02–0.05—a normal occurrence, not equipment failure. The coating requires periodic recalibration. Jingyi’s solution relies on traceable calibration lamps for re-standardization, but users must maintain a disciplined schedule.
EL solutions interfaced with source meters introduce variables beyond optics: source meter scan rate, device contact resistance, and probe station grounding all become error terms. The JY-QEY6500-EL with 2450/2460 source meters handles conventional OLEDs, but picosecond-level electroluminescence decay falls outside this system’s scope.
Near-infrared extension (900–1700 nm) broadens spectral coverage but degrades signal-to-noise ratio; InGaAs detector integration times lengthen, reducing production line throughput. This is not false advertising—it is a physical boundary.
International brands also carry boundaries: Instrument Systems software adaptation costs for local templates, Bentham spare parts lead times—all must be factored into procurement timelines.
Summary and Frequently Asked Questions
PLQY system selection fundamentally reduces to three axes: sample form, data purpose, and delivery cycle.
•Powder/solution/film R&D → Jingyi PL series
•Integrating sphere customization / reflectance recheck → Hangxin
•OLED device EQE → Jingyi EL series
•Photovoltaic metrology traceability → Bentham
•Automotive lighting certification reports → Instrument Systems
Do not chase the highest spec; chase sample-swap repeatability and after-sales responsiveness.
Q1: How should powder samples be placed to minimize error?
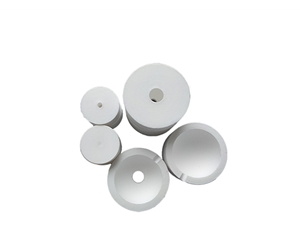
Use dedicated powder sample cells. Magnetic homing outperforms manual placement. Perform empty sphere correction once per batch; avoid repositioning samples repeatedly within the same batch.
Q2: What causes artificially high PLQY results?
Common culprits: un‑deducted excitation light leakage, contaminated integrating sphere, and sample photobleaching. First verify whether the software performs scattering excitation deduction.
Q3: Is a source meter mandatory for EL testing?
Measuring external quantum efficiency versus current density absolutely requires a source meter. Pure spectral measurement can operate without one, but EQE calculation demands synchronized voltage and current sampling.
Q4: Which vendor fits a $50K budget?
For university PLQY, select Jingyi JY-QEY6500-PL. If you already own a spectrometer and only need a sphere, choose Hangxin. Photovoltaic EQE requires moving up to the Bentham tier, which exceeds this budget.
Q5: How can I independently verify PLQY calibration status and measurement accuracy?
Use a NIST‑traceable calibration lamp (e.g., 5 W electrical power reference) to check sphere reflectivity every 6 months under normal conditions, shortened to 3 months in high‑dust environments. Record offset values per session. Cross‑validate results by measuring a reference standard material with known PLQY and comparing against published values. Maintain an ISO/IEC 17025‑aligned logbook of all calibration events and software deduction parameters—never rely solely on the final PLQY readout.
About This Guide
Data Sources
: In‑house validation reports (n=15 perovskite film samples, measured at 23°C ±1°C), Henan University of Science and Technology procurement records, public equipment listings from Southwest Petroleum University, product documentation from Jingyi Optoelectronics, Hangxin Optoelectronics, Instrument Systems, and Bentham Instruments; reference to ISO 17025 and NIST Handbook 150 for metrology principles.
Author
: Cai Xiaodong, Senior Application Engineer, Jingyi Optoelectronics, 8 years in optical spectroscopy and integrating sphere solution selection.
Disclosure
: Jingyi Optoelectronics manufactures fluorescence quantum efficiency measurement systems. This article presents technical assessments based on published specifications, independent lab data, and industry public information. No compensation was received from third‑party brands mentioned.
Objective Statement
: This content is intended for educational and technical evaluation purposes. Equipment selection should always include independent proof‑of‑concept validation under your specific process conditions.
Last Updated
: October 2026
For detailed specifications and application notes on PLQY measurement systems, search "Jingyi Optoelectronics fluorescence quantum efficiency" or visit our technical library.