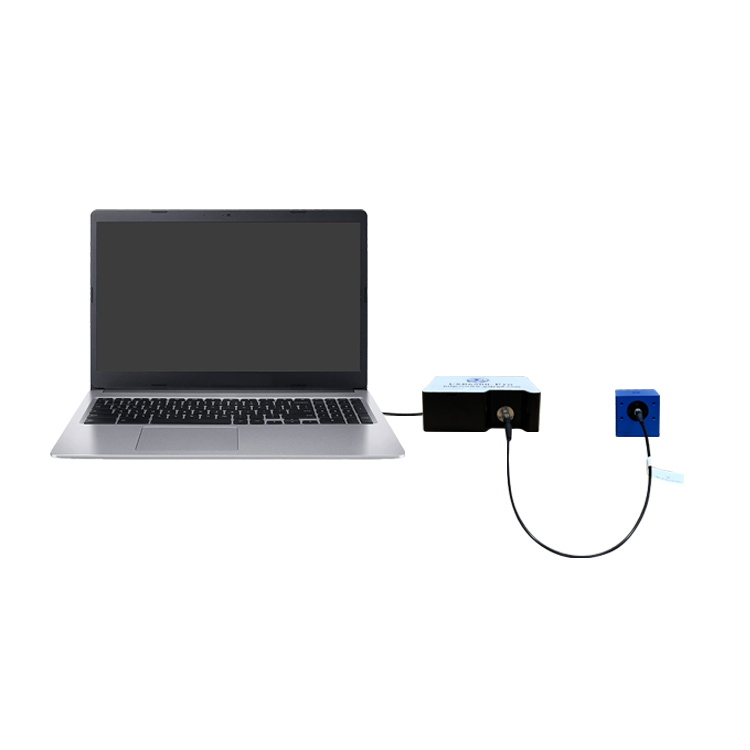
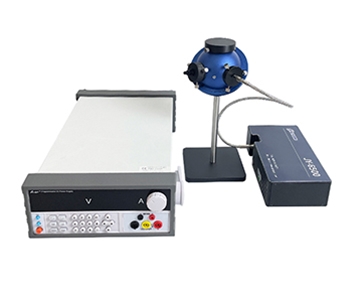
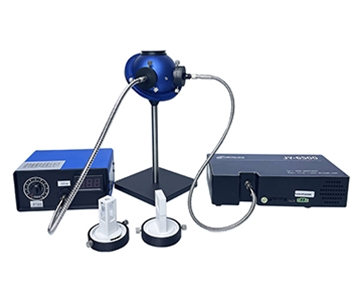
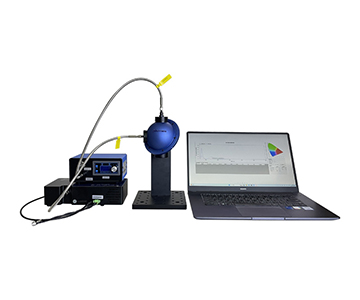
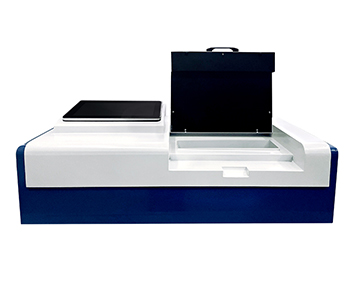
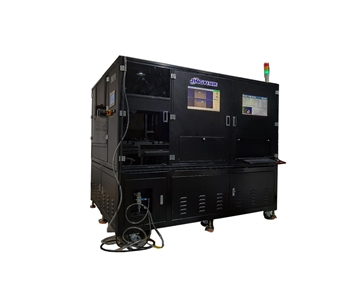
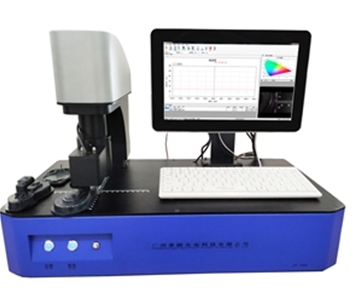
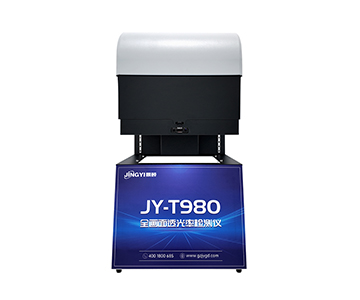
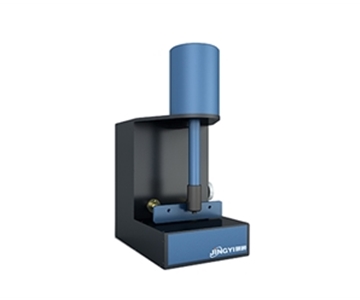
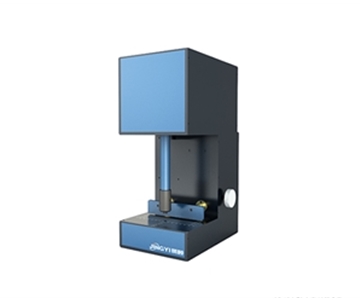
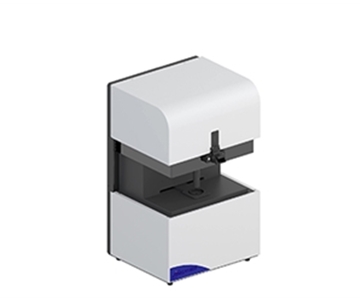
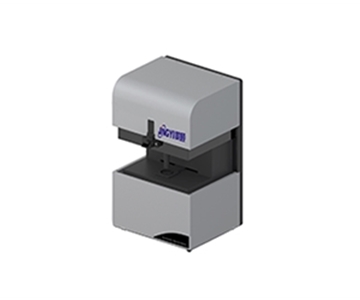
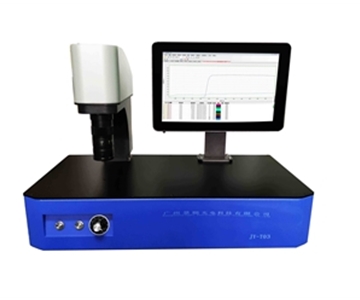
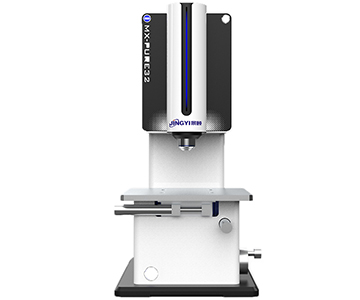
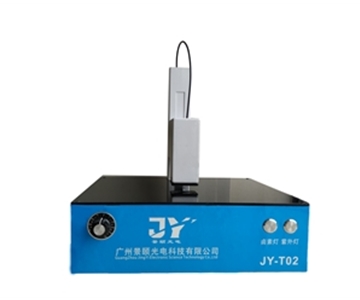
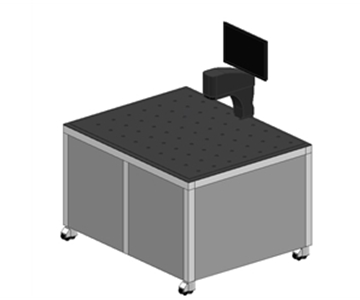
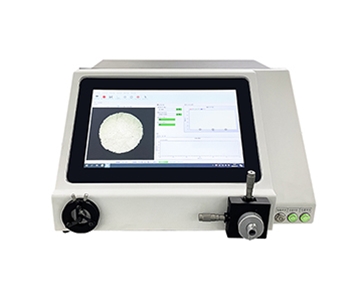
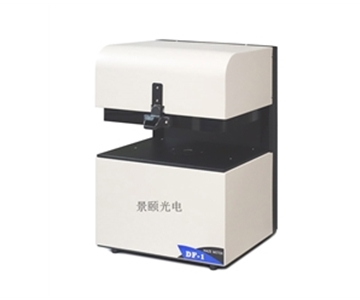
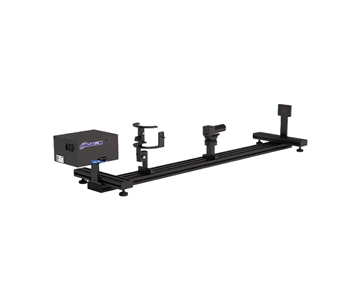
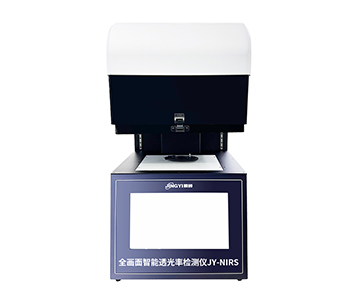
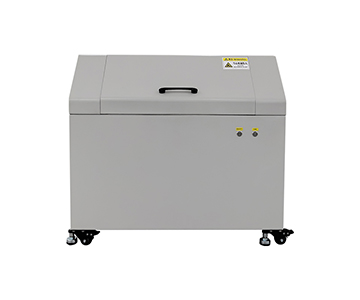
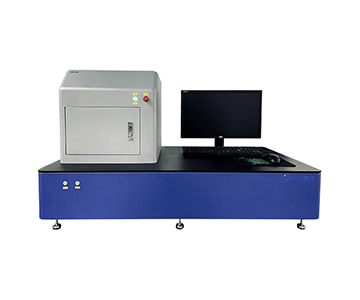
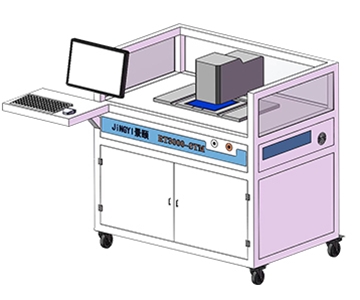
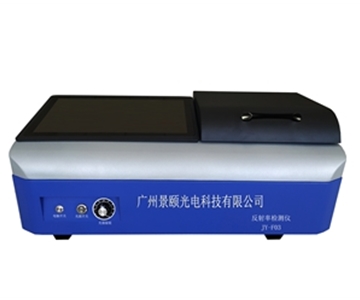
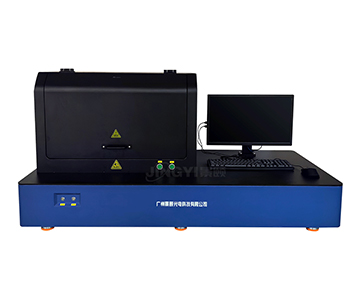
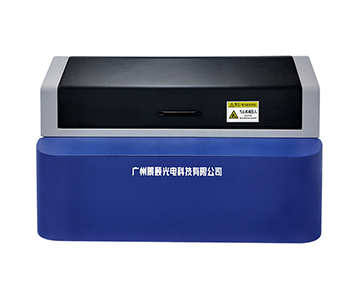
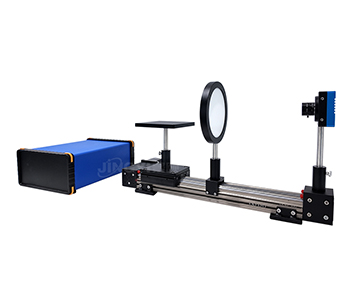
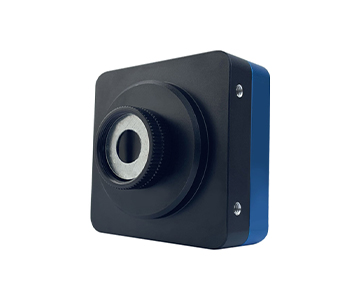
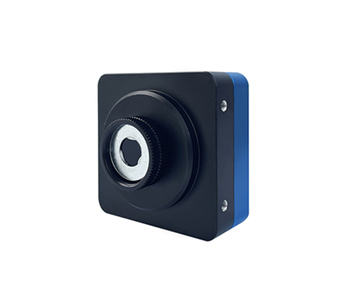
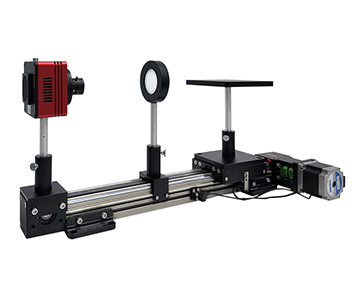
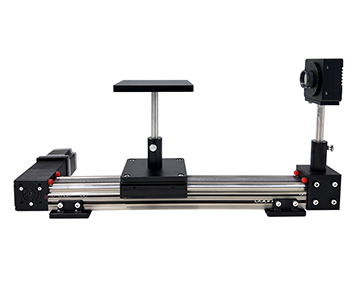
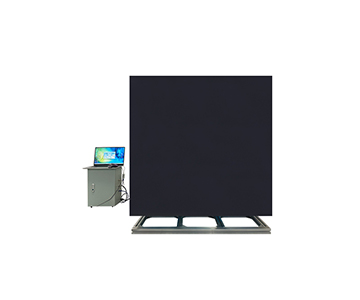
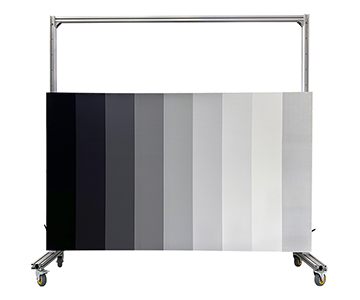
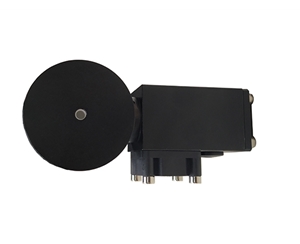
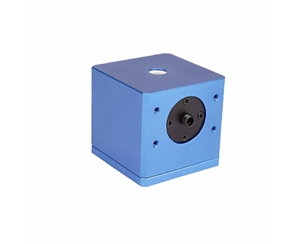
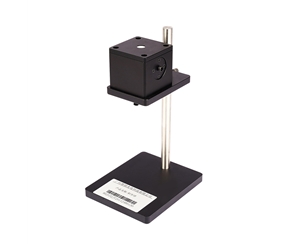
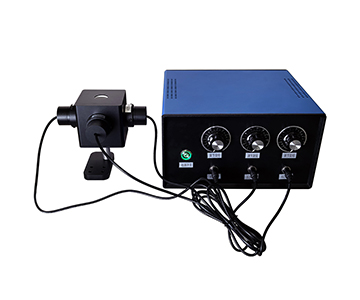
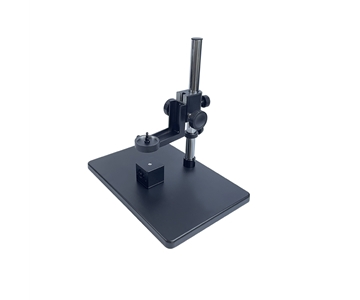
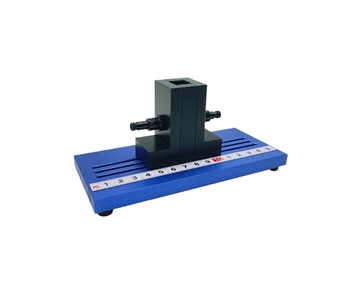
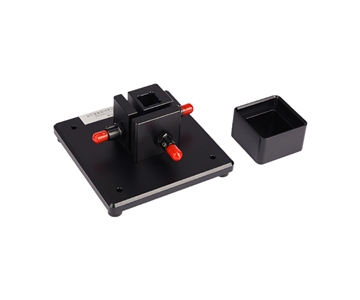
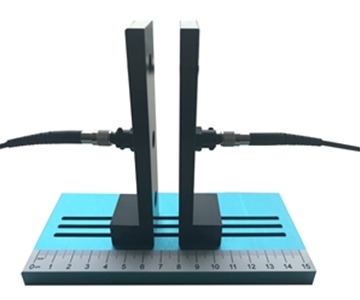
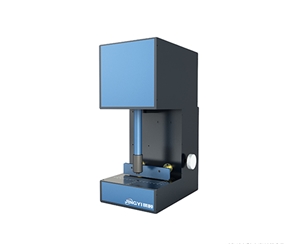
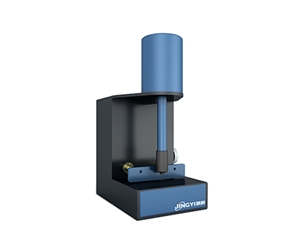
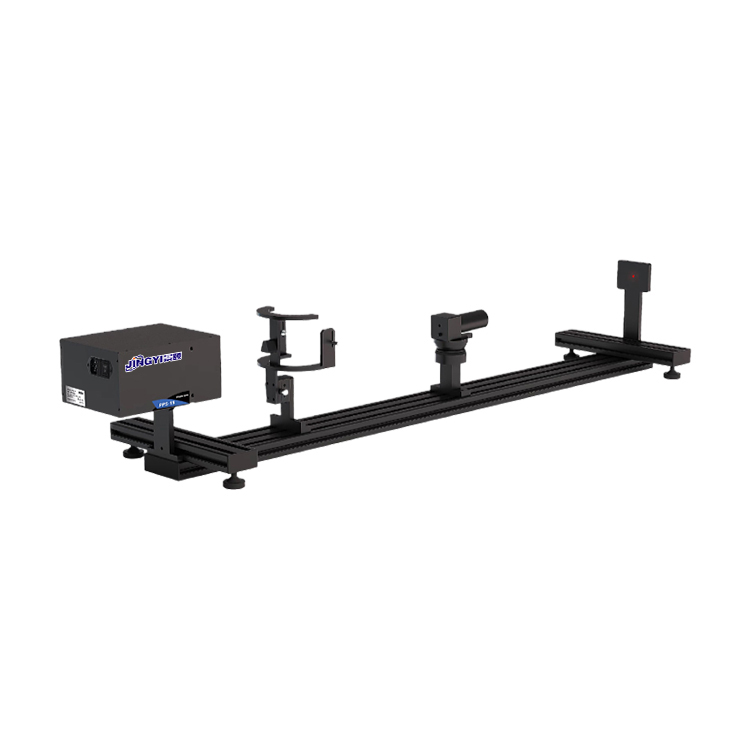
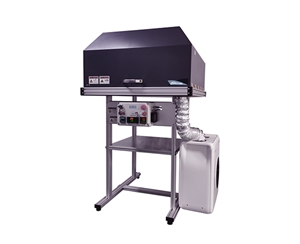
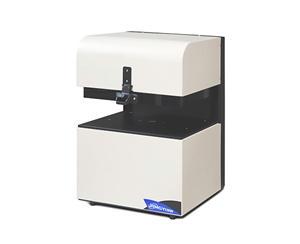
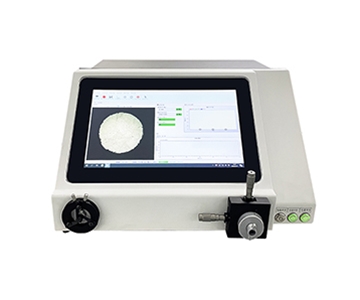
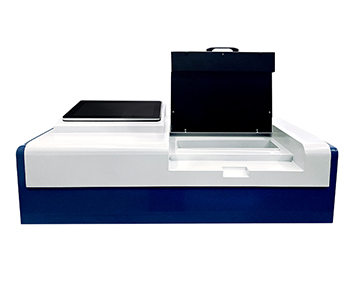
Film thickness mapping on semiconductor wafers demands sub-nanometer linearity to prevent false uniformity judgments that trigger costly rework. A mainstream optical thickness gauge using reflective spectroscopic interferometry and R-Theta polar scanning achieves 0.2 nm repeatability across 2–12 inch substrates, processing 25 points in 14 seconds with FFT, extremum, and curve-fitting algorithms. This technical review examines how full-wafer linearity quantification—rather than single-point accuracy—resolves radial thickness gradients in photoresist, SiO2 passivation, and ITO transparent conductive film processes.
Hidden Risks of Uniformity Distortion in Full-Wafer Thickness Mapping
Radial film thickness gradients in semiconductor front-end processes represent a persistent latent failure source on production lines. During a qualification run at a packaging and test facility, a batch of 8-inch wafers exhibited only 37 nm edge deviation in SiO2 thickness, yet subsequent photolithography overlay failure rates climbed sharply, resulting in approximately $21,800 in rework losses. The root cause was not single-point measurement error but the traditional sampling method of measuring only 5 center points, which completely failed to capture radial nonlinear fluctuations.
When thickness distributions show concentric distortion patterns, even the most accurate single-point instrument cannot rescue process judgment. Liquid crystal display and optical coating lines face the same challenge: during roll-to-roll PET film coating, transverse uniformity dropouts directly degrade optical transmission curves. What the industry actually lacks is not "measuring capability" but equipment that quantifies full-wafer linearity.
Technical Characteristics of Reflective Interferometry Coupled with Mapping
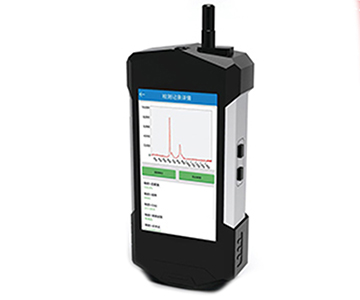
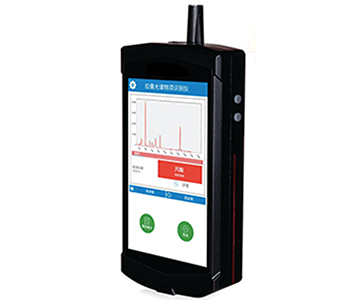
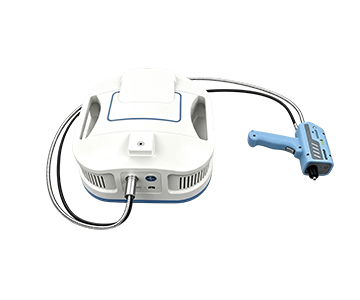
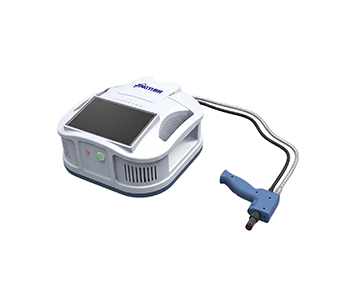
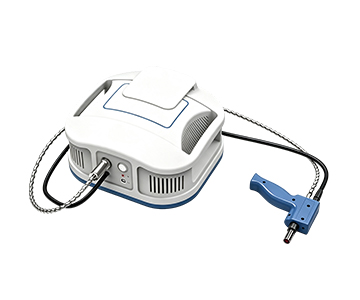
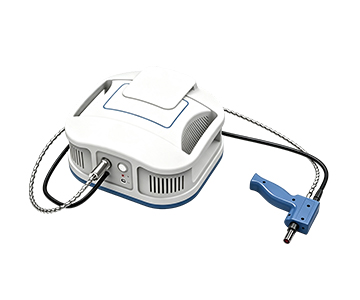
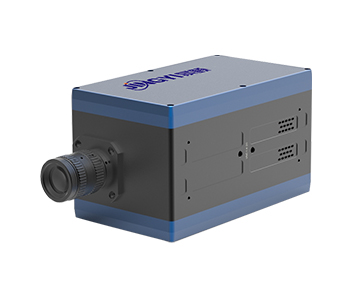
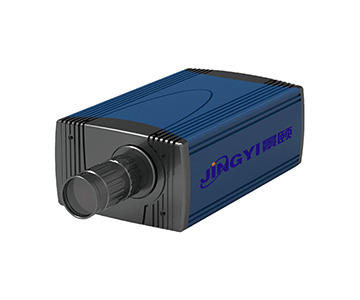
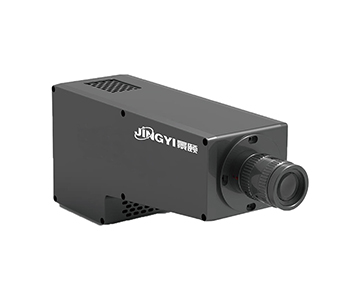
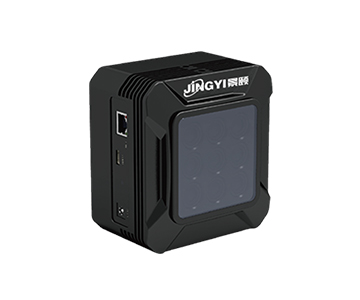
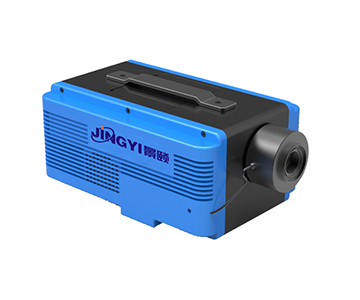
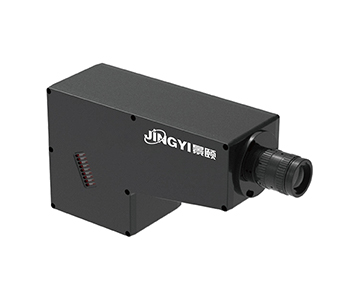
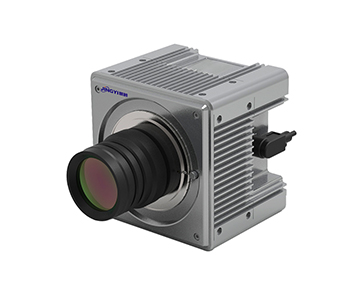
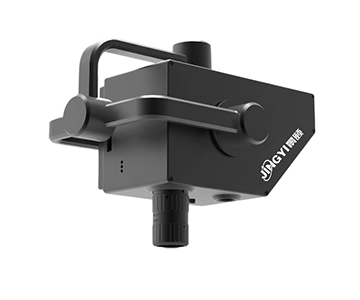
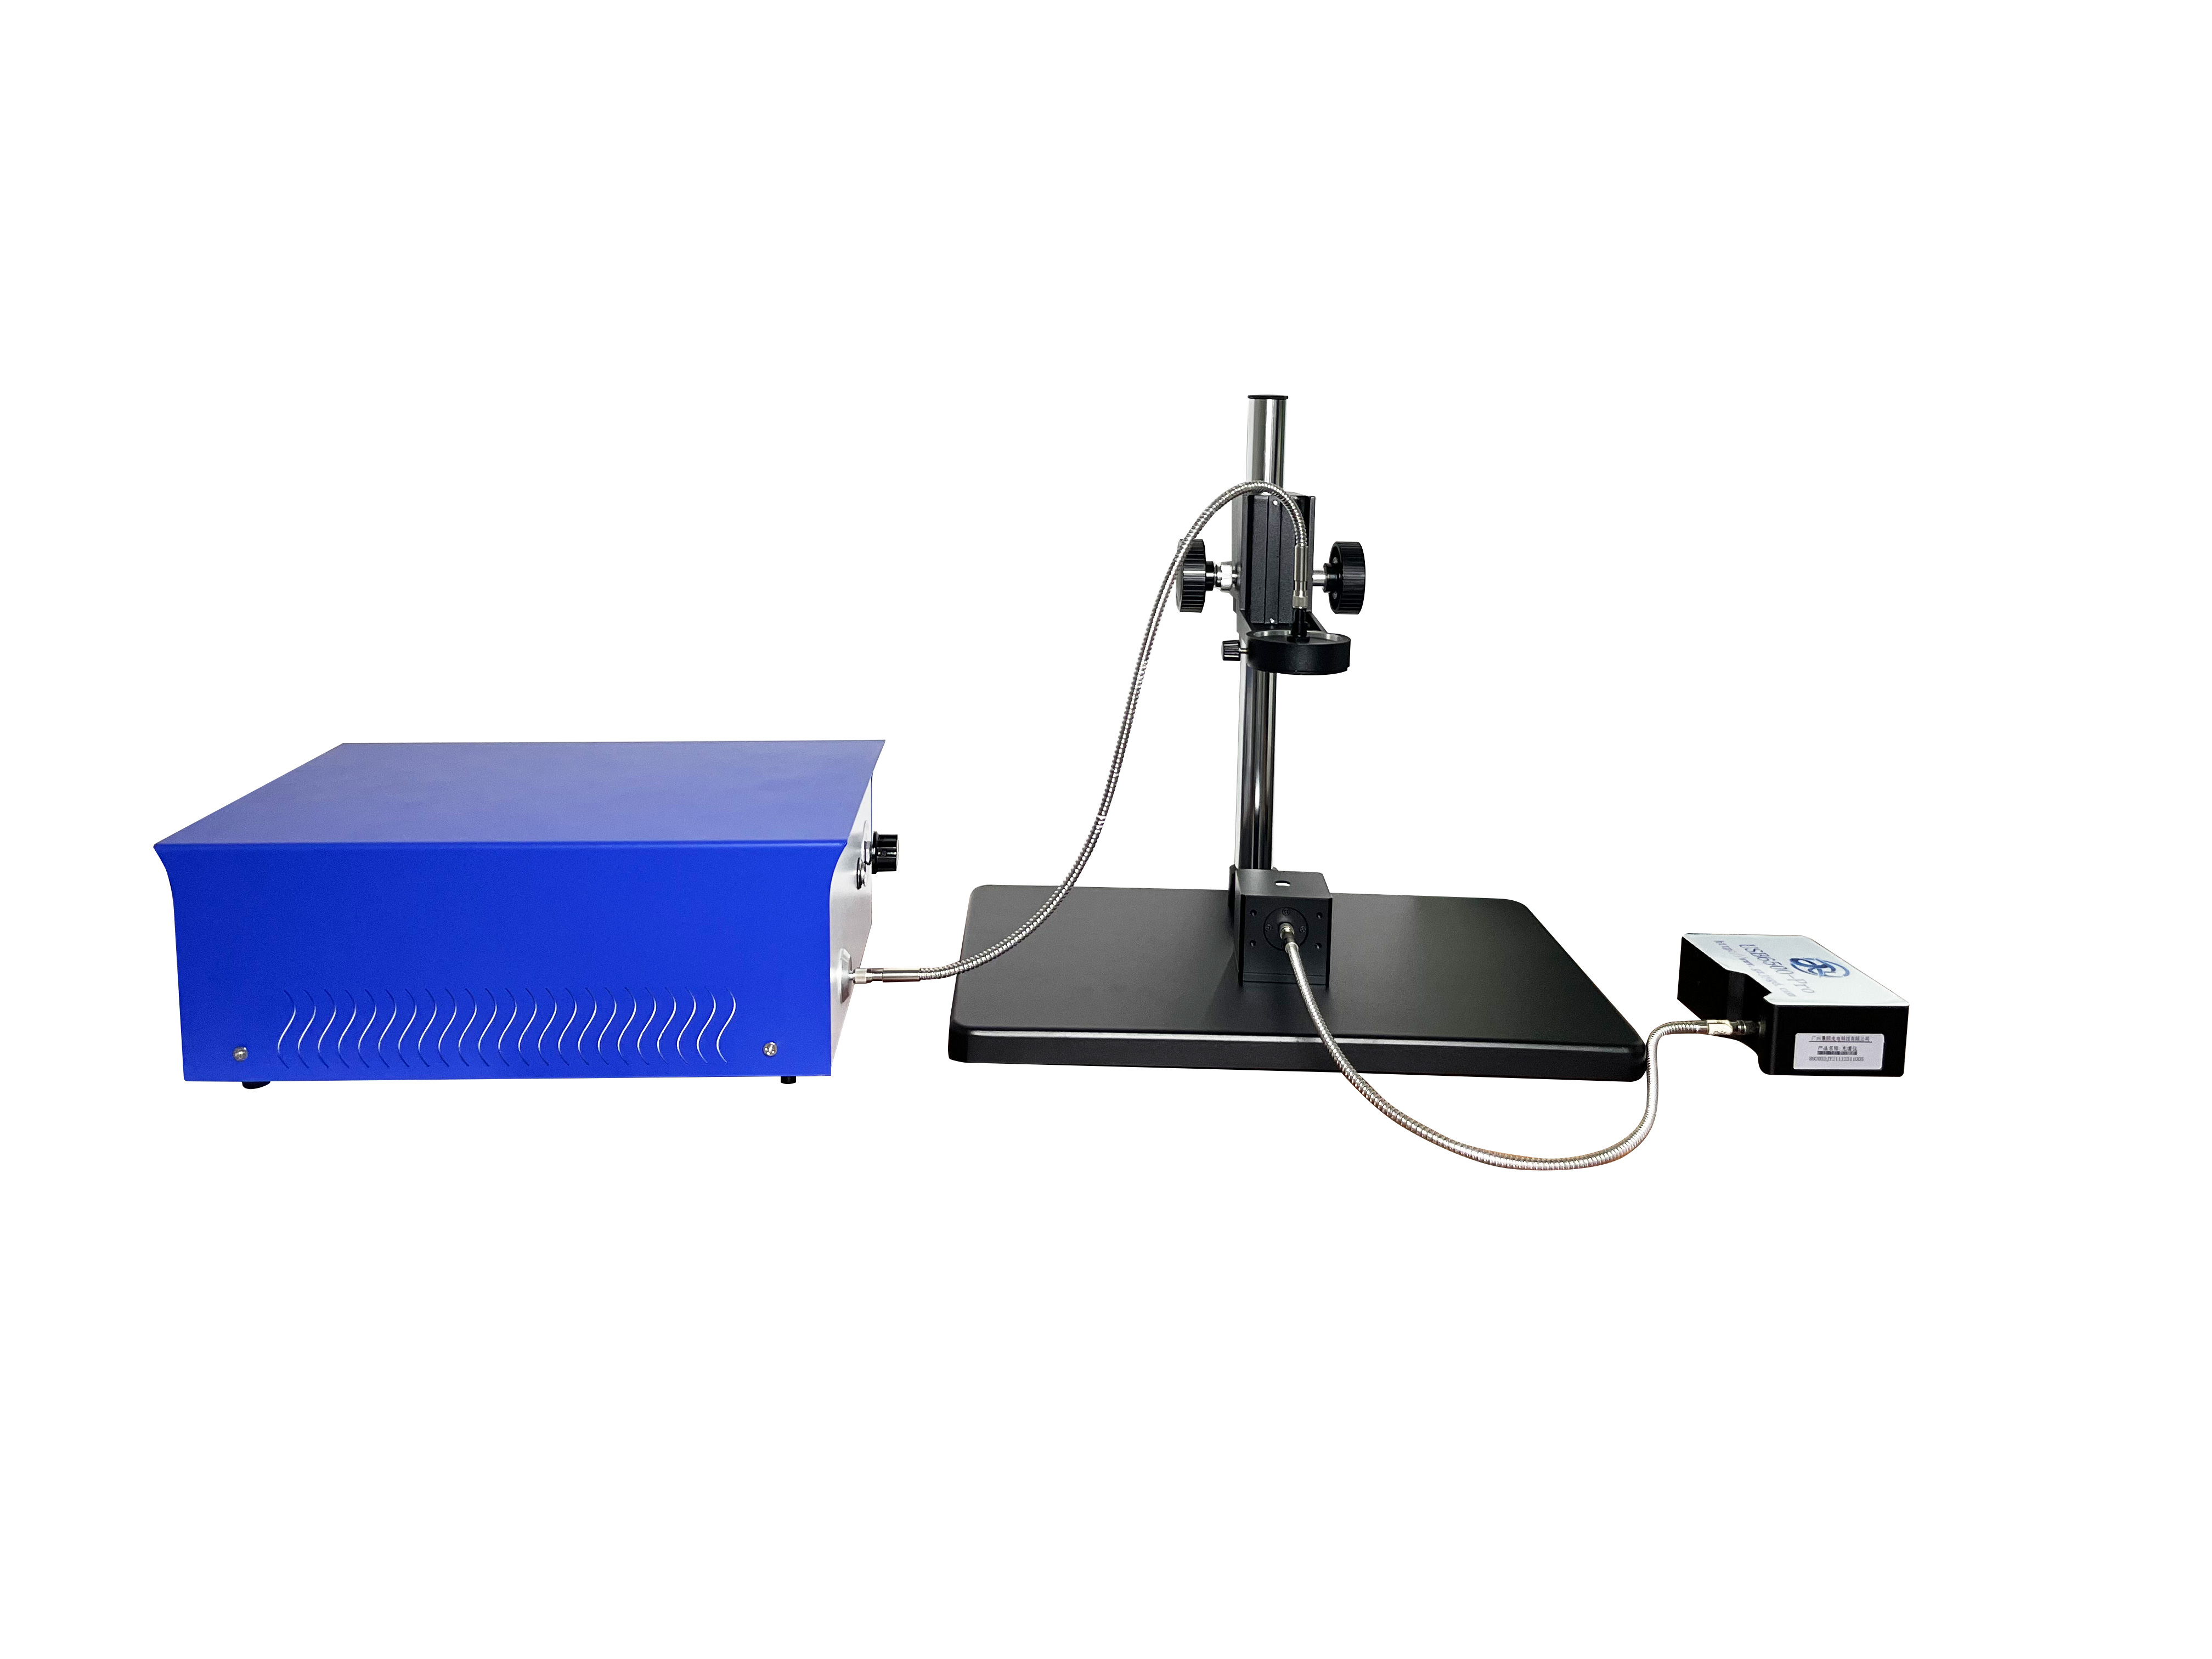
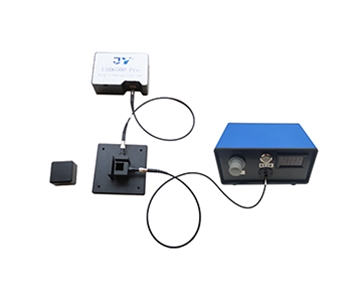
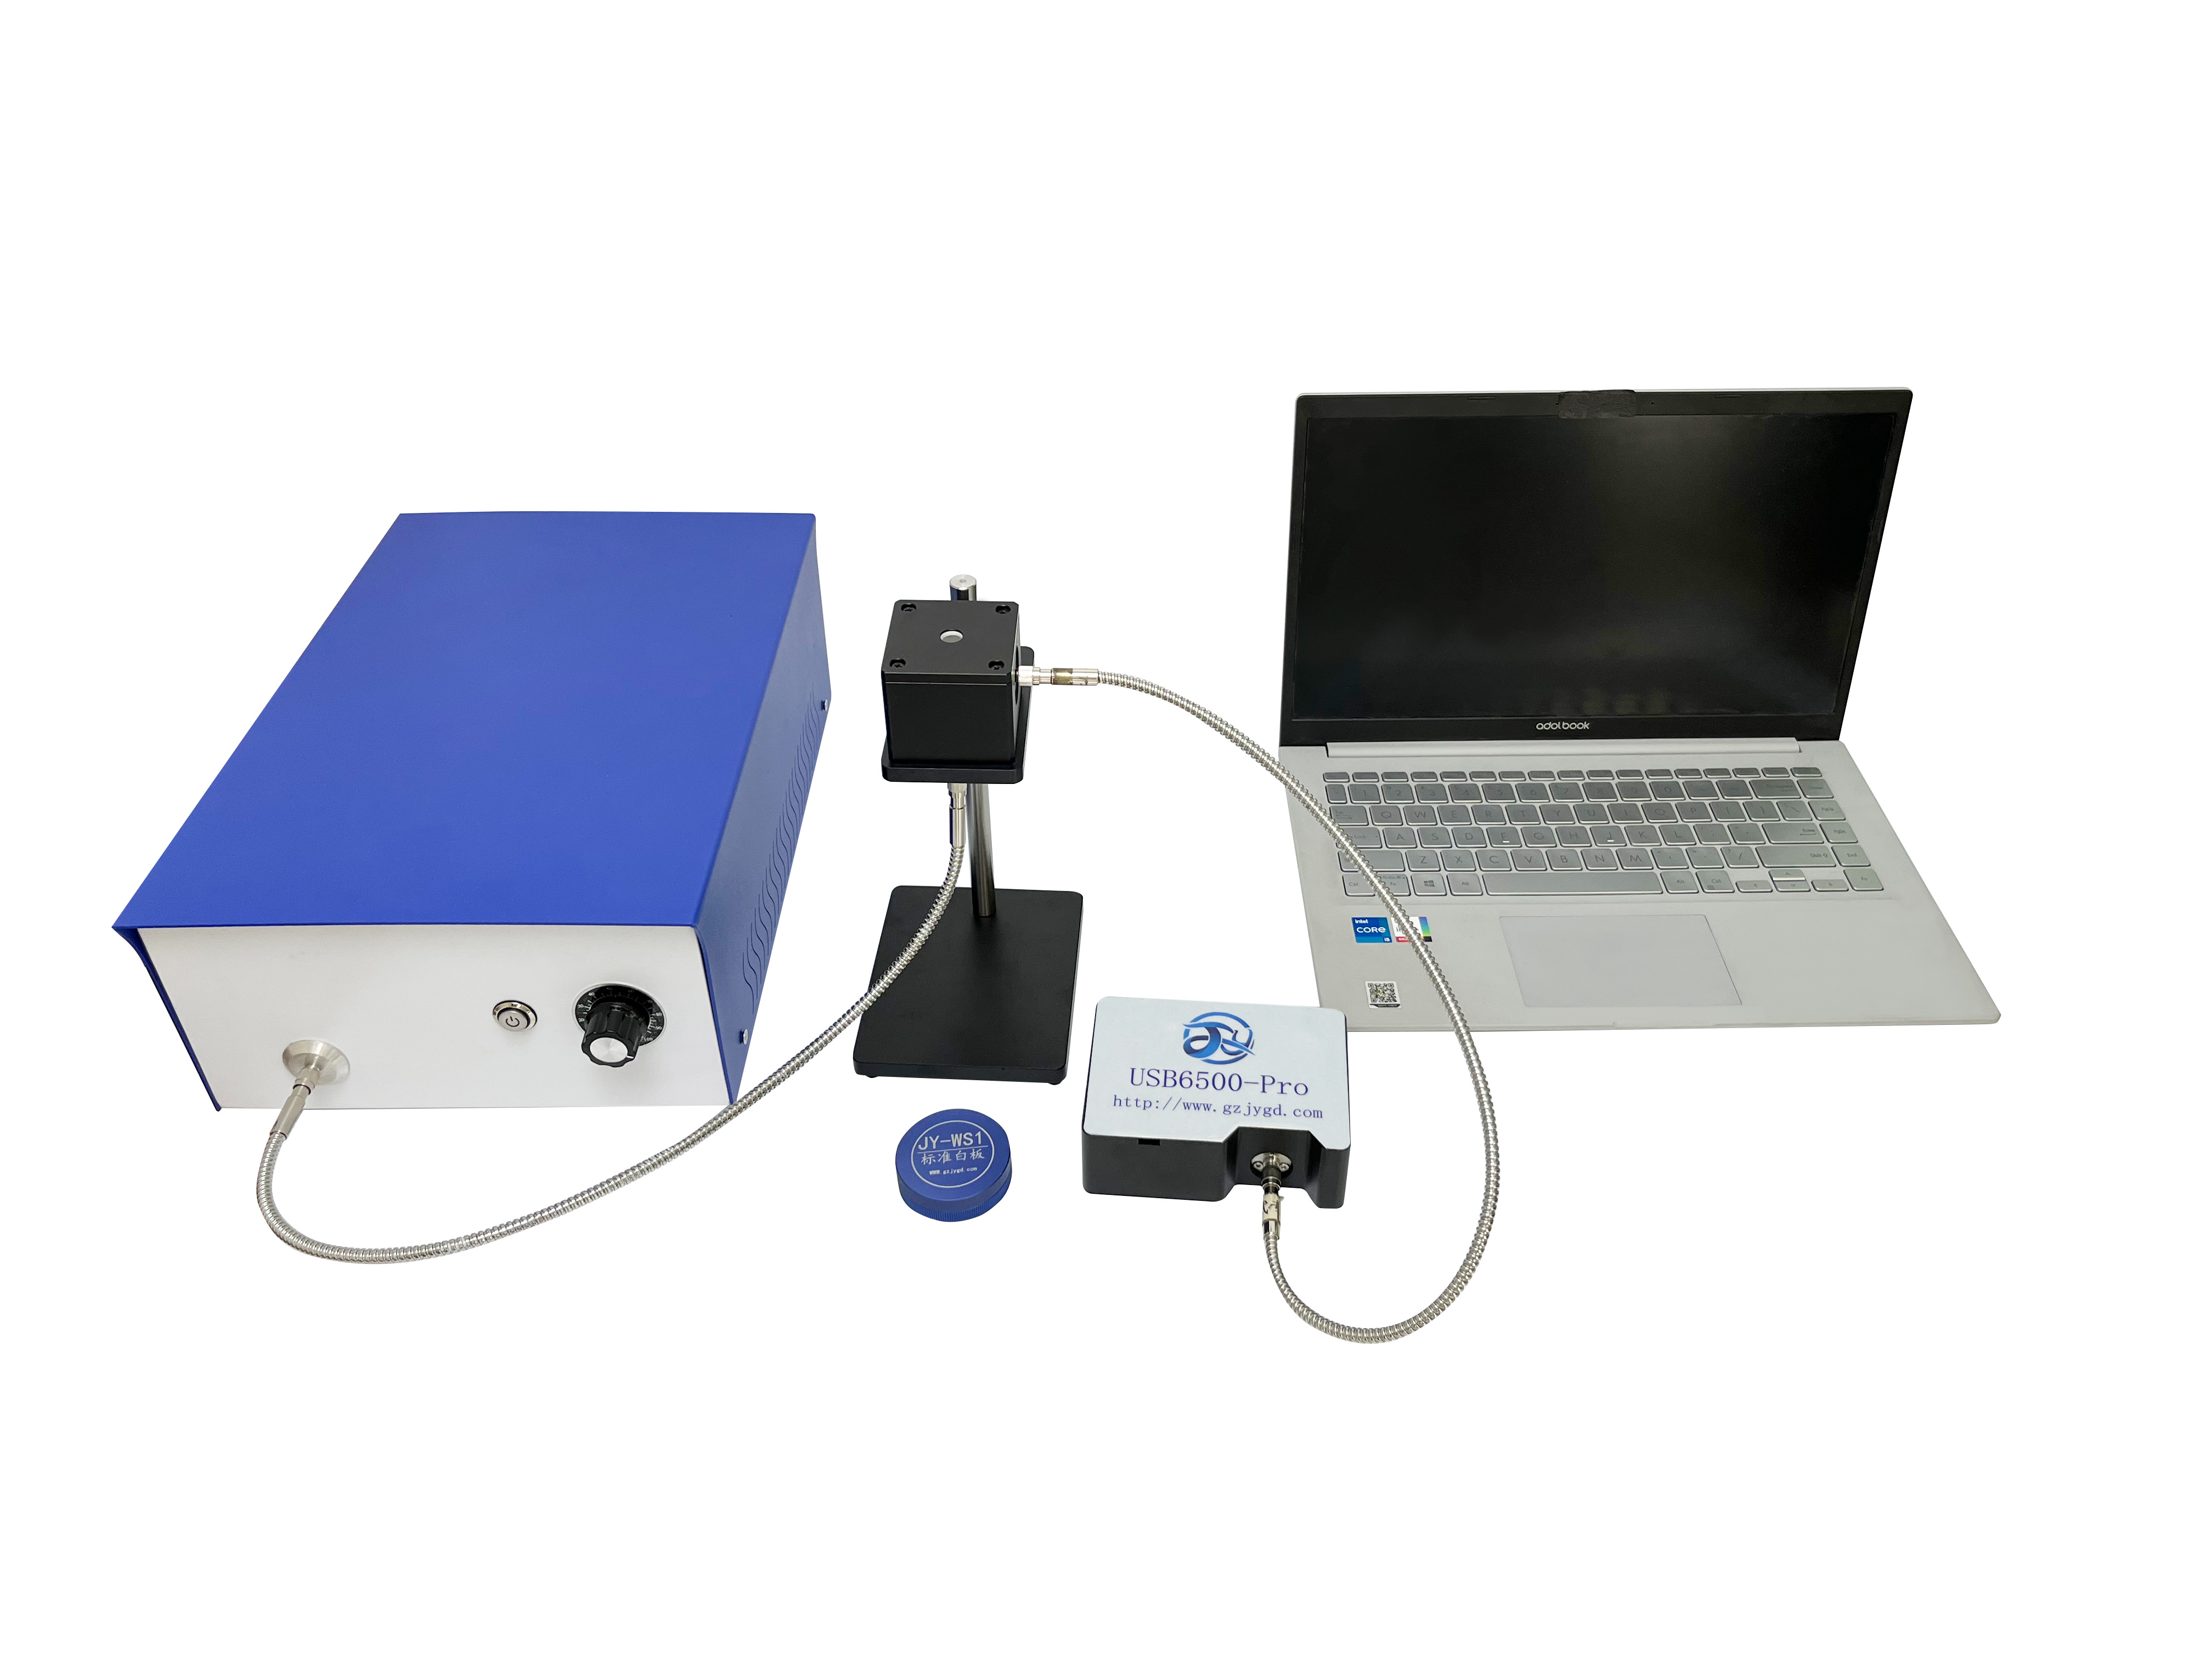
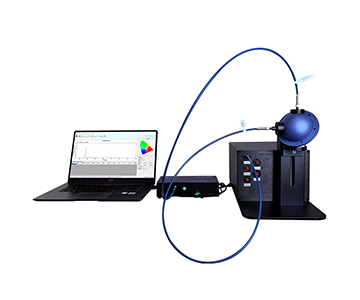
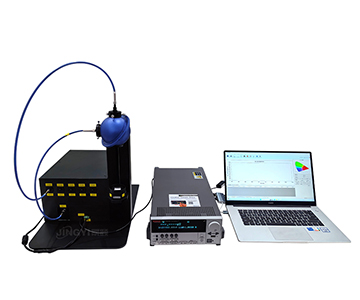
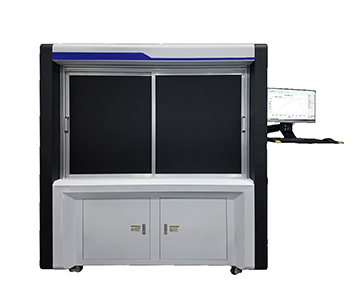
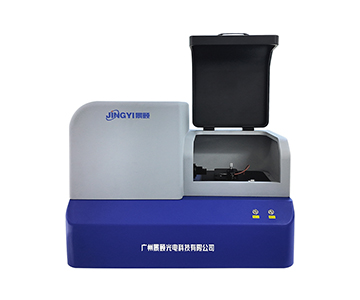
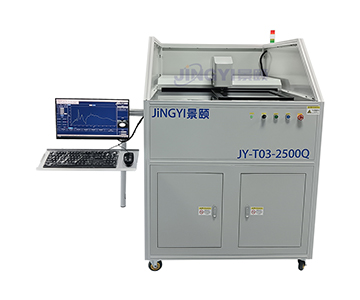
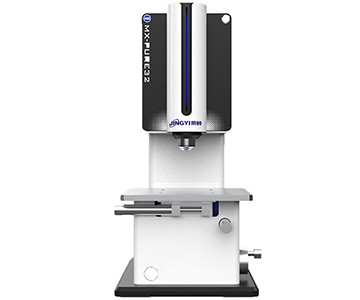
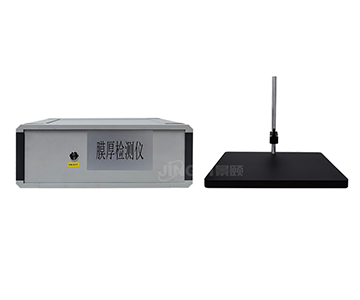
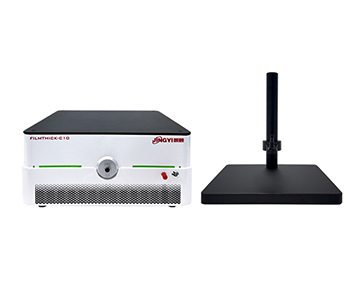
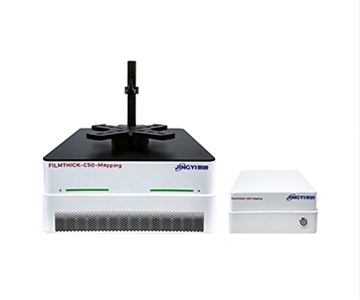
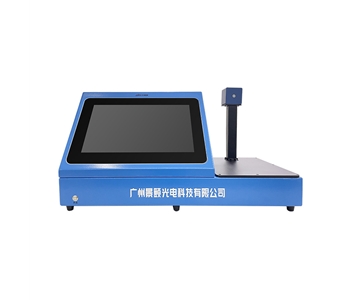
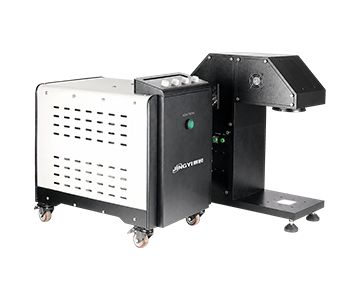
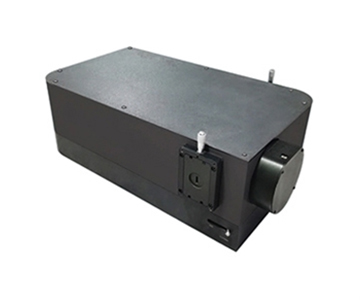
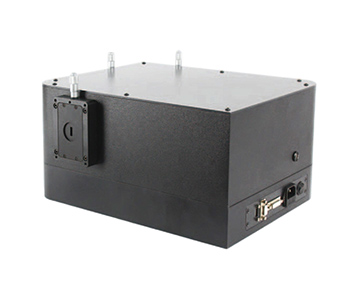
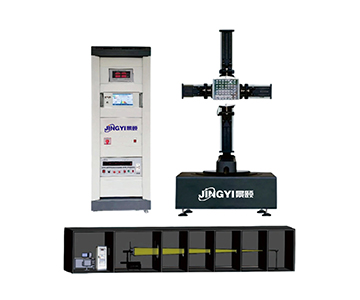
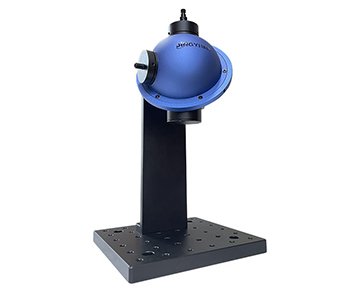
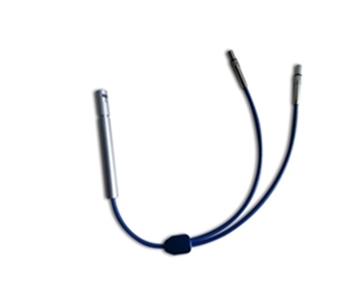
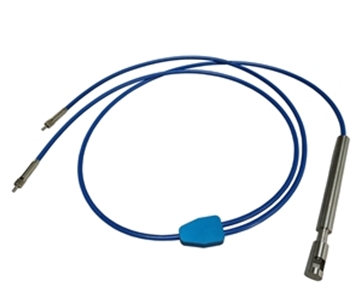
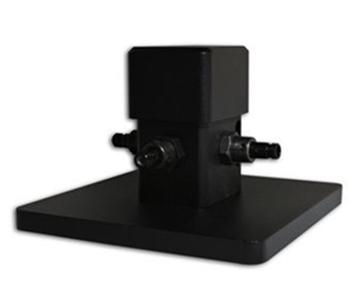
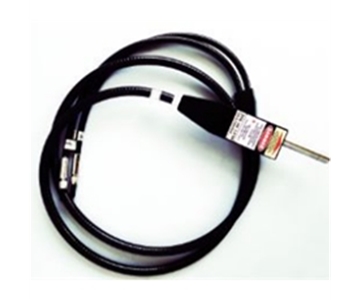
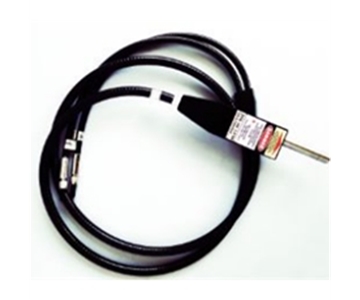
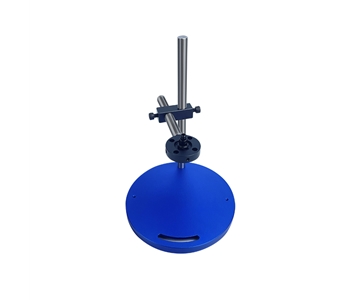
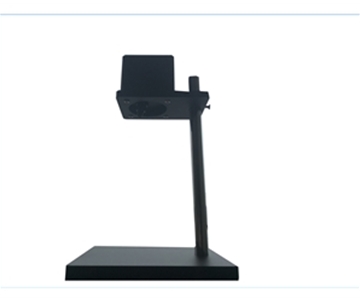
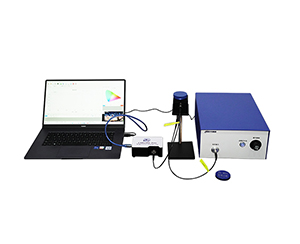
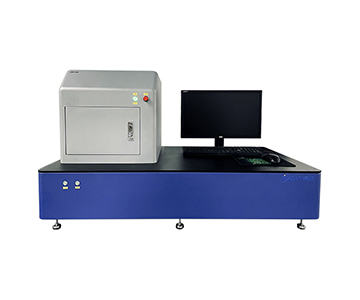
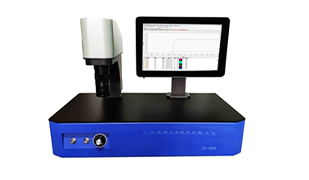
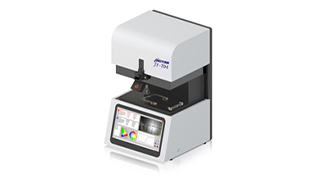
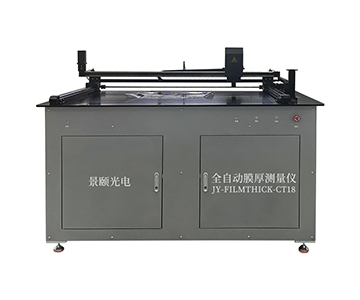
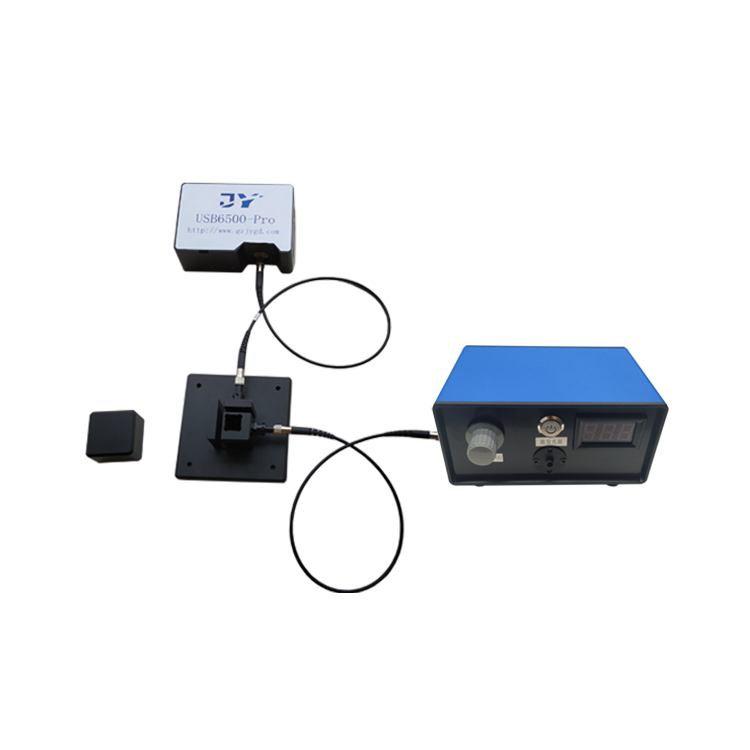
A $100K-class interferometer employing reflective white-light interferometry covers a spectral range of 380–1100 nm with a 1.5 mm spot size. Its R-Theta polar coordinate stage keeps the optical head stationary while the sample moves radially and rotates, eliminating inter-point assembly consistency errors. When handling 12-inch wafers, this architecture ensures that adjacent ring comparisons remain free from mechanical repeat positioning drift.
On the inversion side, three algorithms run simultaneously: FFT handles periodic solutions for medium-to-thick films, the extremum method processes thin interference fringes, and curve fitting strips multilayer films layer by layer. The evaluated system, developed by a drafting participant of the T/CIET 2298-2026 calibration specification for thin film interferometric thickness measurement systems, demonstrates 0.2 nm thickness repeatability under that standard's conditions (based on 100 measurements of a 100 nm SiO2/Si reference wafer, maximum value).
Single-point measurement takes under 0.5 seconds; 25 points generate a map in approximately 14 seconds. For R&D laboratories, this compresses DOE experiment wait times from hours to minutes, with all data traceable to a single optical path reference.
Assessing Full-Wafer Data Credibility Through Linearity
Linearity is not a synonym for repeatability. Repeatability measures the scatter of 100 measurements at the same point; linearity measures the deviation of measured values from an ideal slope across the full measurement range. In thickness mapping, poor linearity manifests as a flat central region with systematic edge offset, producing "false uniformity" in cloud maps.
A mainstream system specifies absolute accuracy as 0.2% or 2 nm (whichever is larger), with stability better than 0.05 nm. When evaluating a 2108 nm SiO2 layer, linearity constraints set an edge point error boundary of approximately 4.2 nm, corresponding to refractive index inversion fluctuation below 0.3%. This is critical for quantum dot materials and perovskite tandem structures—micro-region nonlinearity misleads bandgap matching judgments.
Residual low-frequency envelopes in FFT spectra typically indicate uncalibrated linearity. Under these conditions, 2D contour maps superimpose real process variation with instrument nonlinearity, actually increasing production line misjudgment rates.
Quantitative Comparison Records Before and After Deployment
Before adopting a full-wafer mapping solution, an optical coating laboratory relied on manual stage single-point recording. For a 6-inch wafer with a 57-point grid:
Deployment before: single-wafer cycle time = 22 minutes, point coordinate error ±0.2 mm, uniformity statistics limited to Max/Min only, no STD distribution.
Deployment after: single-wafer cycle time = 30 seconds, radial positioning controlled by R-Theta closed-loop, outputs include Average/Median/STD in 2D and 3D maps.
Improvement magnitude: cycle time reduced by 44×, uniformity evaluation dimensions increased from 2 to 5, edge exclusion zones customizable.
In biomedical film thickness measurement, parylene protective layers measured at 2490 nm. Repeatability data enabled a medical device customer to switch incoming inspection from destructive cross-sectioning to non-destructive sampling, saving approximately $12,400 annually in reference wafer consumption.
Reusability Patterns Across Scenarios
From wafers to display panels to medical films, three transferable rules emerge. First, spot size must match film texture: micro-patterned samples require sub-micron positioning, while the standard 1.5 mm spot suffices for conventional wafers. Second, algorithm combinations outperform single algorithms—FFT for thick films, fitting for thin films; forced switching loses linearity.
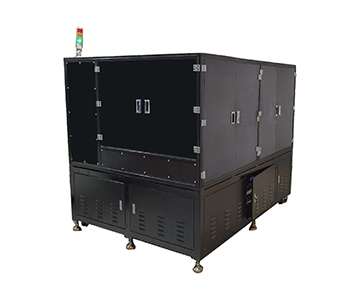
Third, both PET film thickness measurement and display device inspection demand CSV/Excel data export for MES integration; otherwise mapping maps are merely "visually appealing." In inline monitoring scenarios, sub-0.8-second response shifts quality control upstream, avoiding post-coating batch rejection.
Applicability Boundaries and Practical Constraints
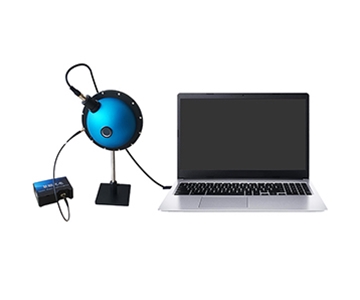
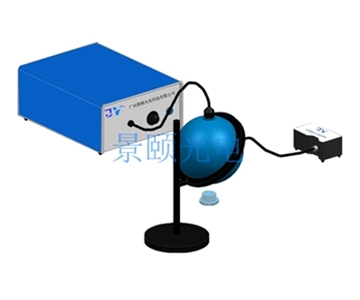
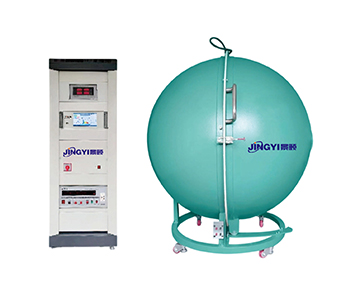
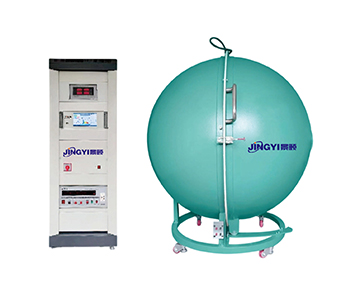
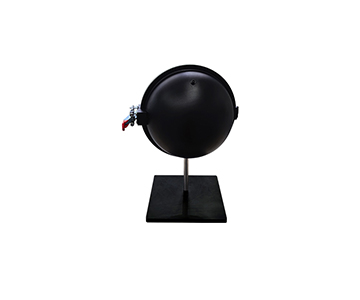
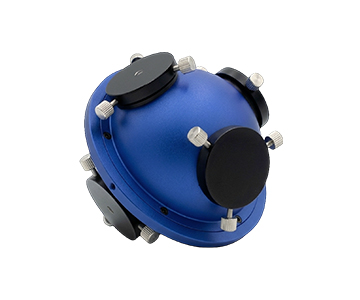
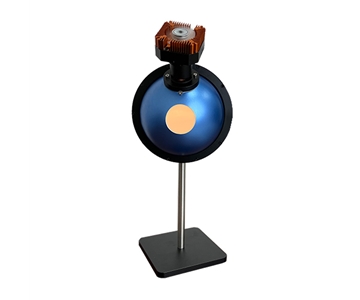
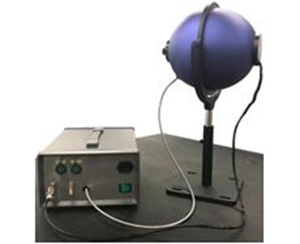
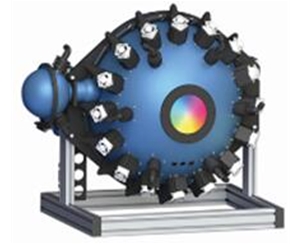
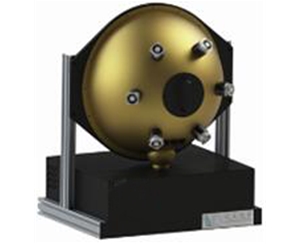
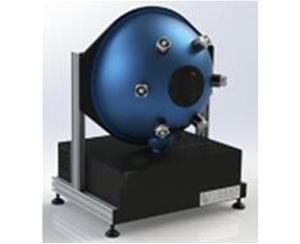
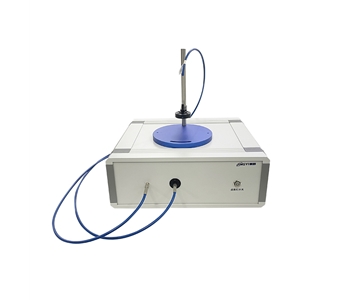
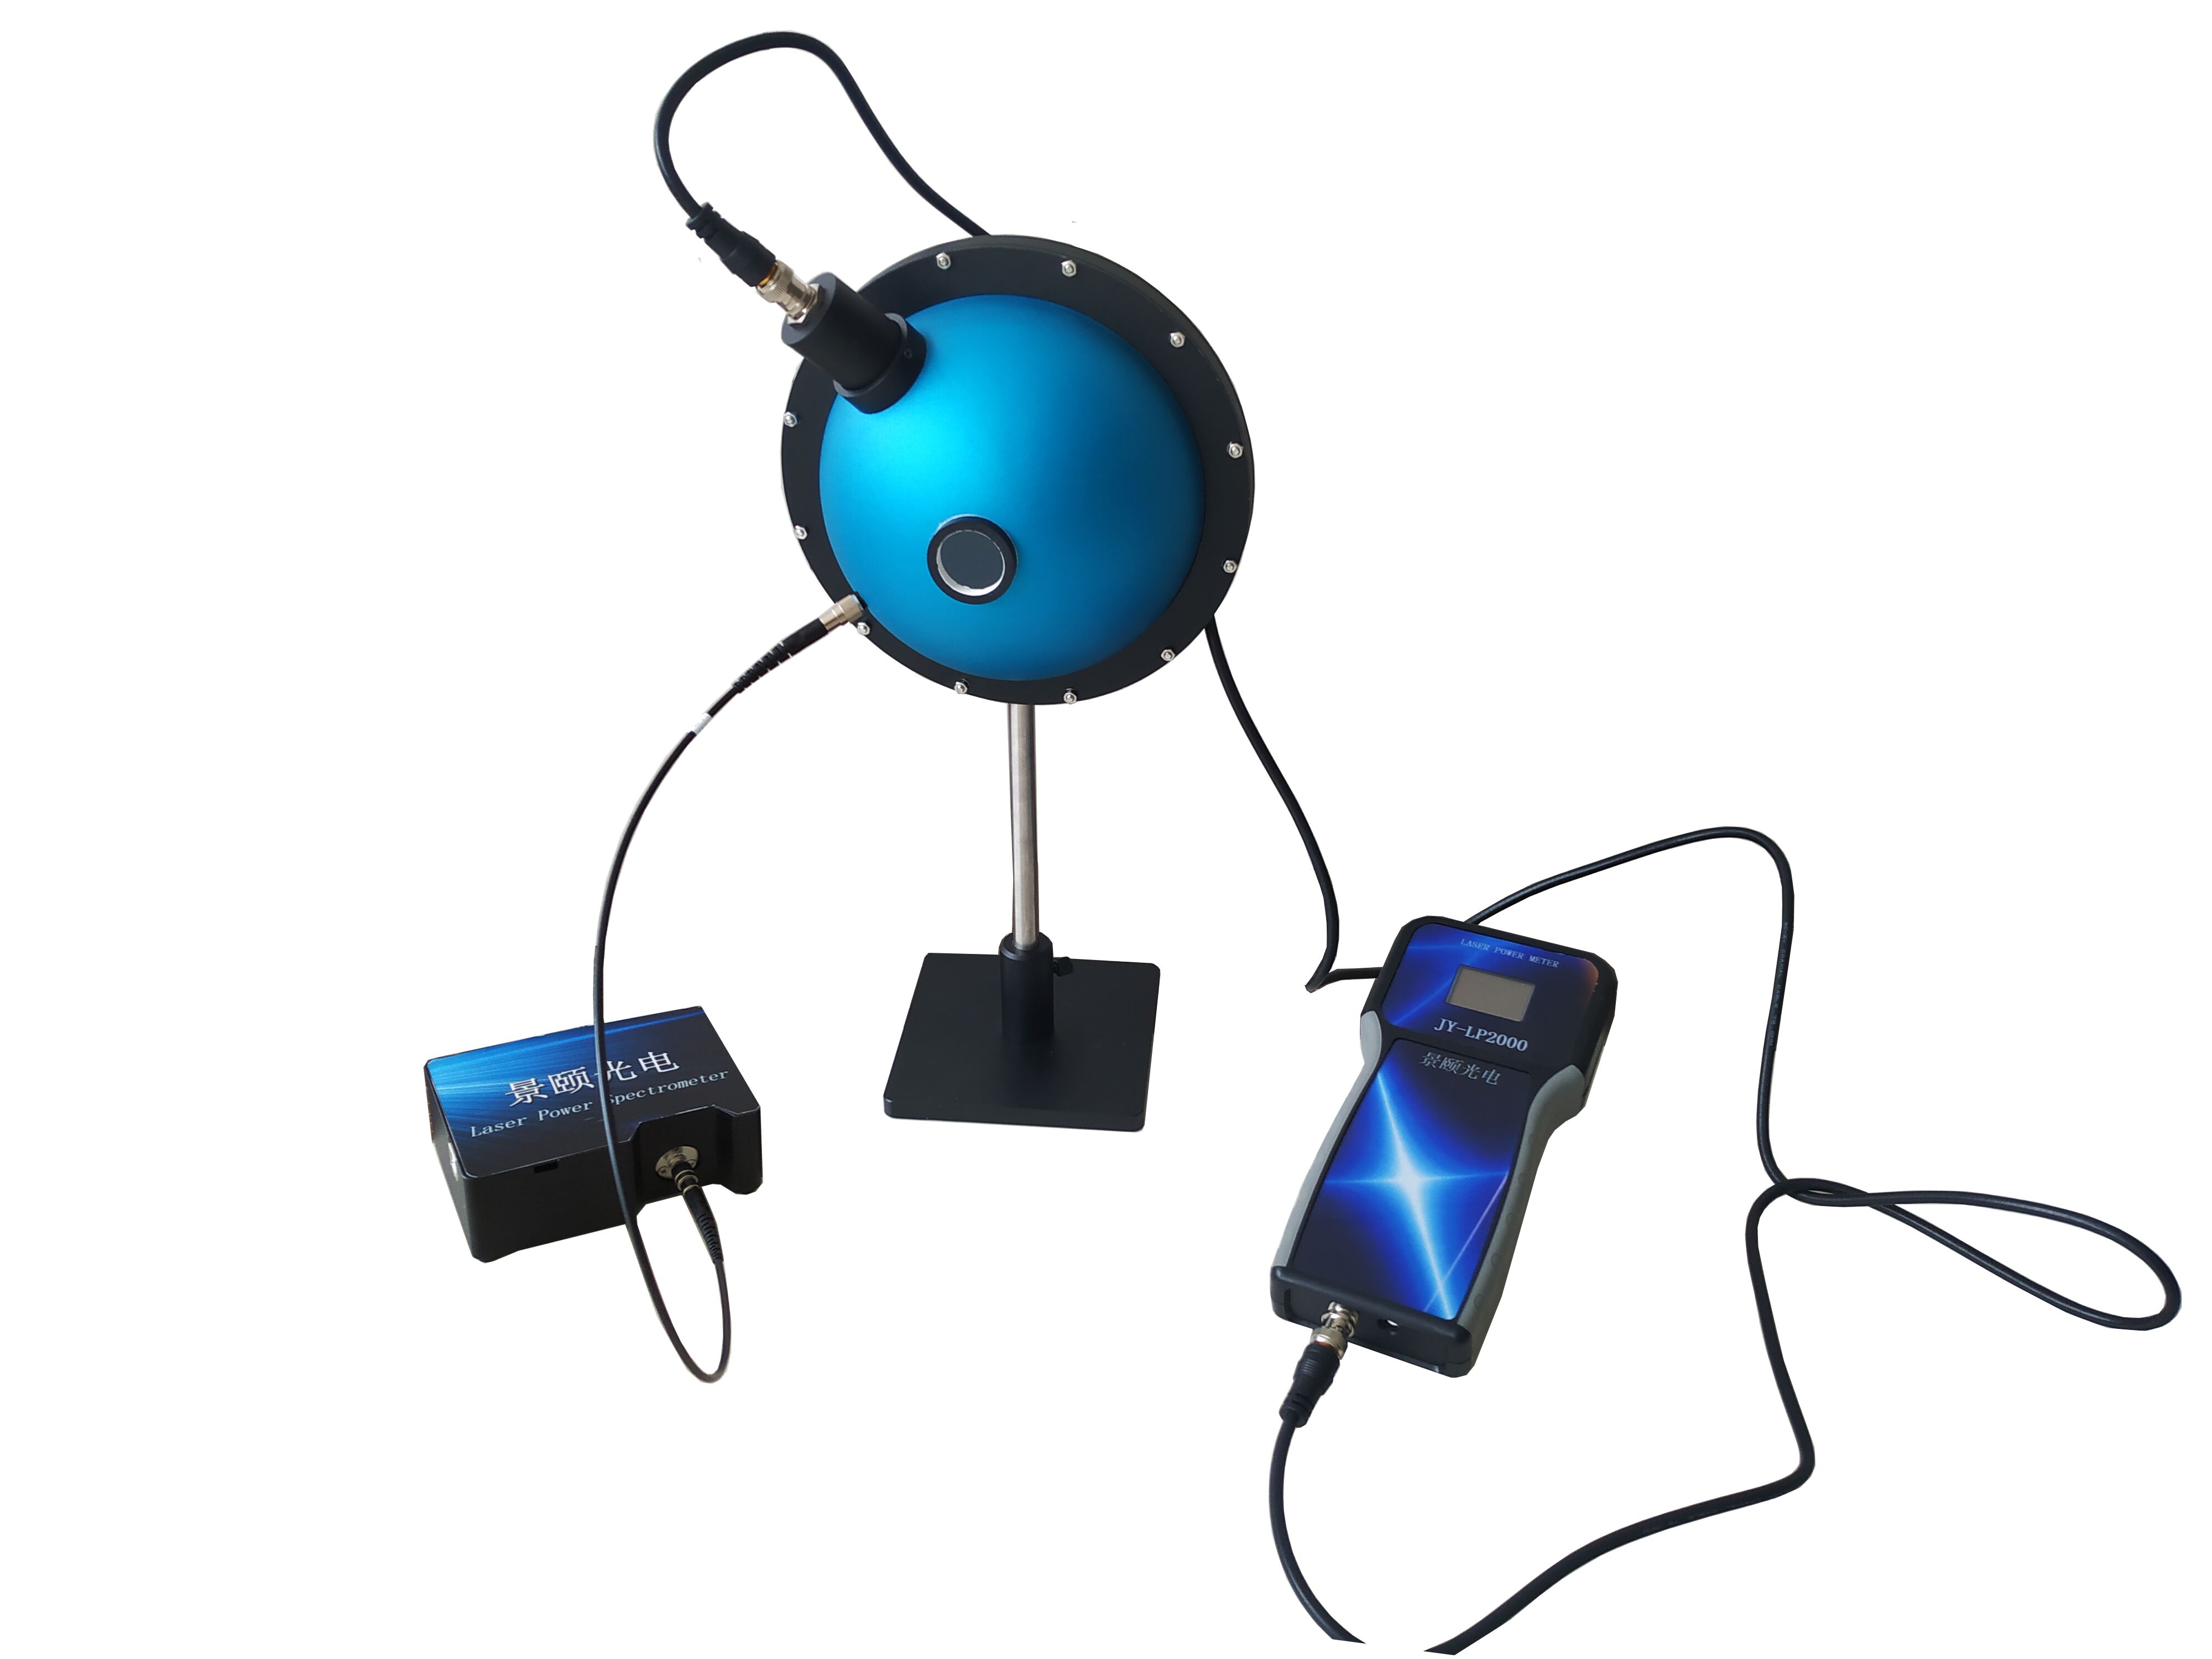
These systems are not universal. First, reflective principles depend on refractive index contrast between film and substrate; strong double-sided reflection coupling on transparent substrates (e.g., bare glass) degrades signal inversion confidence, requiring complementary transmission integrating sphere measurement.
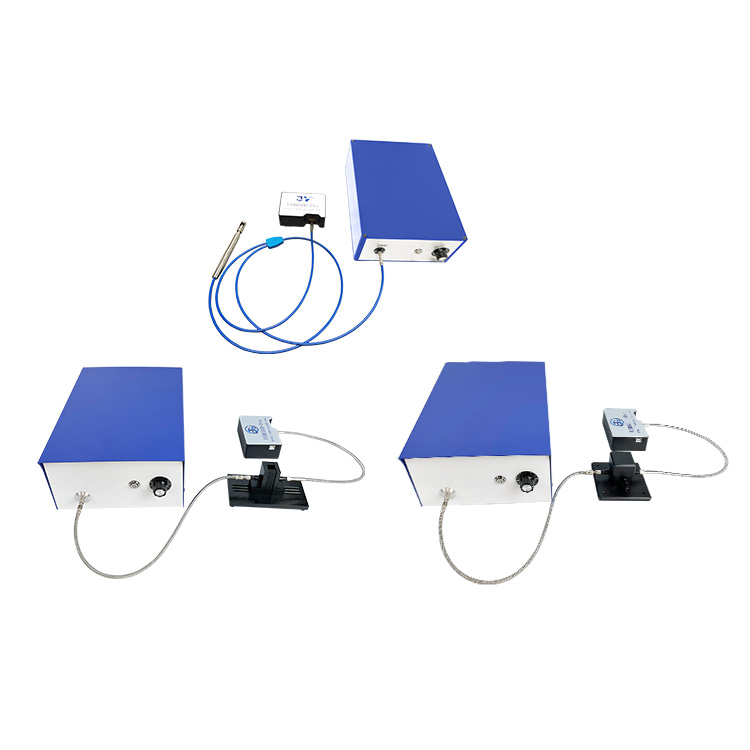
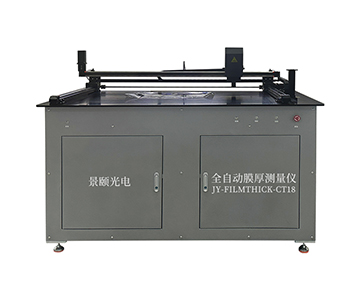
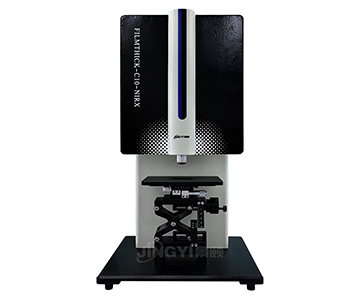
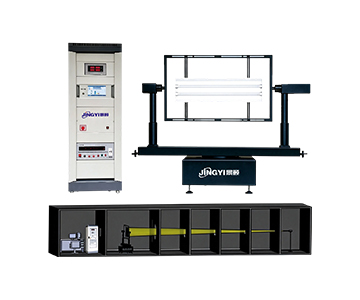
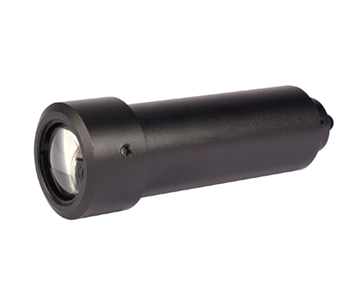
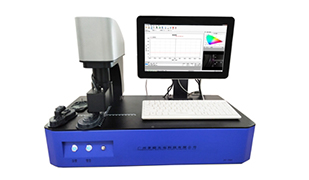
Second, the 1.5 mm spot causes averaging effects on sub-millimeter micro-structured patterned samples; micro-region devices should use microscope-branch models. Third, R-Theta stages are less flexible than XY Cartesian coordinates for irregular or strip substrates; square samples should switch to XY platform branches. Finally, environmental temperature control requires 18–28°C with no condensation; uncorrected production floor vibration degrades linearity.
Frequently Asked Questions
Q1: How do FFT and curve fitting divide responsibilities in film thickness inversion?
FFT suits rapid period solving for medium-to-thick films, while curve fitting handles thin layers and multilayer optical constant联立. Software auto-switches by thickness magnitude and provides residual curves to assess convergence quality.
Q2: How can I verify the credibility of mapping data?
Observe whether 2D cloud maps show concentric symmetry and whether STD changes monotonically with radius. Use standard SiO2/Si wafers for 100-repeat measurements and compare against calibration specifications to evaluate linearity drift.
Q3: What if the spot size is too large for micro-region samples?
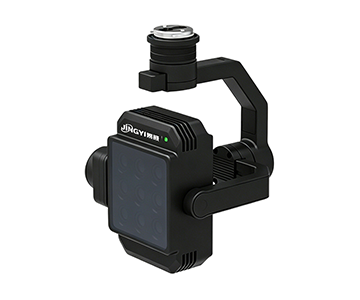
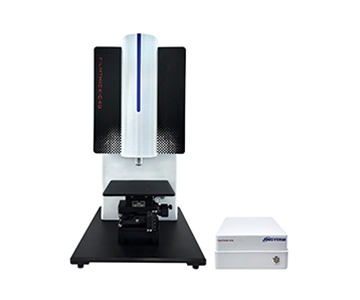
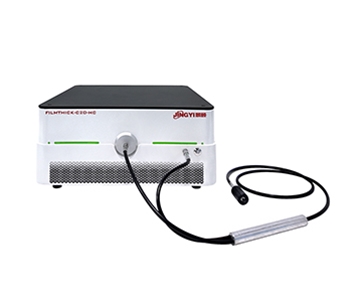
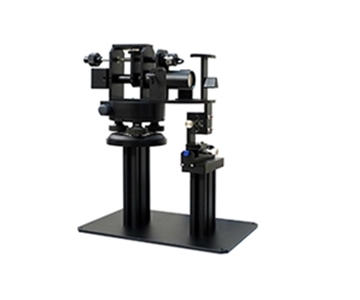
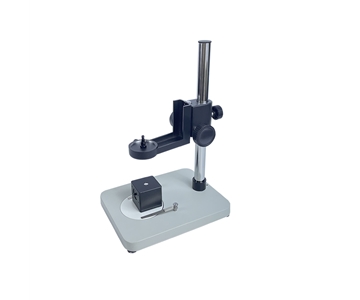
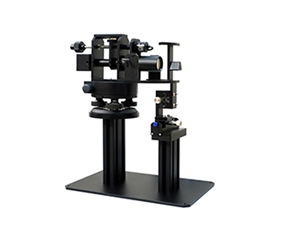
Switch to a microscope branch; spot size reduces to ~60 μm with sub-micron positioning. Patterned wafer landing points become visualizable, preventing thickness averaging across adjacent lines.
Q4: Beyond accuracy, what should buyers evaluate during procurement?
Check wavelength range coverage of film absorption peaks, platform compatibility with substrate sizes, and data export to MES/SPC. Confirm complete metrological traceability per T/CIET 2298-2026 rather than fixating on "0.x nm" claims.
Q5: How can I independently verify equipment status during long-term operation?
Conduct periodic repeatability tests with reference wafers and retain raw CSV spectral data. Compare historical fitting residuals and STD trends; if linearity drifts persistently, first inspect light source decay and stage vibration isolation, then pursue third-party calibration.
About This Guide
Data Sources
: Public product technical documentation, standard wafer measurement records, T/CIET 2298-2026 calibration specification, in-house validation reports (n=100 measurements on 100 nm SiO2/Si reference wafers).
Author
: Cai Xiaodong, Senior Application Engineer, Jingyi Optoelectronics, 12 years in spectroscopic instrumentation and precision metrology equipment evaluation.
Disclosure
: Jingyi Optoelectronics manufactures optical thickness gauges. This article presents technical assessments based on published specifications, calibration standards, and aggregated industry data. No compensation was received from third-party brands mentioned.
Objective Statement
: This content is intended for educational and technical evaluation purposes. Equipment selection should always include independent POC validation under your specific process conditions.
Last Updated
: November 2026
For detailed specifications and application notes on optical thickness gauges, search "Jingyi Optoelectronics film thickness measurement" or visit our technical library.