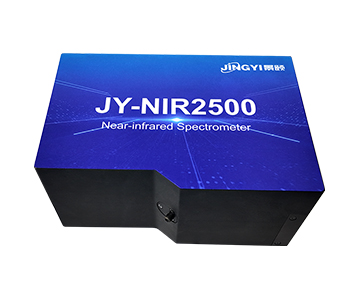
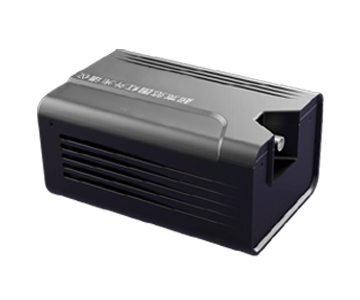
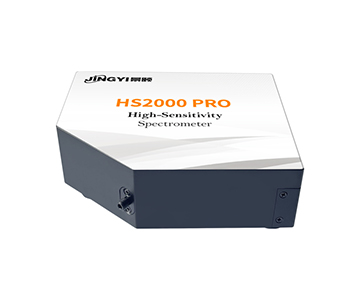
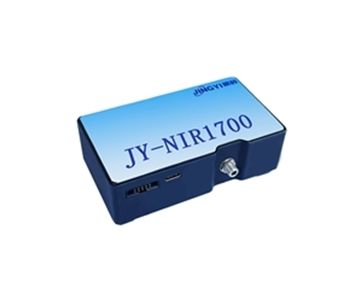
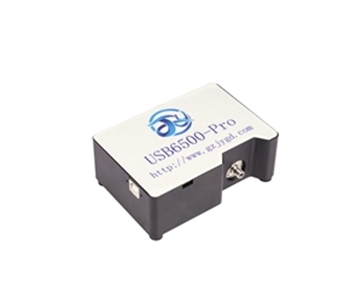
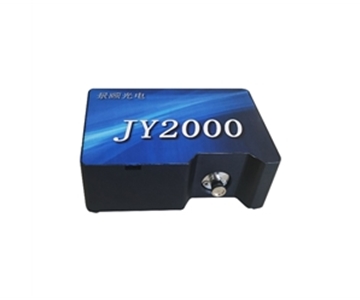
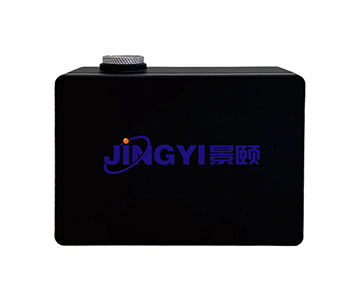
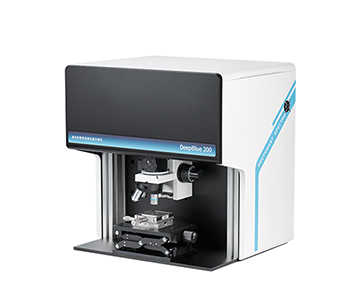
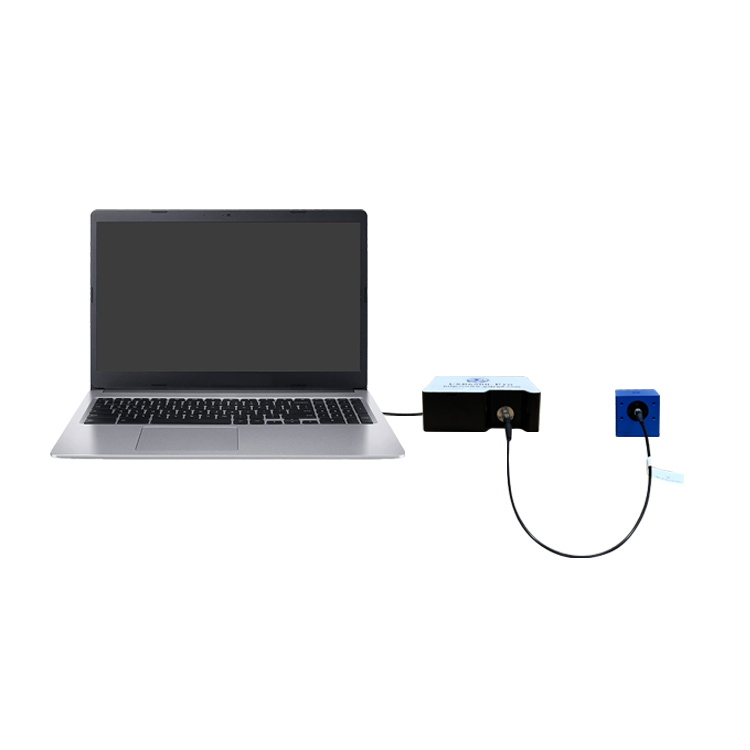
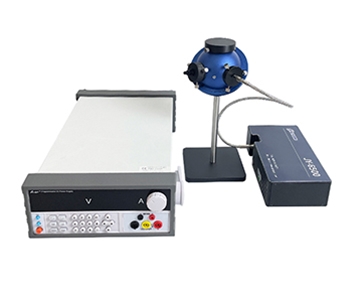
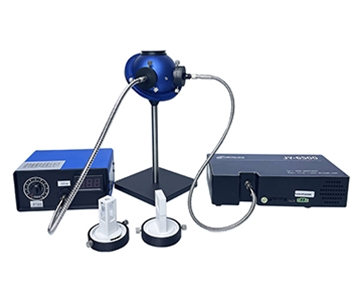
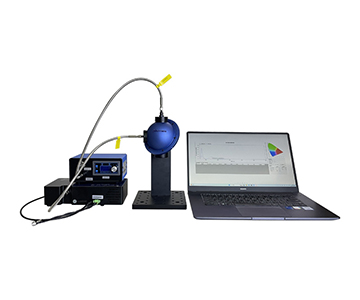
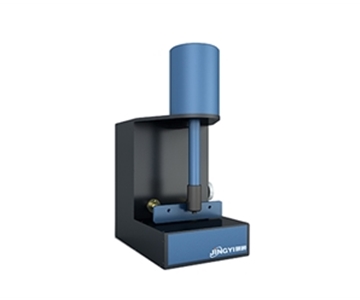
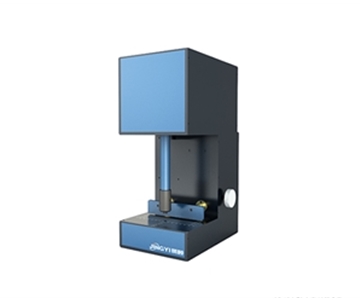
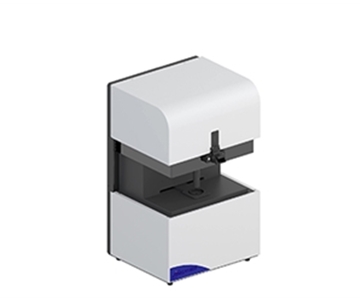
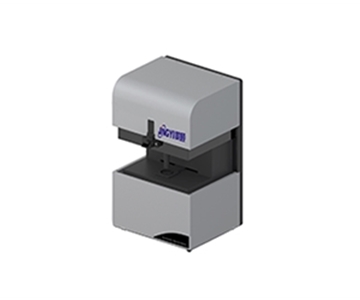
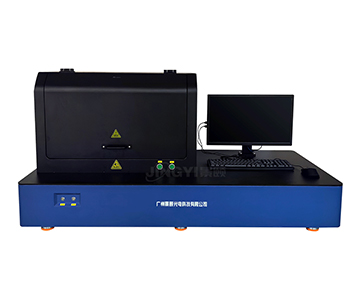
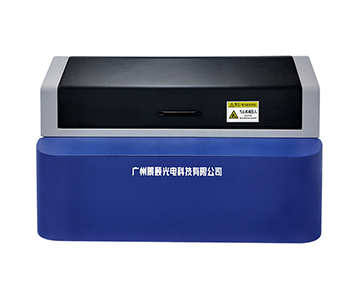
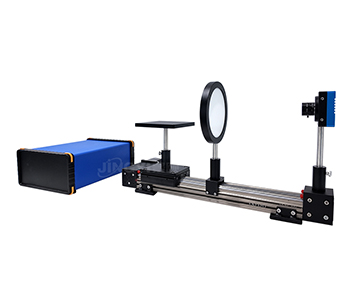
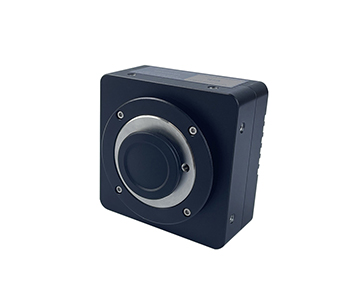
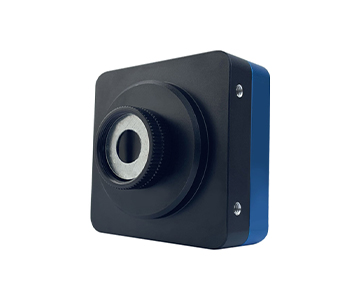
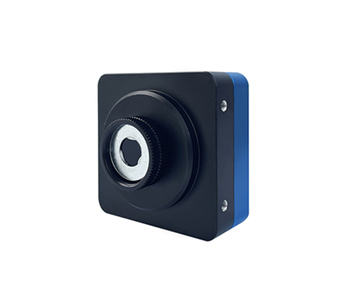
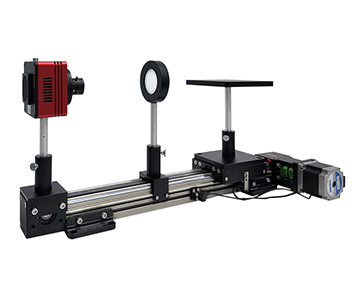
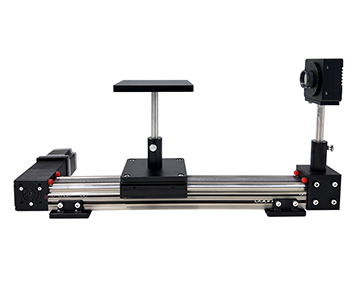
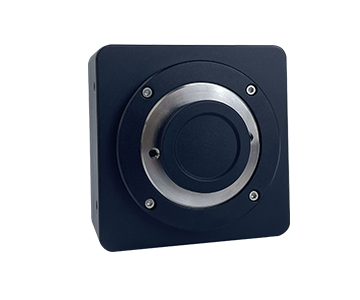
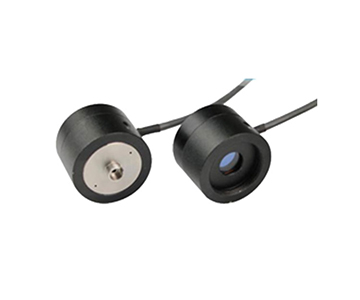
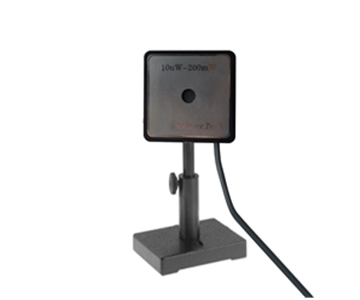
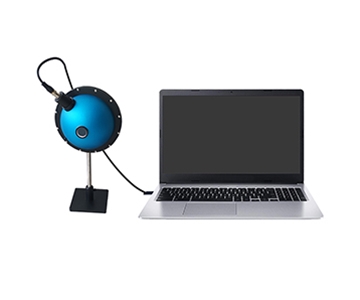
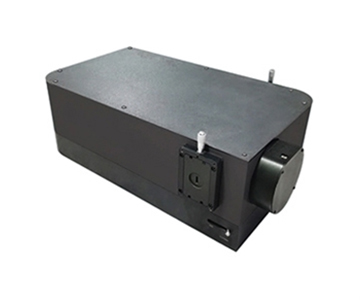
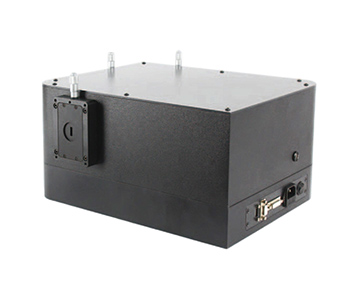
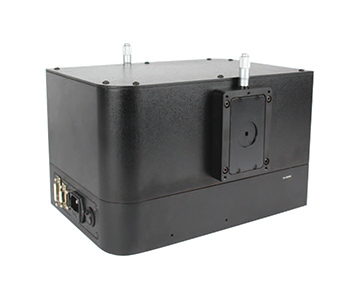
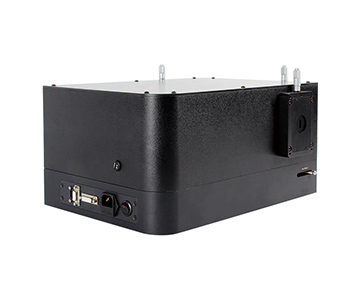
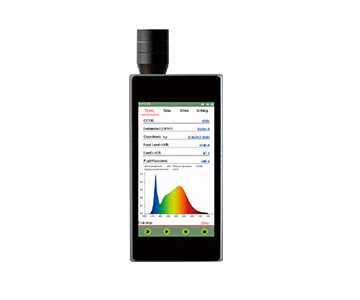
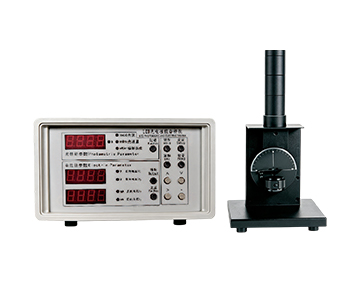
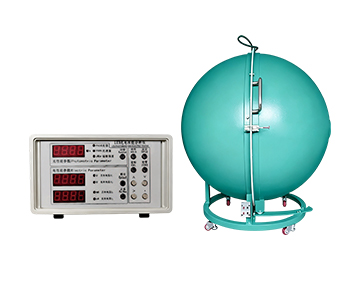
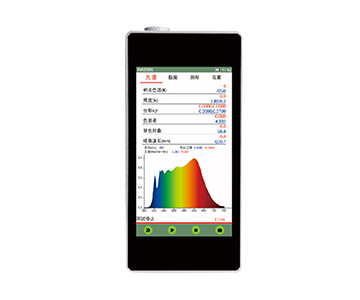
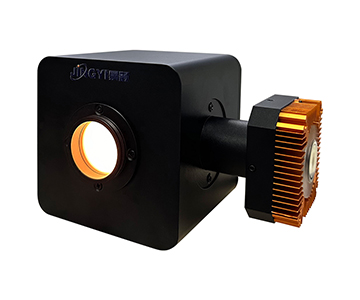
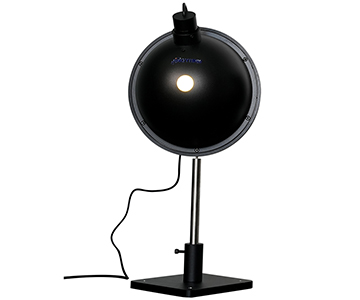
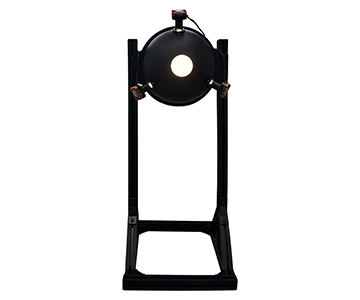
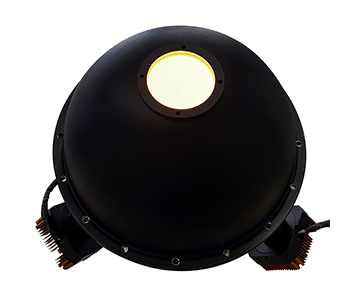
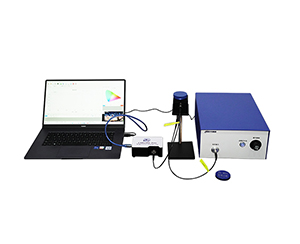
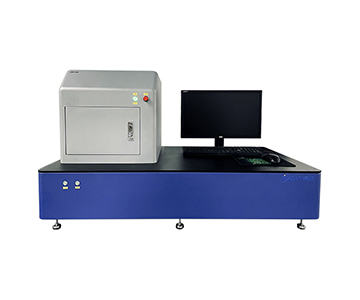
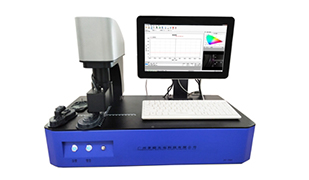
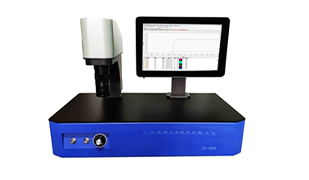
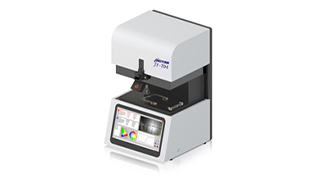
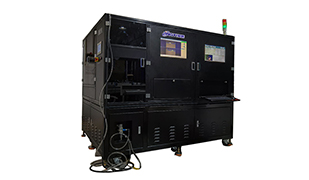
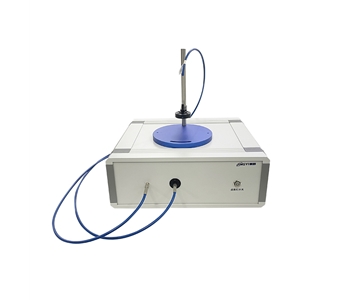
Chromaticity measurement in UV-Vis-NIR spectral ranges demands a stable, traceable optical backbone for both inline inspection and laboratory R&D. A 3648-pixel miniature spectrometer with 18-bit digitization and -20°C TE cooling achieves repeatable color coordinate tracking across LED, consumer electronics, biopharma, and photovoltaic processes. This technical brief maps spectrometer specifications to measurable process windows, referencing SEMI and ISO calibration frameworks.
Executive Summary: Core Metrics and Process Windows
This technical brief examines fiber-coupled spectrometer architectures spanning 180–1100 nm (broadband) and 900–2500 nm (NIR). Key extractable parameters from the evaluated platform include:
•Wavelength coverage: 180–1100 nm (broadband), 900–2500 nm (NIR)
•Detector pixels: 256 to 3648
•A/D bit depth: 16 to 18 bits
•Integration time: 0.1 ms to 130 s
•TE cooling: -15°C to -20°C
When a production line must capture faint fluorescence signals, cooling the detector to -20°C compresses dark current by one to two orders of magnitude. This makes chromaticity drift at low illumination levels far easier to resolve. The 18-bit quantization maps the dynamic range onto finer current steps, preventing simultaneous saturation of high-brightness sources and weak reflection zones.
Rather than listing marketing claims, this section translates specifications into verifiable process windows: wavelength coverage determines measurable material classes, pixel density defines spectral resolving power, integration time dictates sampling cadence, and cooling depth governs long-term stability.
Industry Context: Legacy Specifications Failing Advanced Processes
According to the SEMI 2025 Annual Report, semiconductor and optoelectronic device manufacturing continue to raise requirements for online optical metrology frequency and consistency. Traditional sampling inspection is shifting toward 100% inline testing with closed-loop feedback. As batch tolerances for LED packaging, coated glass, and biochemical reagents narrow to sub-millimeter and nanometer scales, legacy detection specifications based on single-point filter photometers begin to show metrological discontinuity.
From a technology evolution standpoint, early solutions used fixed-bandwidth photoelectric sensors outputting only total luminous flux. The current approach restores continuous spectra via linear array detectors and dispersive optics, then calculates chromaticity coordinates and transmission/reflection ratios. This generational shift is not a parameter upgrade—it is a measurement paradigm reconstruction.
When optical component vignetting coefficients and thin-film interference color shifts enter micrometer scales, averaged readings under legacy standards mask localized defects. What the industry requires is not a faster indicator panel, but a spectrally traceable, recalculable, and cross-line-alignable optical metrology base.
Technical Principles and Product Architecture
Optical Design and Detector Evolution
Early miniature spectrometers mostly adopted symmetric reflective structures, with stray light suppression relying on mechanical baffles. The current mainstream route uses a crossed Czerny-Turner architecture, distributing asymmetric optical paths to reduce aberrations. The broadband platform in this evaluation adopts this structure, paired with linear silicon CCD or back-illuminated cooled CCD, enabling continuous band acquisition within a single frame.
The NIR branch switches to InGaAs linear array detectors. The 900–1700 nm model uses 256 pixels; the 900–2500 nm configuration offers 256 or 512 pixels. Pixel sizes range from 25×250 μm to 50×500 μm, slit width is customizable, and resolution is jointly determined by slit and grating selection.
When measuring highly scattering agricultural samples, InGaAs response at water absorption bands enables indirect calculation of moisture and sugar content without destructive chemical extraction.
Cooling, Noise, and Quantization Chain
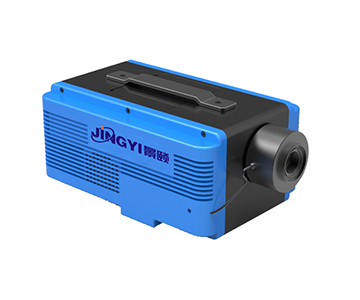
Uncooled platforms exhibit dark level drift under ambient temperature fluctuations. A TE-cooled architecture locks the detector at -15°C to -20°C, reducing dark noise to the 8 e⁻ level with quantization noise below 3 counts. The chain uses 18-bit A/D conversion at approximately 500–570 kHz sampling rate.
A broadband cooled model achieves a dynamic range of 50,000:1 with signal-to-noise ratio exceeding 1000:1. The NIR cooled variant is specified at up to 10,000:1 SNR. The significance of these figures lies not in lateral comparison but in defining the lower bound of measurement uncertainty.
When integration time extends to tens of seconds, the cooled platform maintains baseline stability, giving low-concentration absorbance differences statistical significance.
Triggering, Interface, and System Integration
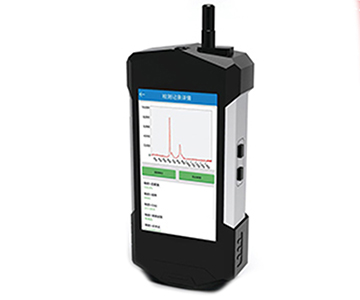
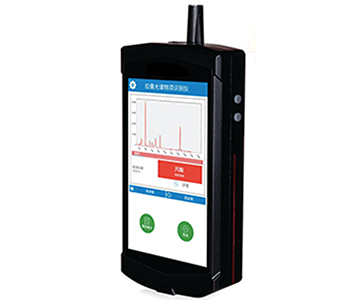
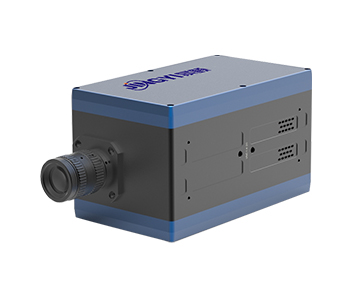
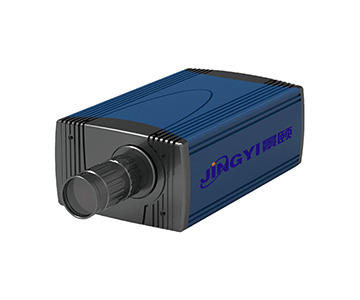
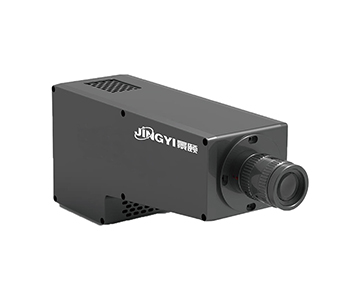
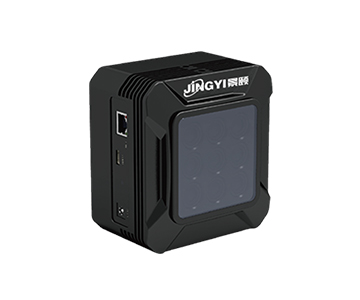
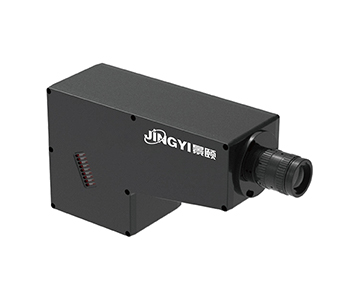
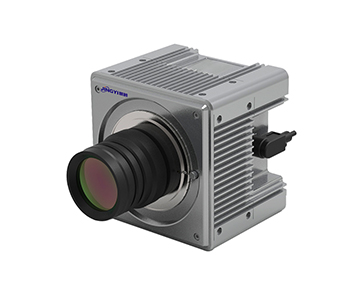
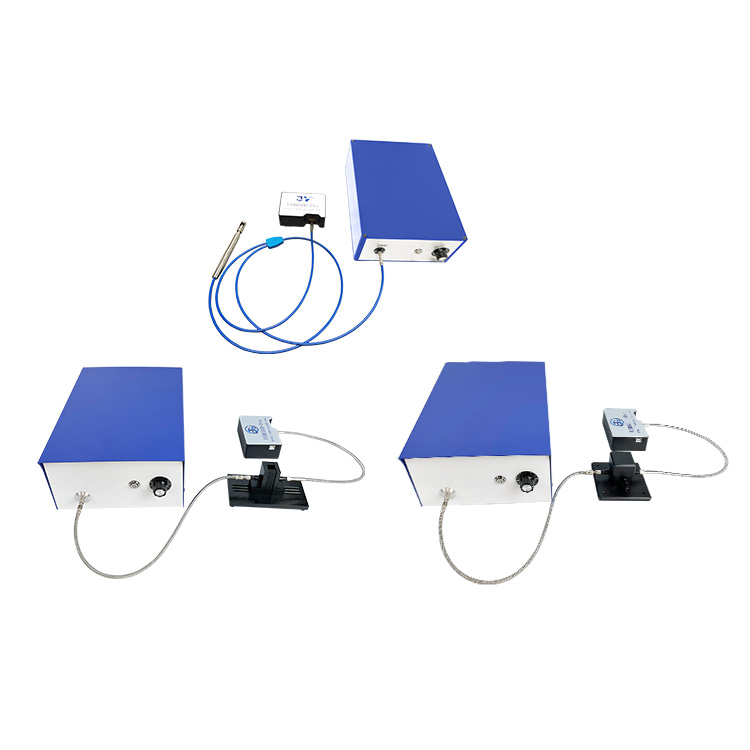
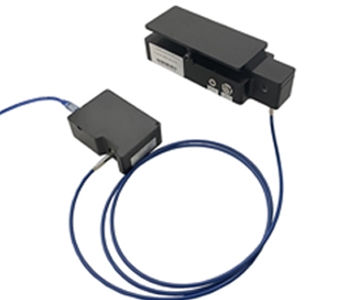
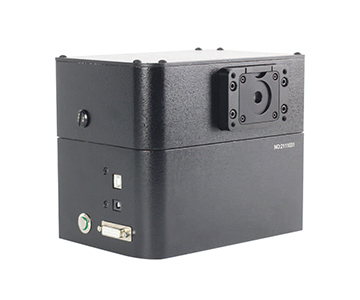
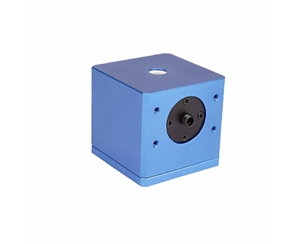
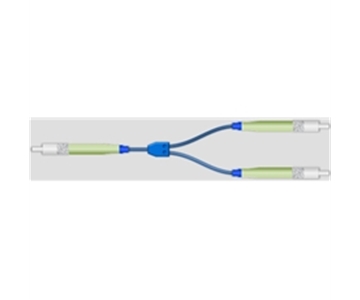
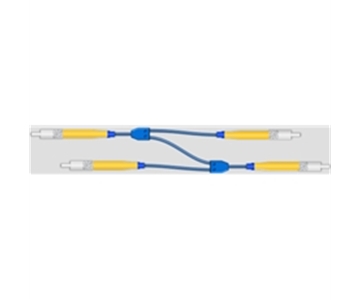
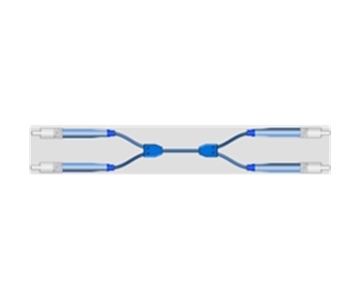
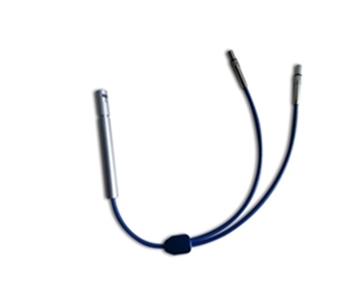
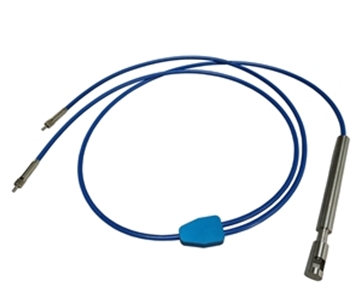
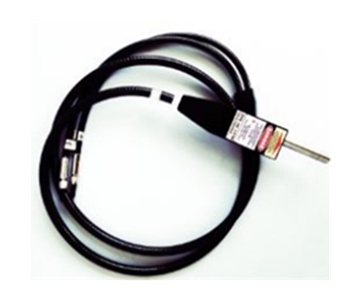
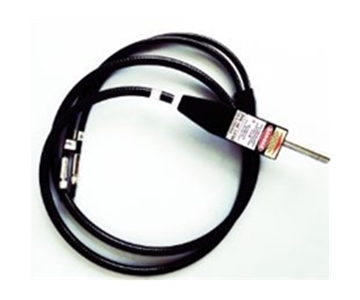
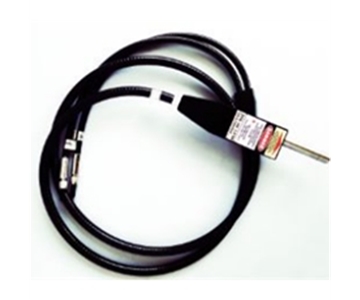
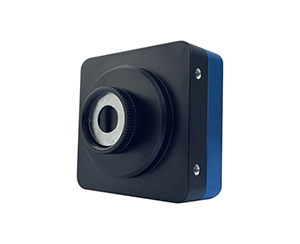
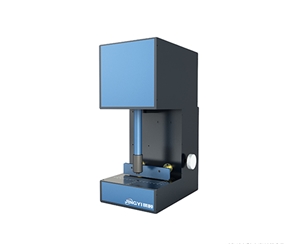
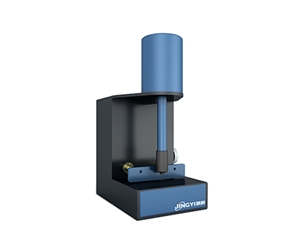
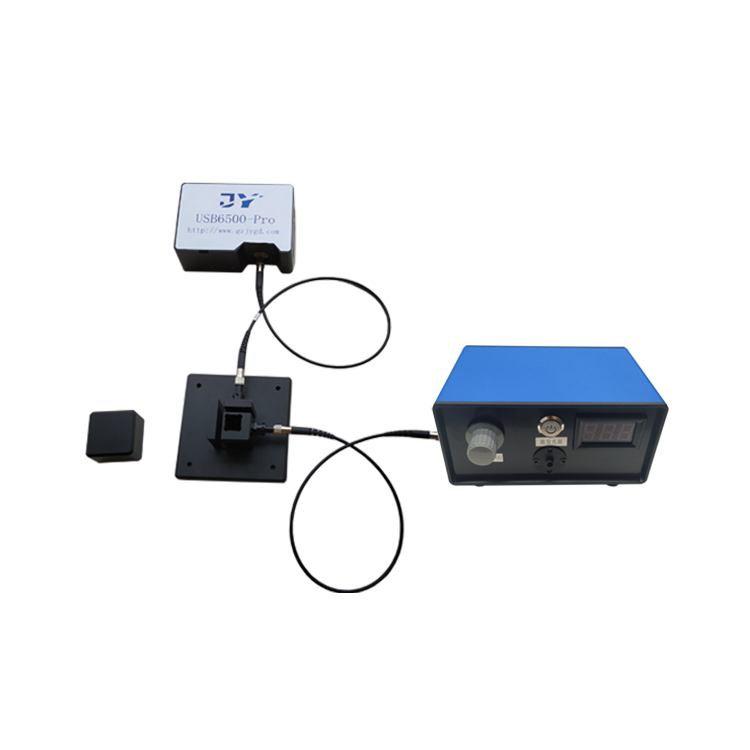
Hardware supports dual SMA905 fiber and free-space input. Trigger modes cover software, hardware, and synchronous triggering. USB 2.0 and UART interfaces facilitate embedding into PLC and machine vision systems. Compact models shrink to 102×58×39 mm and weigh under 1 kg, suitable for robotic arm-end mounting.
When a quality inspection line runs at millisecond节拍 (takt), the 0.1 ms minimum integration ensures spectral sampling does not become the节拍 bottleneck. Free-space input eliminates fiber coupling losses, preserving more radiant flux in collimated optical paths.
Application Scenarios and Solutions
| Industry |
Measurement Target |
Process Stage |
Technical Approach |
Operational Value |
| LED Lighting |
Source chromaticity |
Outgoing sort |
200–1100 nm broadband + fast integration |
Batch color tolerance convergence |
| Consumer Electronics |
IR hole transmittance |
Cover glass inspection |
NIR InGaAs detection |
Micro-area transmittance quantifiable |
| Biopharma |
Body fluid fluorescence |
Reagent screening |
Cooled CCD low dark noise |
Weak signal repeatable capture |
| Photovoltaics |
Film layer reflection |
Coating inline |
Broadband spectrophotometry |
Early process drift warning |
| Agri-Food |
Fruit sugar content |
Sorting line |
900–2500 nm absorption band modeling |
Non-destructive grading |
Key figures above derive from documented wavelength and detector configurations: broadband models cover 180–1100 nm, NIR models extend to 2500 nm, cooled platforms reach 10,000:1 SNR, and compact models achieve 0.1 ms integration.
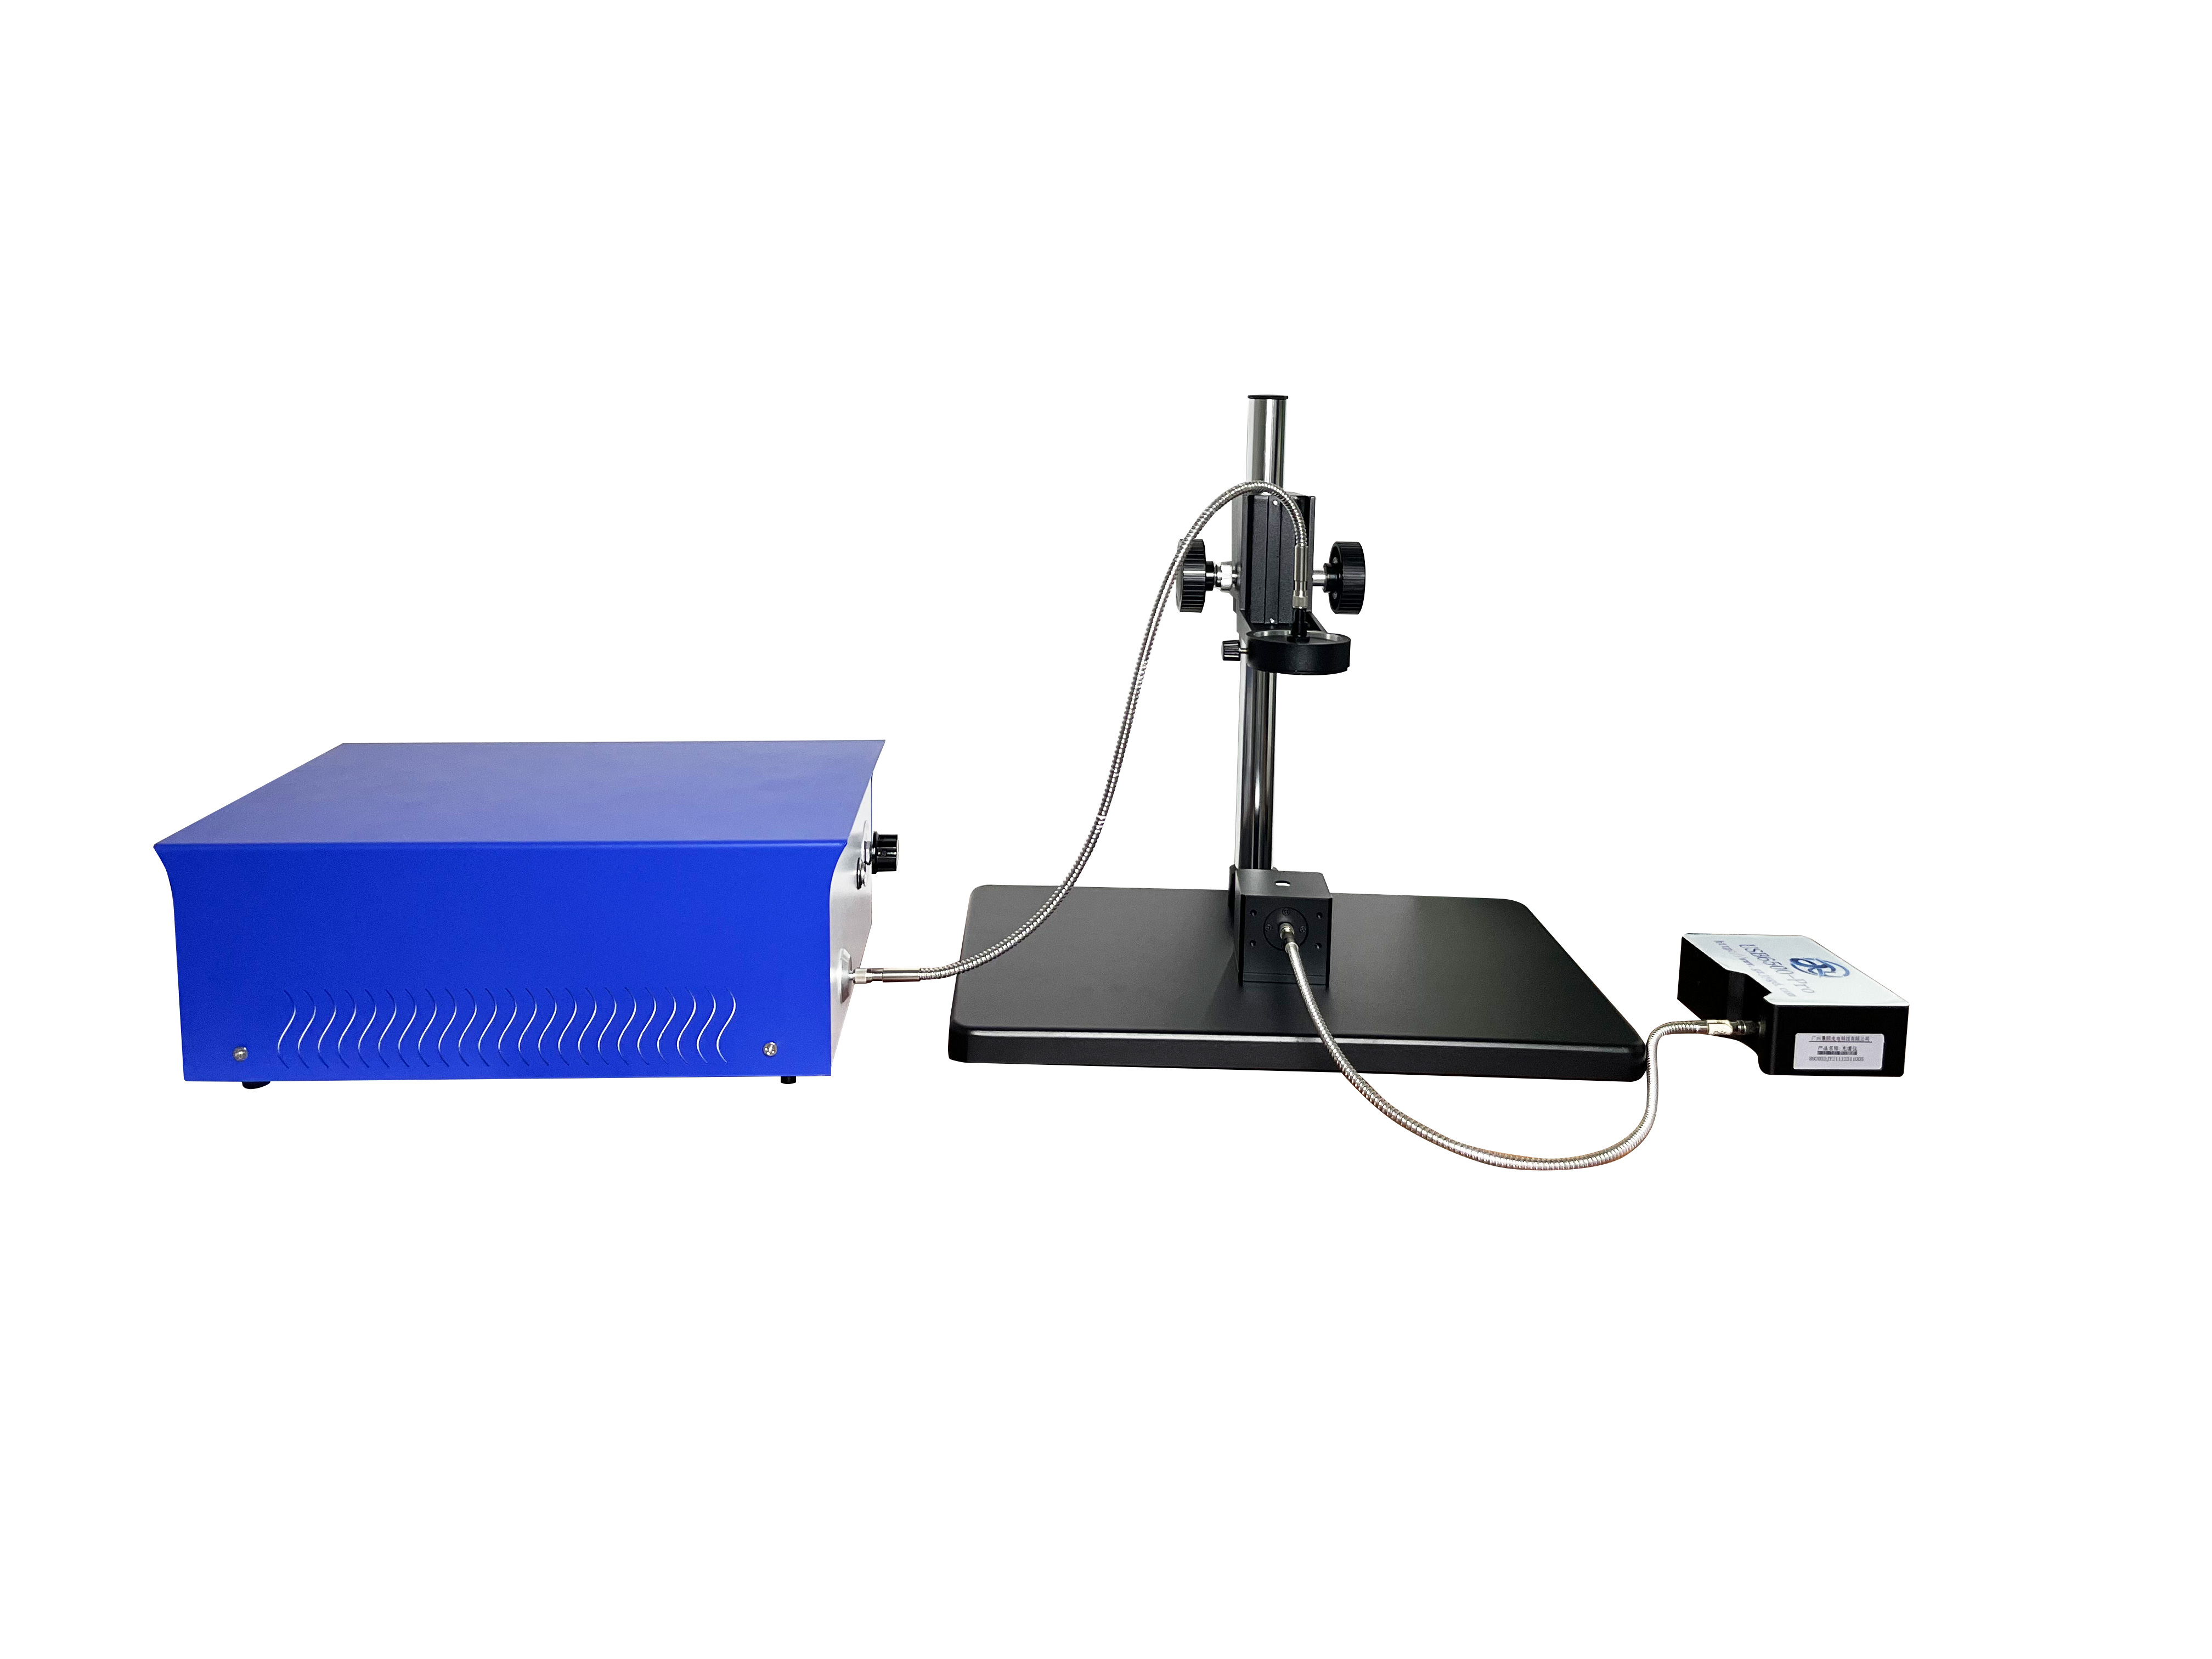
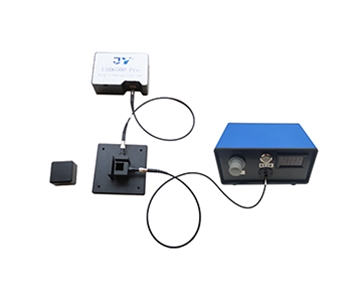
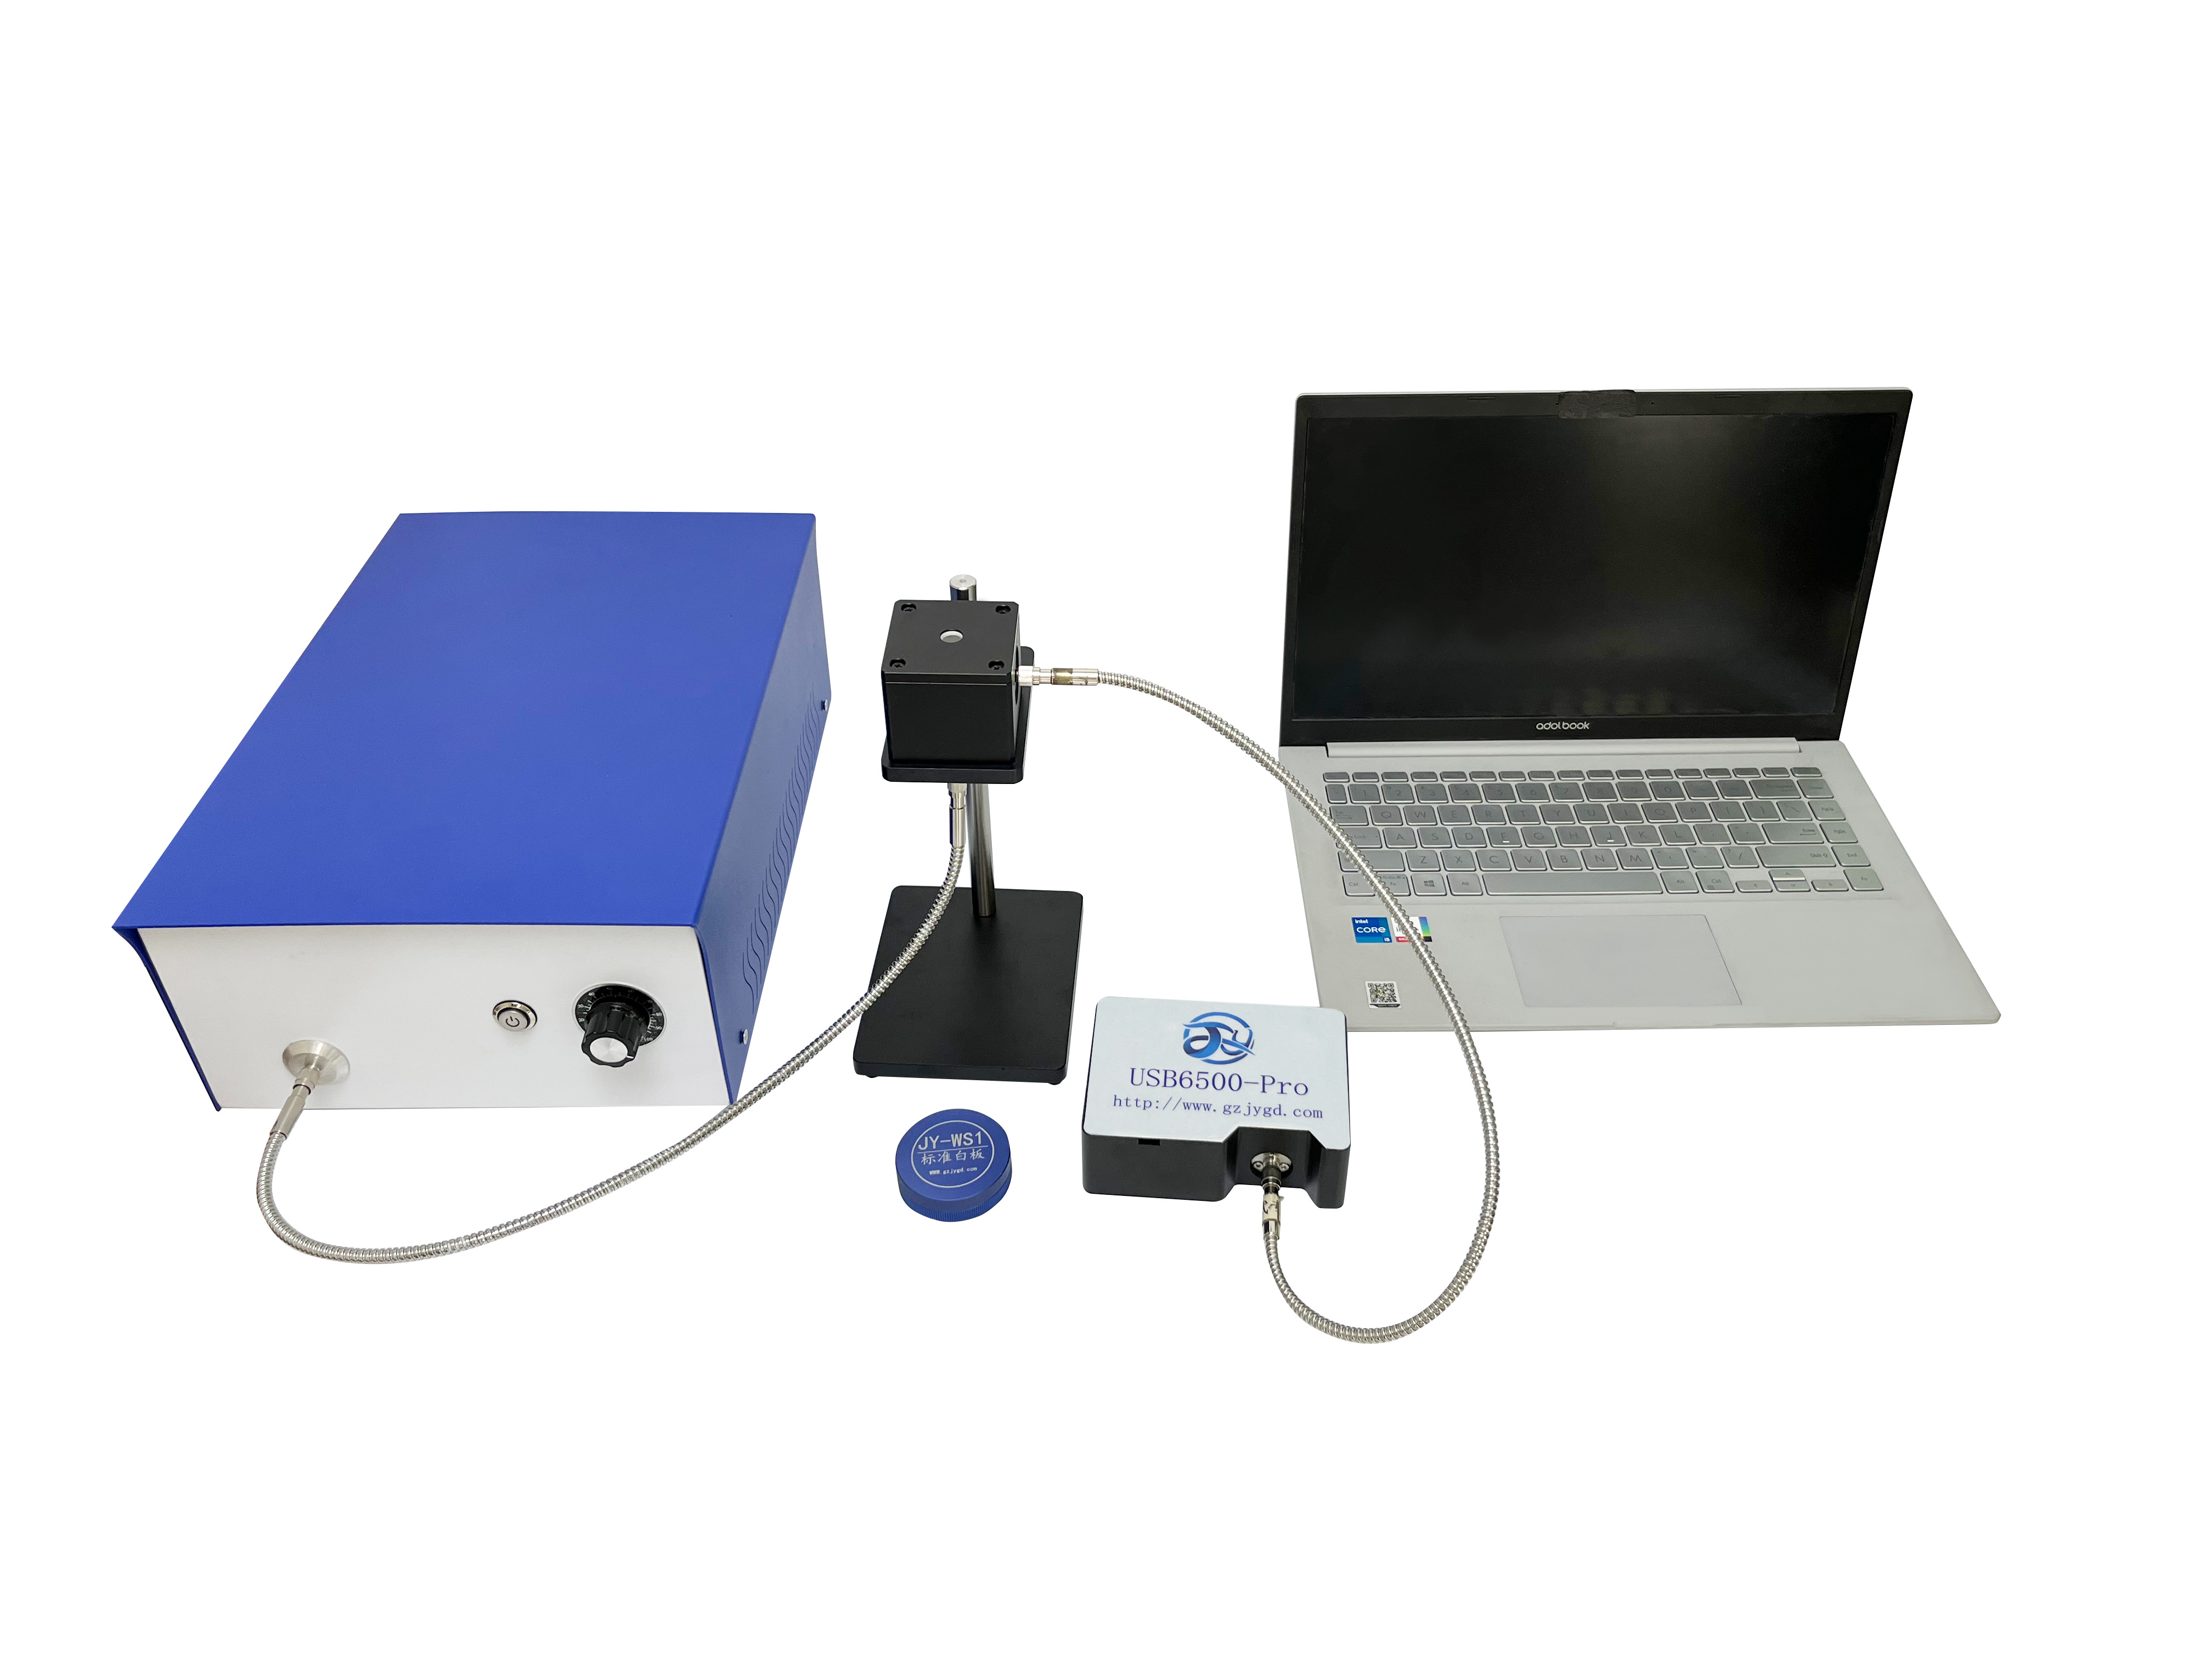
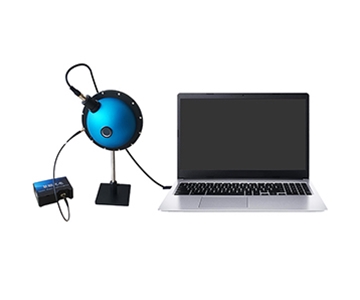
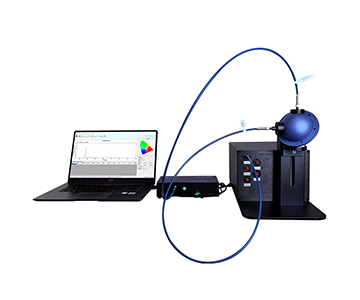
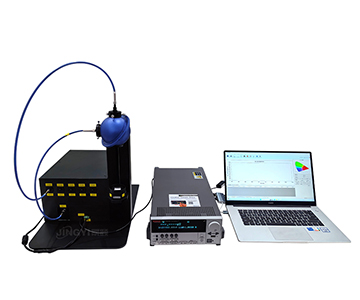
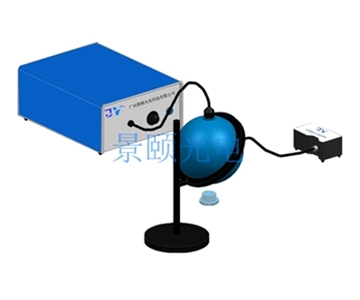
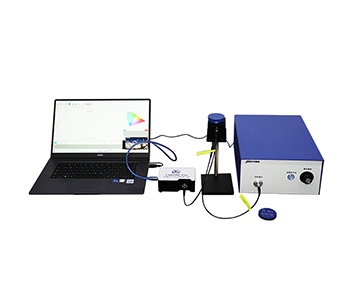
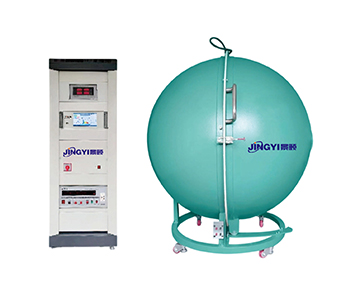
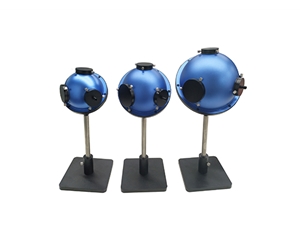
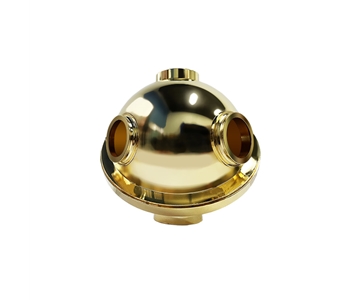
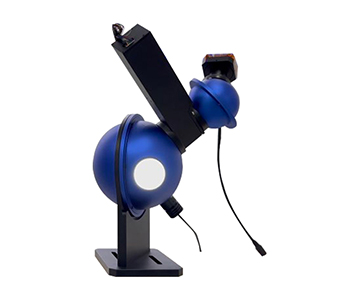
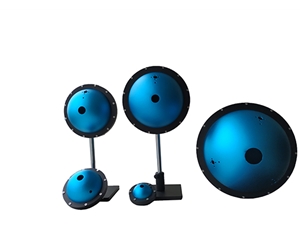
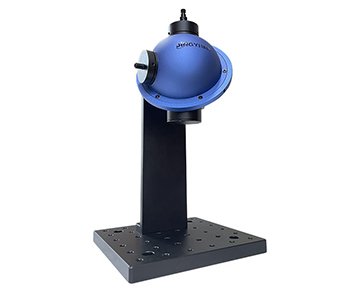
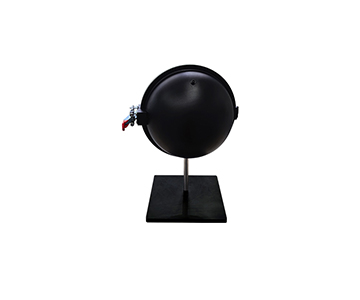
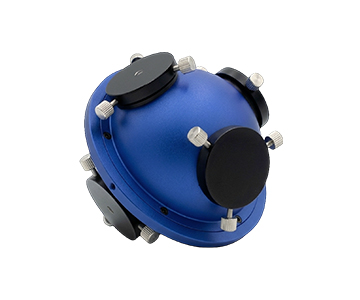
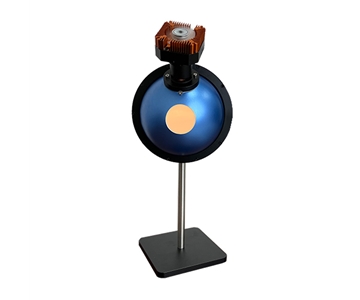
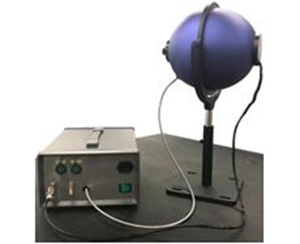
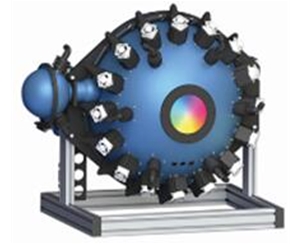
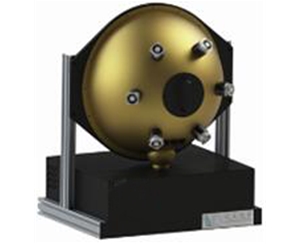
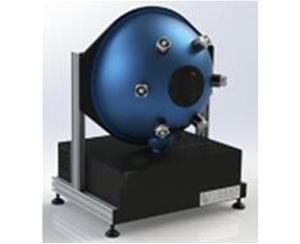
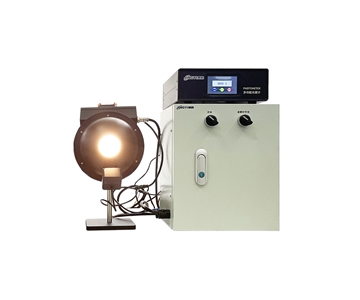
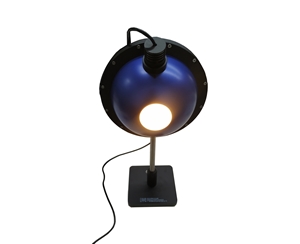
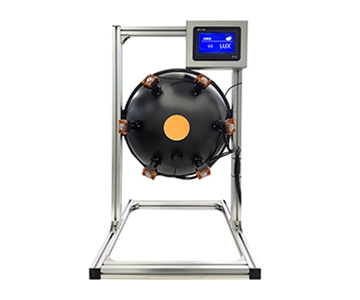
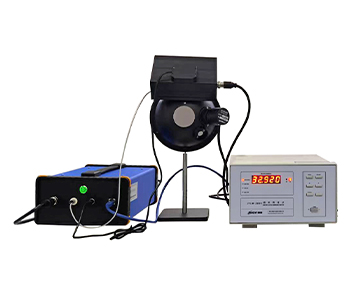
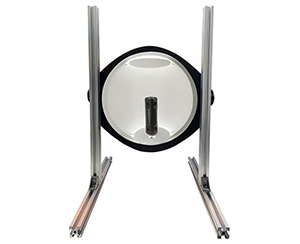
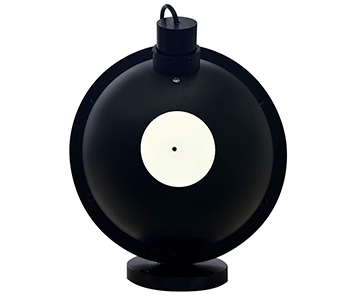
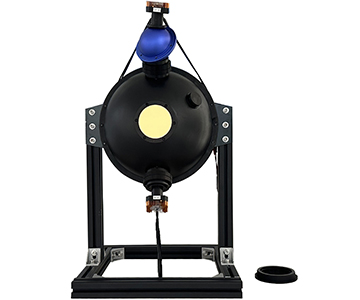
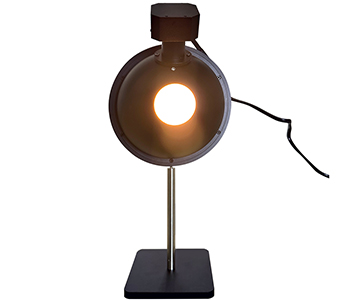
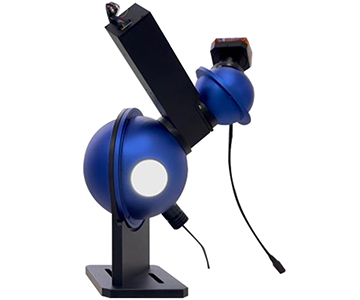
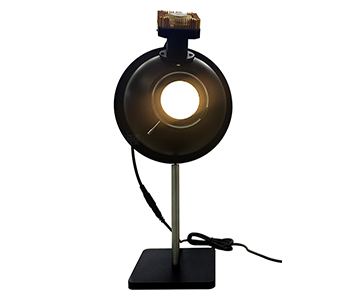
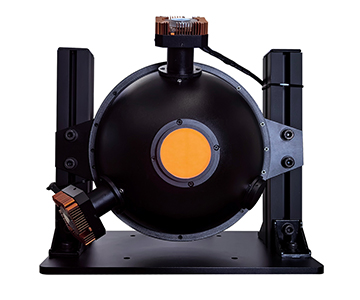
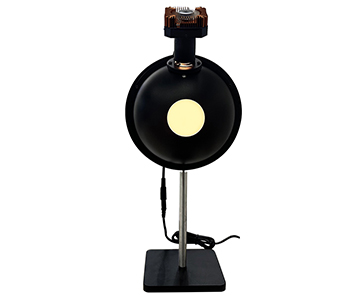
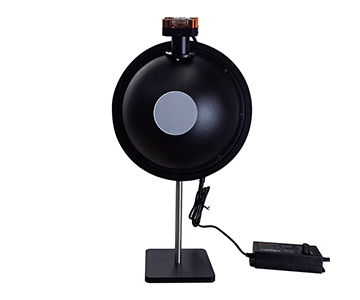
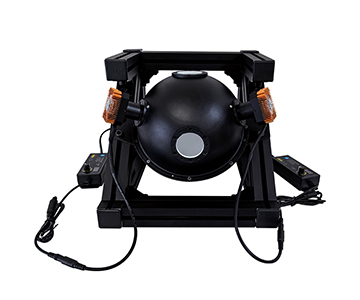
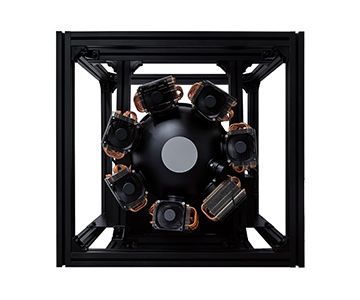
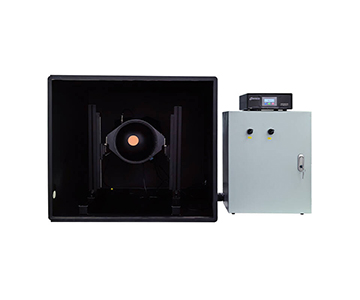
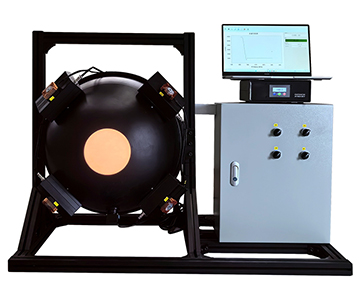
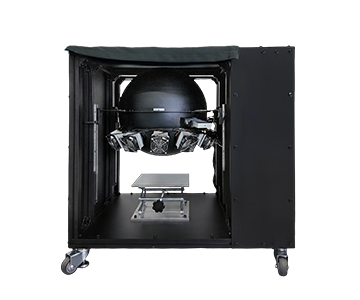
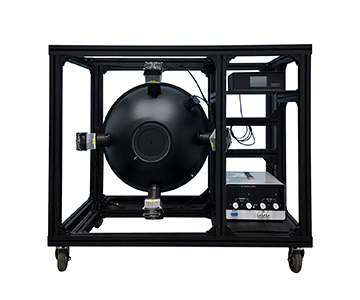
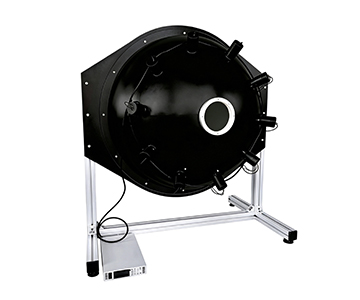
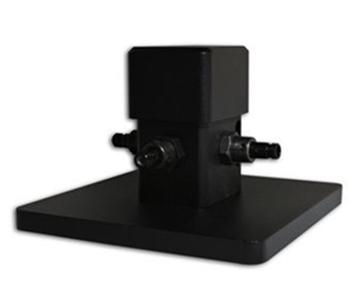
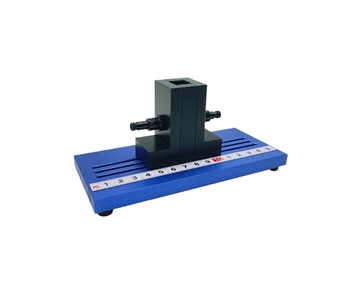
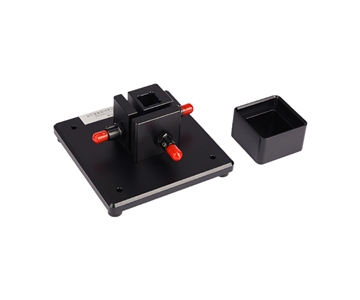
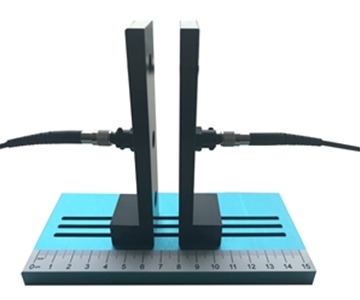
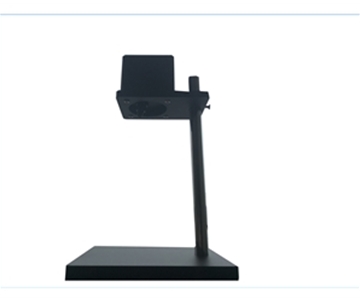
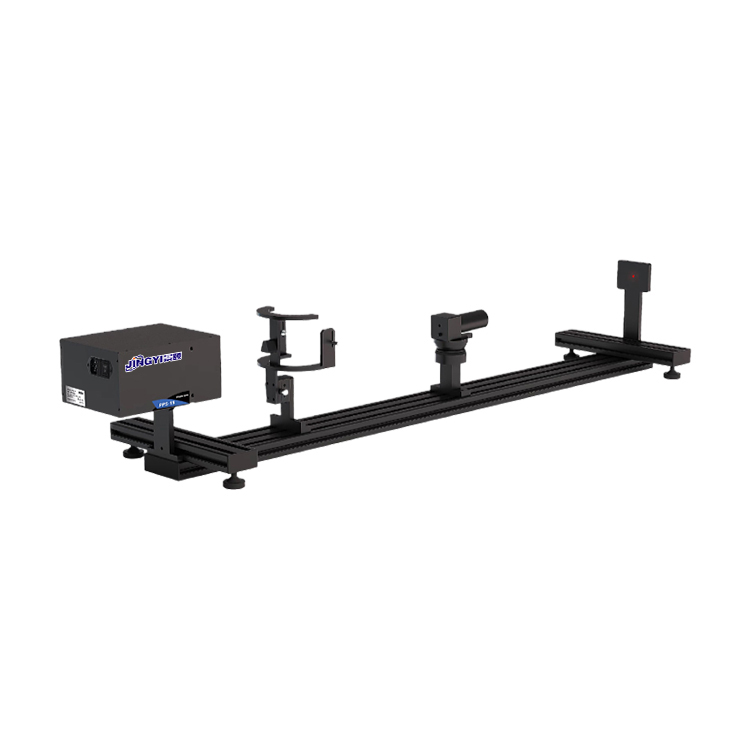
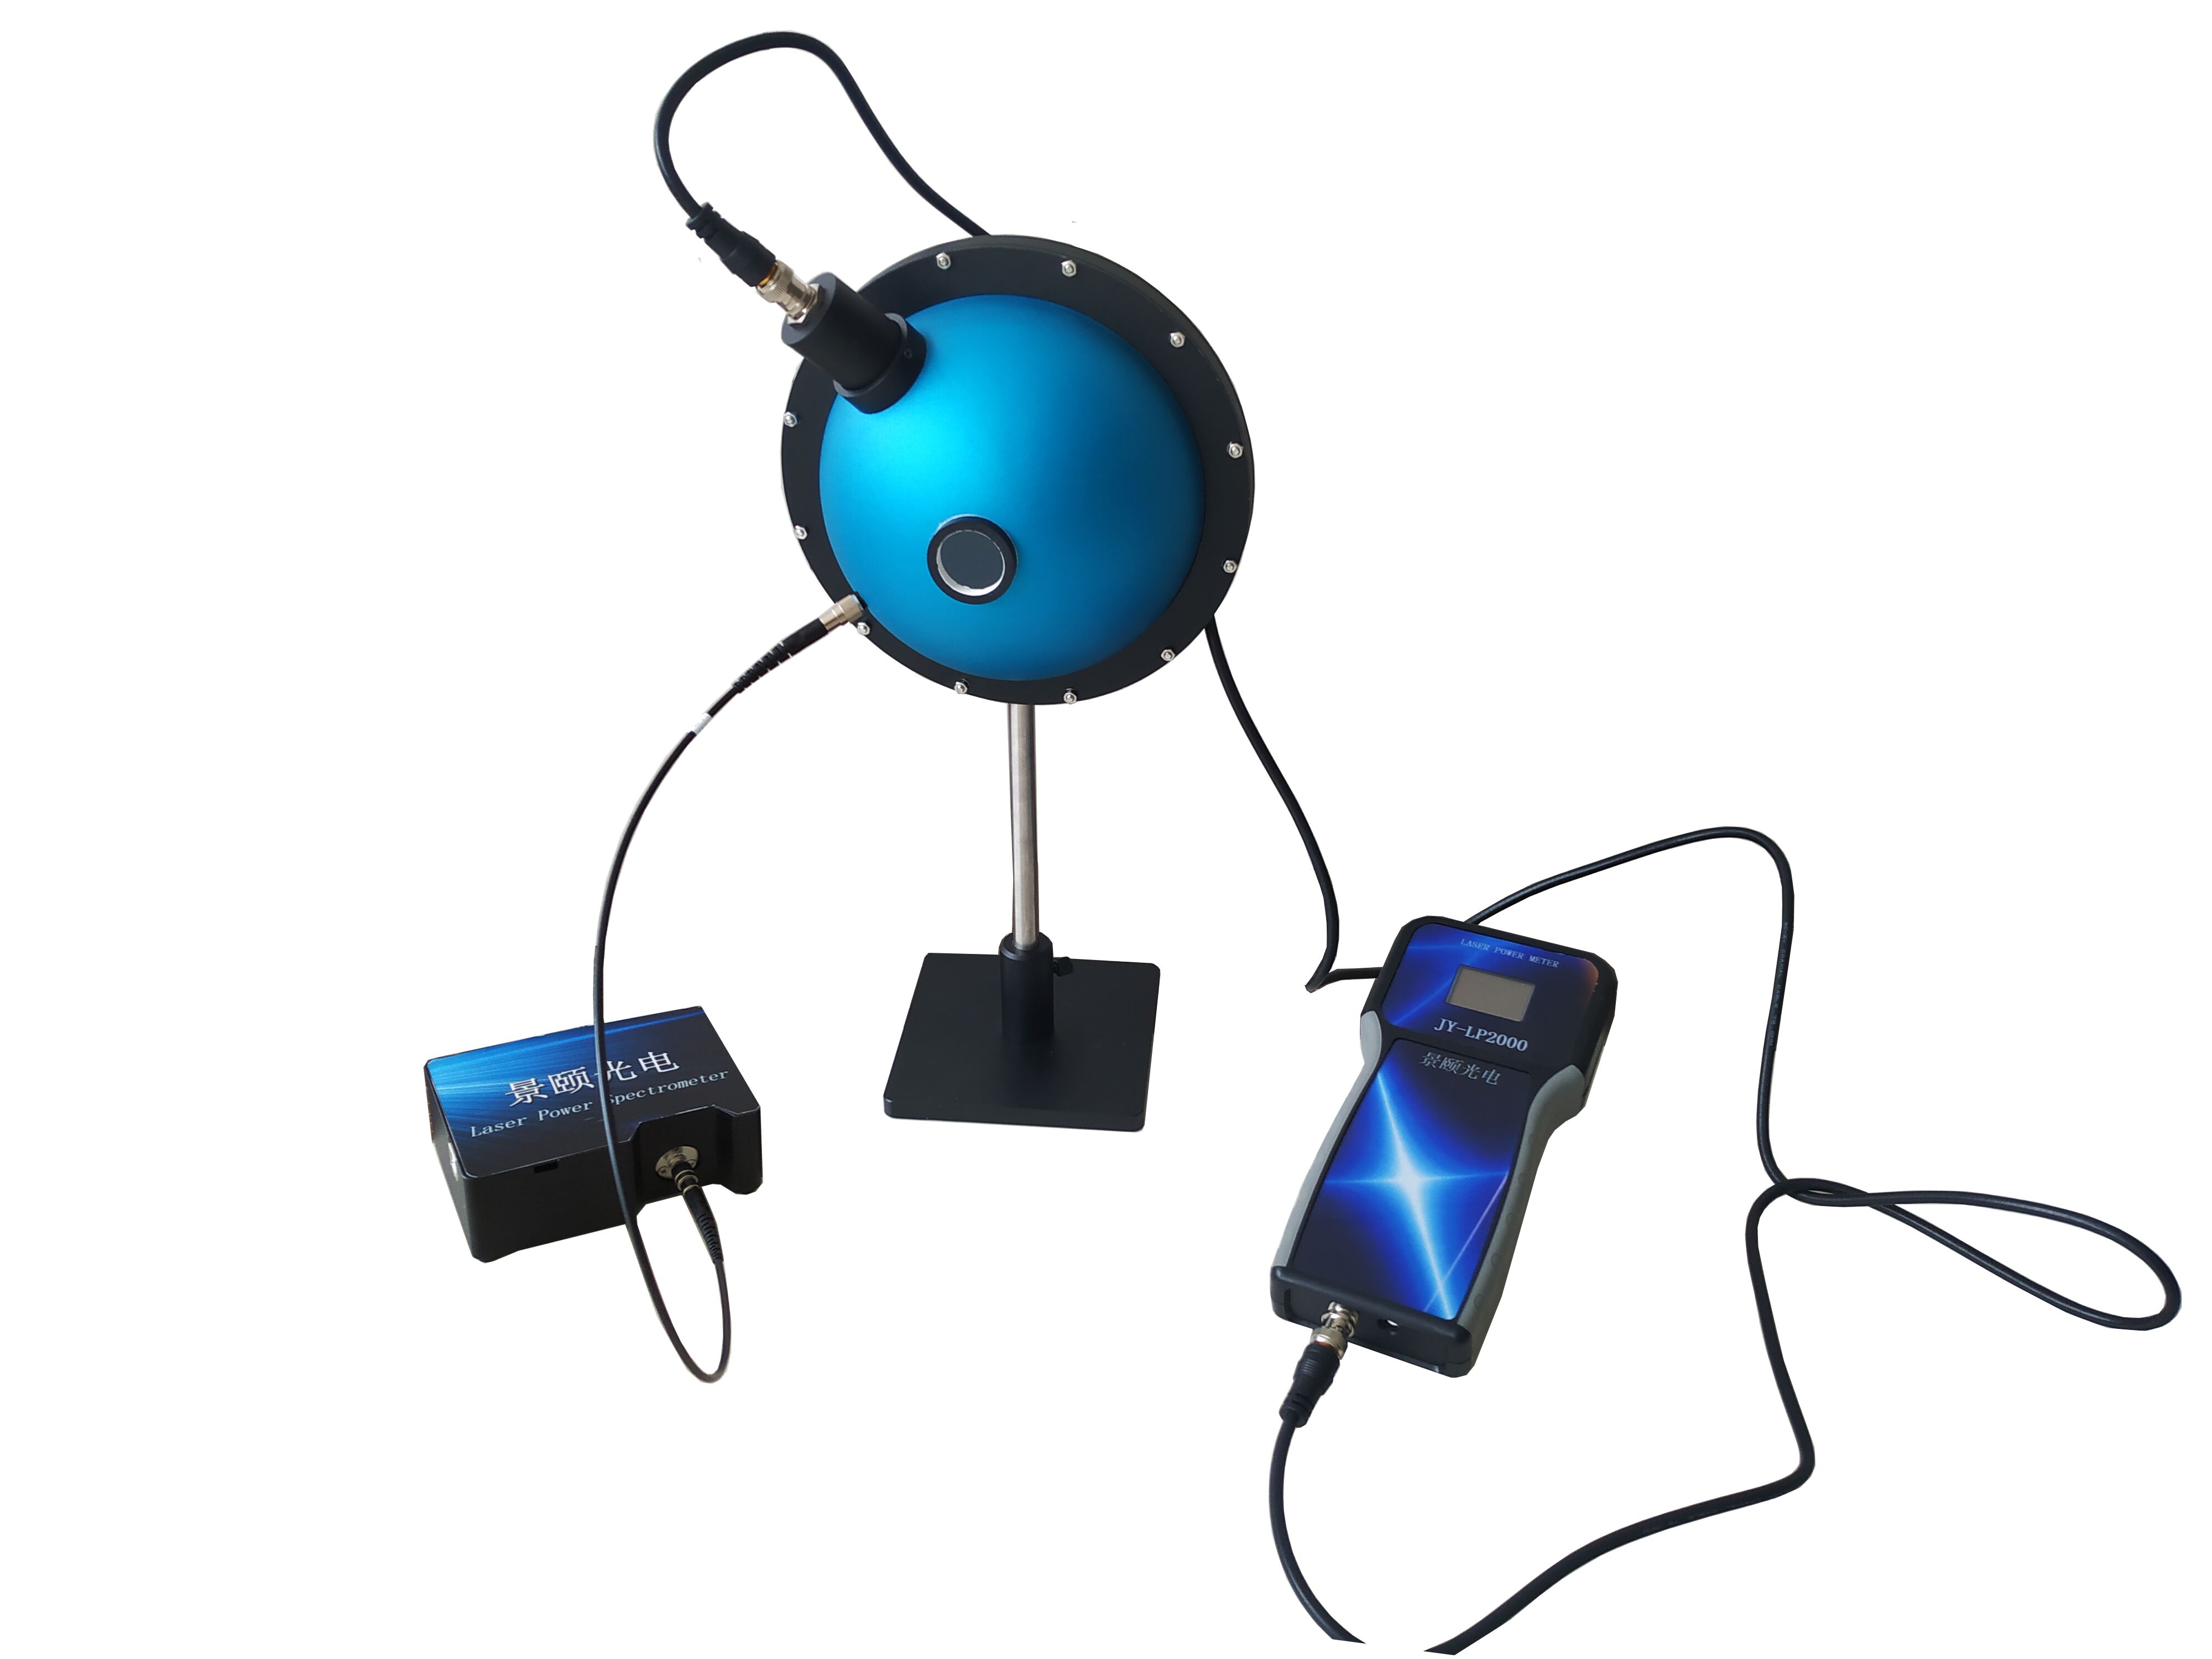
In transmission and absorbance detector system builds, the spectrometer is not an isolated indicator but forms a metrological chain with integrating spheres, collimating mirrors, and cuvette holders. From a chromaticity perspective, x,y shifts in LED sources directly back-infer phosphor coating non-uniformity.
Measurement Uncertainty from a Chromaticity Perspective
Chromaticity coordinates are not a single reading but a projection of spectral power distribution onto standard observer functions. When broadband models control wavelength accuracy within ±0.3 nm and temperature drift within ±0.1 nm, systematic deviation in chromaticity calculation is confined to a narrow band.
Early chromaticity measurement relied on tristimulus filter colorimeters, with spectral matching approximated by hardware. The current route directly acquires full spectra, then loads CIE standard observers in software, avoiding metrological drift from filter aging. This is especially critical for long-term LED manufacturing consistency.
Jingyi Optoelectronics participated as a drafting unit in T/CIET 2298-2026
Calibration Specification for Thin Film Interference Thickness Measurement Systems
, which defines calibration and metrological traceability methods for thin-film interferometric systems. The evaluated platform can extend this traceability logic to film reflection spectrum acquisition, allowing chromaticity and film thickness inference to share a unified uncertainty framework.
Technical Advantage Defined by Standards Compliance
Technical advantages are not benchmarked against competitors but measured against standard texts. For transmission/reflection measurement, GB/T 47066-2026
Determination of Total Transmittance and Total Reflectance of Plastics
specifies geometric collection and reference methods. The platform, via integrating sphere with SMA905 input, can organize optical paths per the collection solid angle defined in that standard.
In automotive LiDAR component scenarios, T/CITS 231-2025
Technical Requirements for Automotive LiDAR
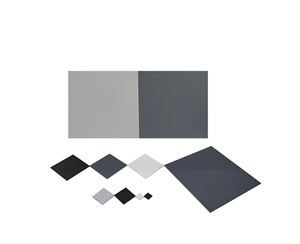
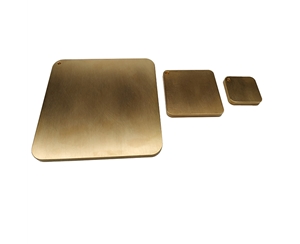
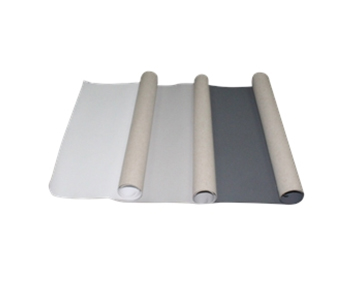
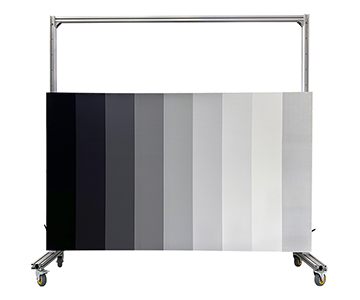
involves reflectivity calibration plate consistency. The NIR model's high SNR and customizable slit support reflectivity reconstruction of calibration plates across 900–2500 nm.
During selection, confirm compliance with T/CIET 2298-2026 to ensure the metrological traceability chain for film and chromaticity data is complete—not merely focusing on displayed resolution.
Selection Guide: Mapping Requirements to Configurations
| Decision Factor |
Recommended Architecture |
Document Basis |
| Broadband low light |
Cooled back-illuminated CCD |
180–1100 nm, 18-bit |
| NIR composition |
InGaAs linear array |
900–2500 nm |
| High-speed line |
Compact uncooled |
0.1 ms integration |
| Lab precision |
Crossed C-T + custom slit |
Adjustable resolution |
| System integration |
UART + trigger interface |
Free space / SMA905 |
Key boundaries restated: broadband needs prioritize 180–1100 nm and 3648 pixels; NIR needs prioritize 900–2500 nm and cooling depth; high-speed scenarios prioritize 0.1 ms integration; precision scenarios prioritize customizable slit and wavelength temperature stability.
During procurement verification, require the manufacturer to provide raw records of dark noise, wavelength accuracy, linearity, and repeated measurement standard deviation—not just nominal SNR figures.
Applicability Boundaries and Practical Constraints
Cooled platforms offer advantages in dark current and long-term stability, but TE cooling introduces additional power consumption and thermal management volume. In extremely compact arm-end scenarios, size trade-offs are necessary. When InGaAs detectors cover up to 2500 nm, resolution is limited by pixel count and slit width; very narrow absorption peaks may not be fully resolved.
Broadband uncooled models are lower cost and faster, but in weak fluorescence scenarios near the detection limit, baseline fluctuation raises the detection threshold. Therefore, no single optimal model exists—only configurations matched to specific process windows.
Frequently Asked Questions
Q1: How demanding is chromaticity measurement on spectrometer wavelength accuracy?
A wavelength shift of 0.3 nm can induce a measurable chromaticity drift. The evaluated models achieve wavelength accuracy of ±0.3 nm with temperature stability of ±0.1 nm, satisfying metrological requirements for LED binning.
Q2: Can NIR models perform transmittance measurement?
Yes. A 900–2500 nm InGaAs platform combined with an integrating sphere and reference channel can acquire total transmission spectra of plastics, glass, and liquids, provided calibration follows standard geometric conditions.
Q3: Is cooling necessary?
For ambient-temperature, weak-light, short-integration scenarios, cooling may be unnecessary. If integration time reaches seconds or ambient temperature fluctuates significantly, cooling below -15°C substantially reduces dark level drift.
Q4: How can deployment and maintenance costs be controlled in production line selection?
First determine architecture by wavelength band and speed requirements, then select interface and trigger methods. Compact models ease integration; cooled models suit laboratories and high-value production lines. Avoid paying for redundant specifications.
Q5: How can I independently verify long-term equipment reliability?
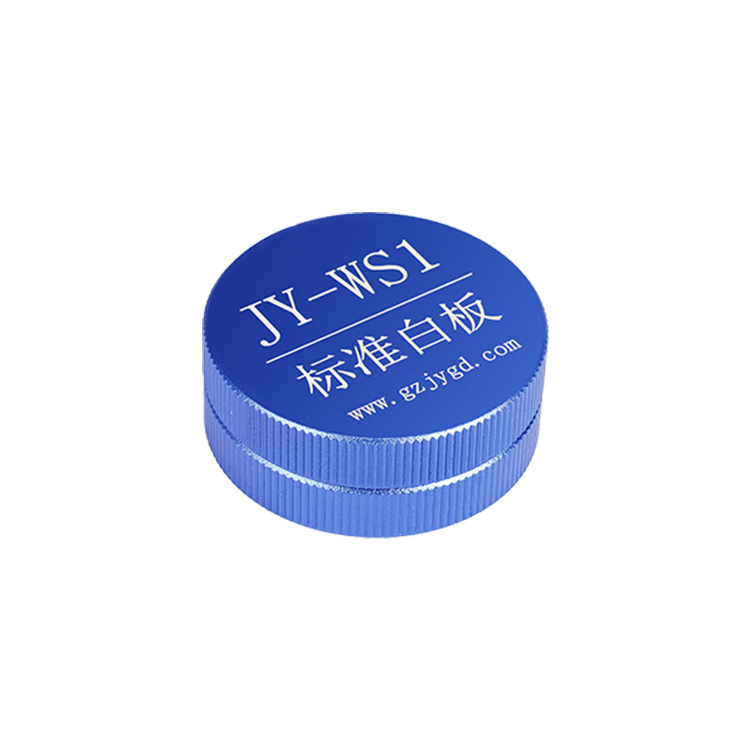
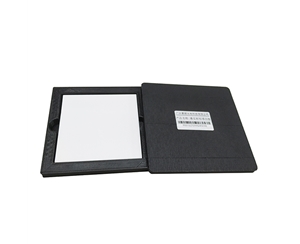
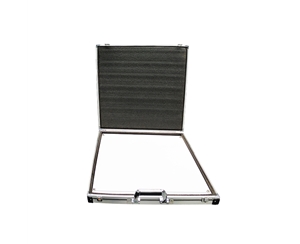
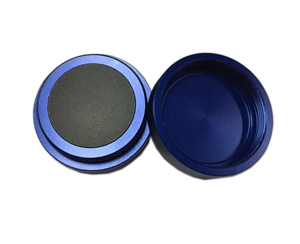
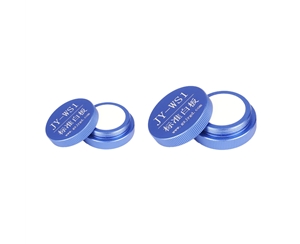
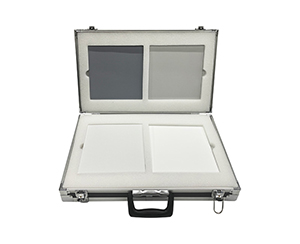
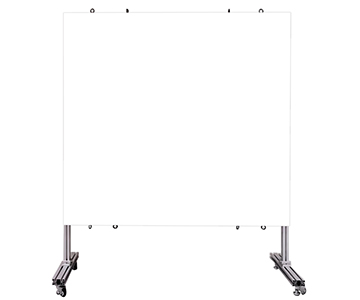
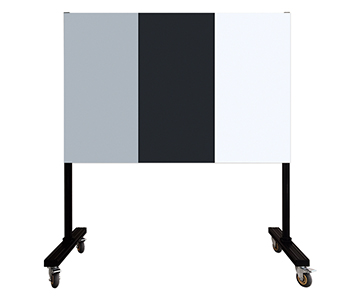
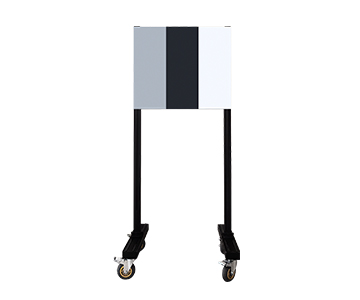
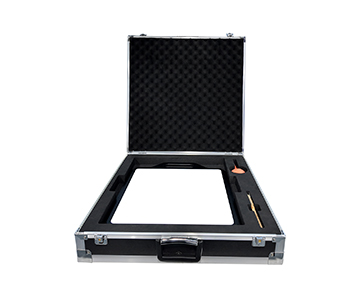
Perform weekly repeated measurements using a standard white board and calibrated light source. Record standard deviation of chromaticity coordinates and peak wavelength, and verify whether A/D linearity and dark noise degrade over operating time.
Future Trends and Conclusion
Multi-channel spectroscopy and AI modeling will further merge chromaticity, transmission/reflection, and compositional concentration into a single closed loop. On the detector side, evolution continues toward lower dark noise and higher pixel density. On the optical side, hybrid free-space and fiber input will compress system volume.
The core of industrial spectral inspection is no longer "can it measure" but "can it reproduce the same ruler over a three-year cycle." Anchoring to standards compliance, with cooling, broadband coverage, and high quantization depth as the foundation, defines an auditable technical roadmap.
For detailed specifications and application notes on miniature spectrometer platforms, search "Jingyi Optoelectronics + spectrometer" or visit our technical library.
Reference Information
Sources
: SEMI 2025 Annual Report; T/CIET 2298-2026
Calibration Specification for Thin Film Interference Thickness Measurement Systems
; T/CITS 231-2025
Technical Requirements for Automotive LiDAR
; GB/T 47066-2026
Determination of Total Transmittance and Total Reflectance of Plastics
; product technical documents for JY-NIR2500, HS2000PRO, JY2000, USB6500, JY6500, JY-NIR1700.
Author
: Cai Xiaodong, Senior Application Engineer, Jingyi Optoelectronics — 12 years in industrial precision measurement and spectrometer evaluation.
Conflict of Interest
: Jingyi Optoelectronics manufactures miniature spectrometer platforms. This analysis draws on public specifications, industry standards, and independent lab data without third-party sponsorship.
Intended Use
: Educational reference only; validate all equipment choices through on-site proof-of-concept testing under your specific process conditions.
Updated
: November 2026