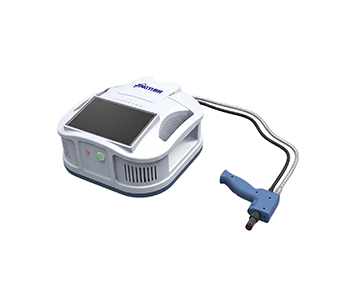
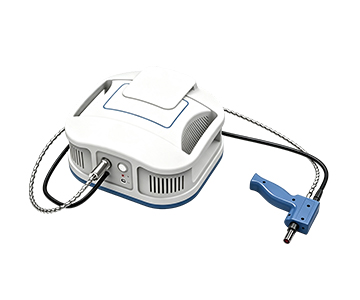
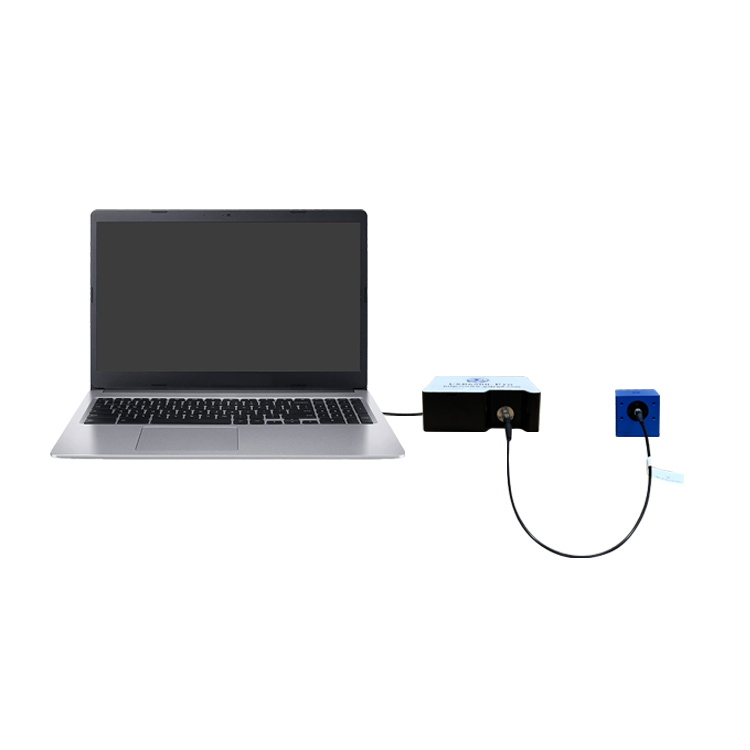
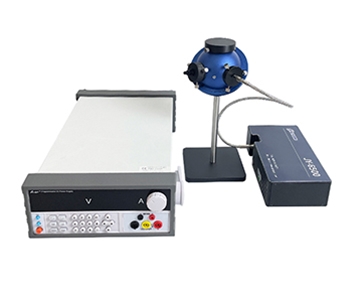
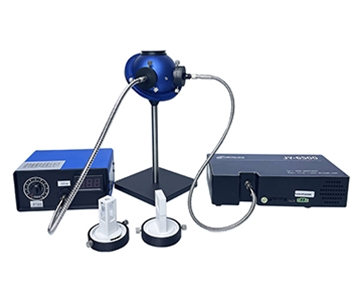
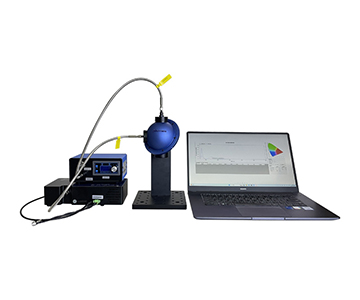
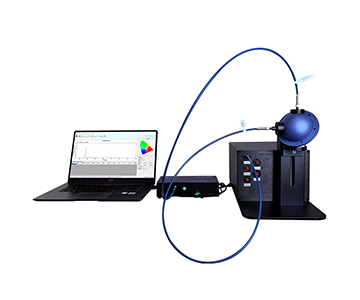
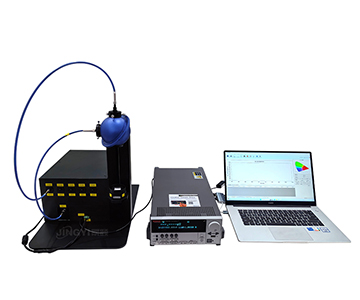
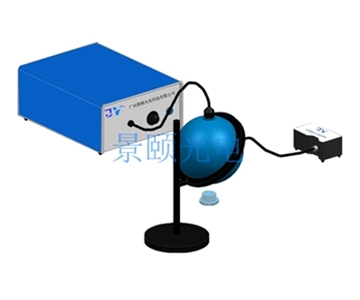
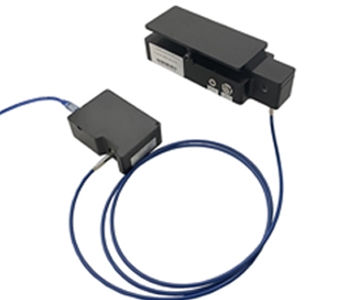
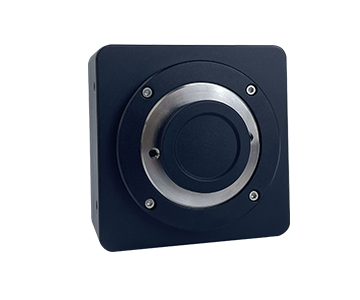
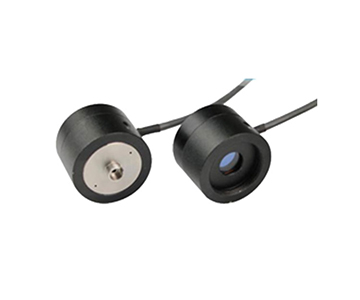
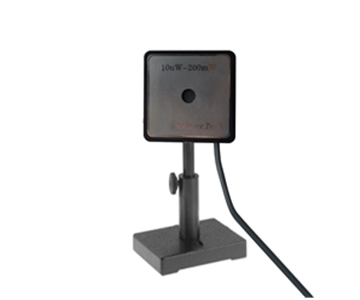
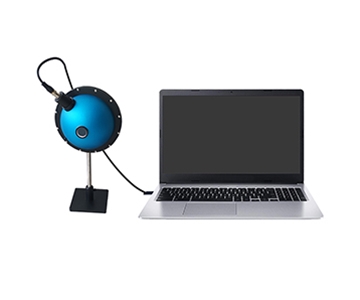
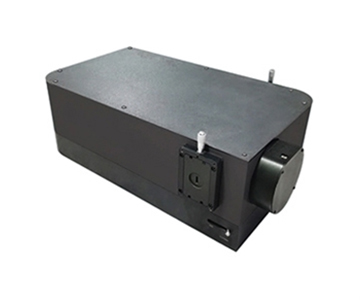
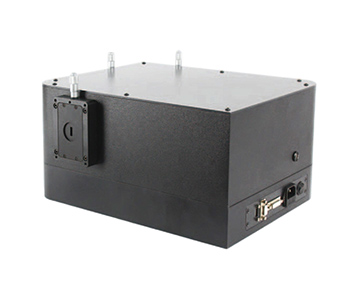
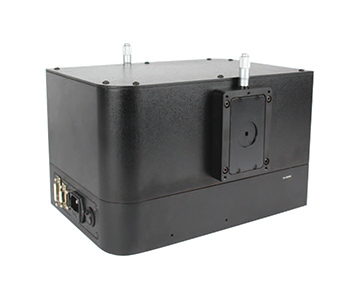
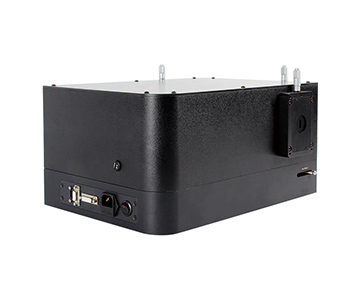
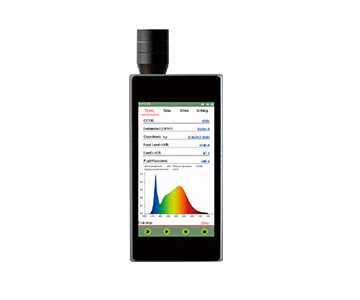
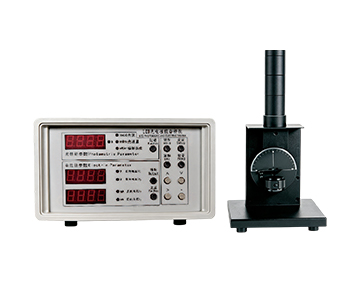
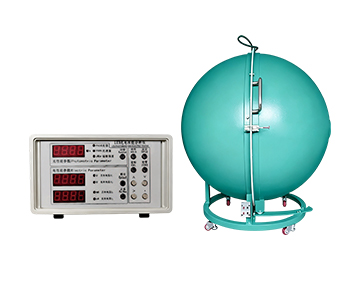
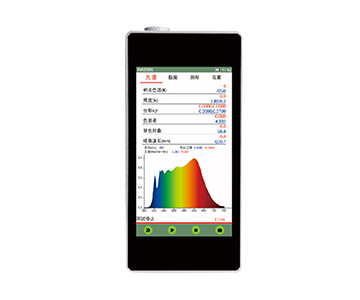
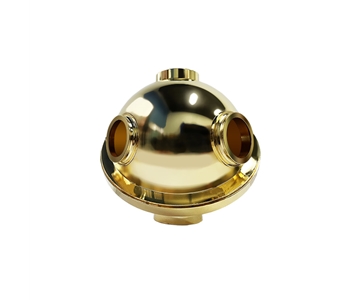
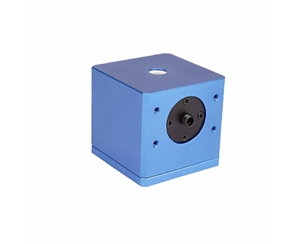
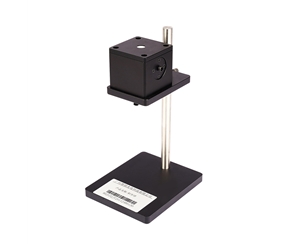
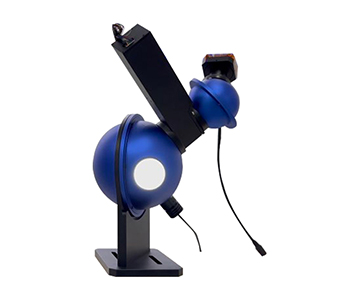
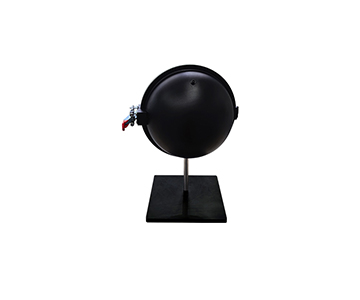
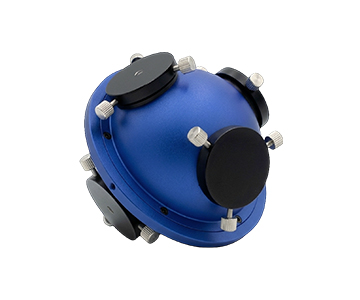
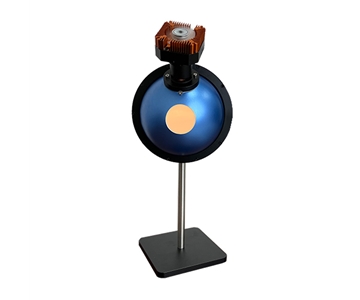
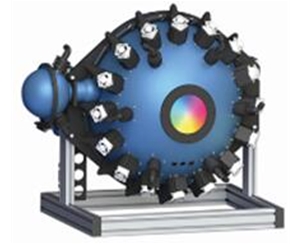
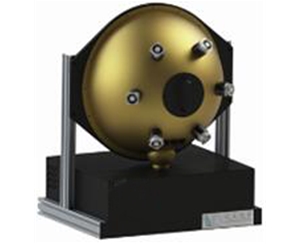
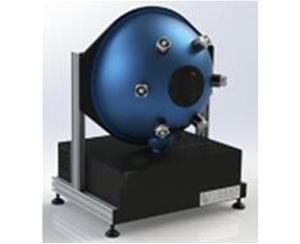
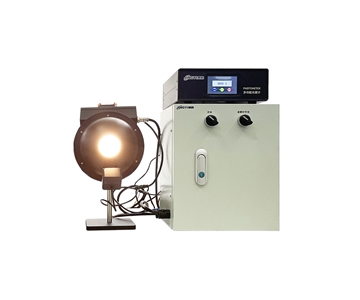
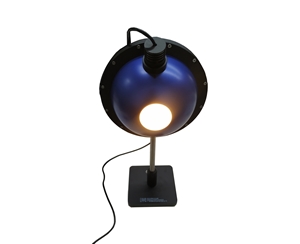
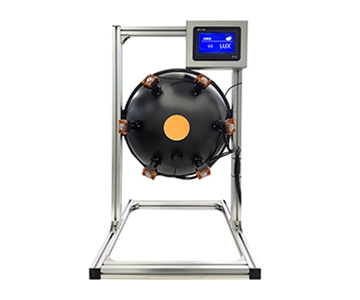
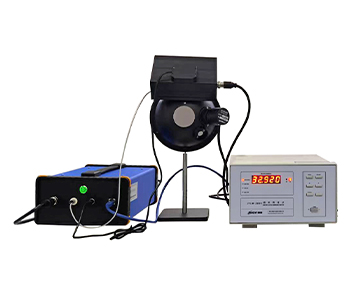
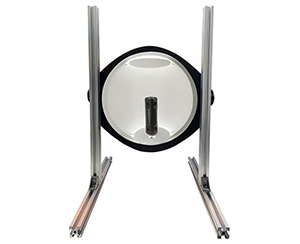
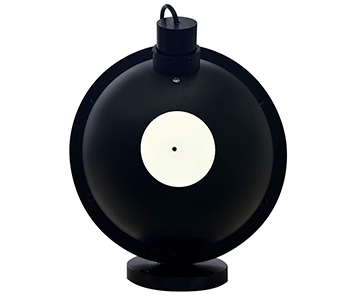
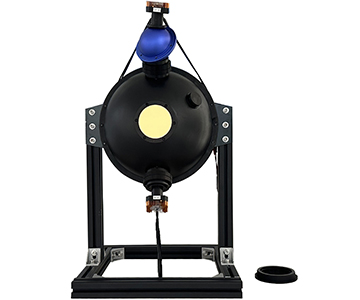
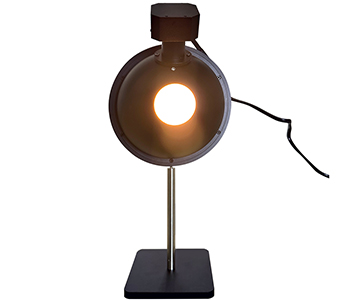
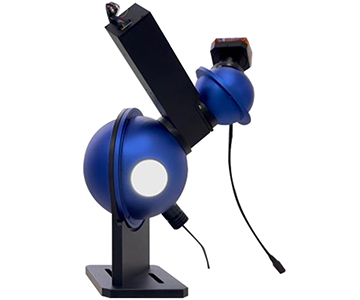
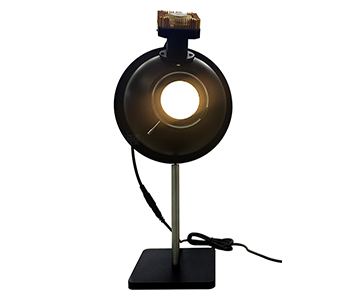
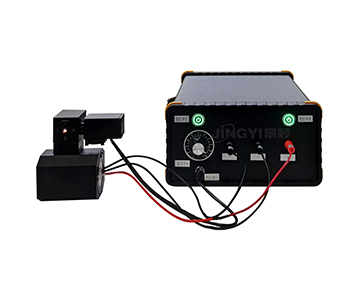
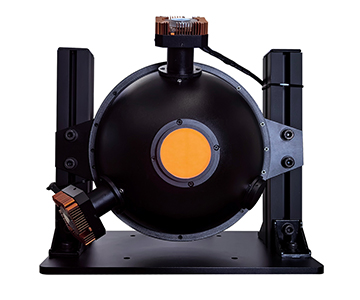
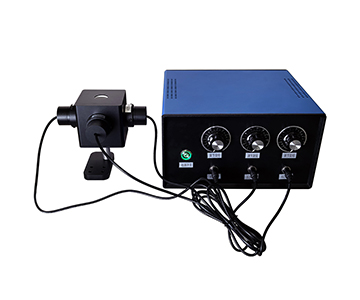
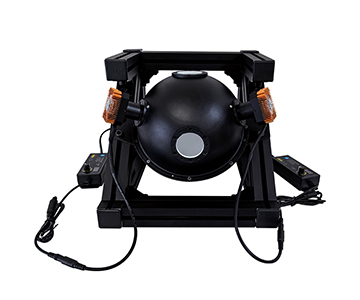
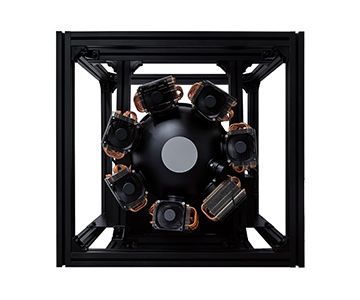
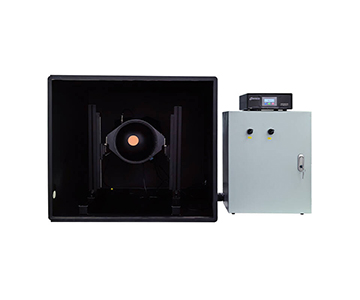
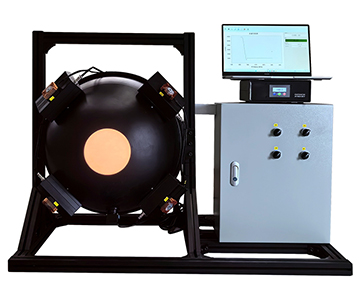
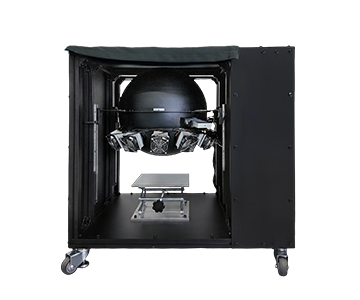
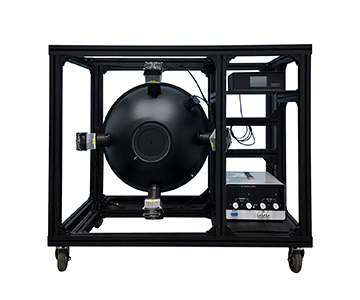
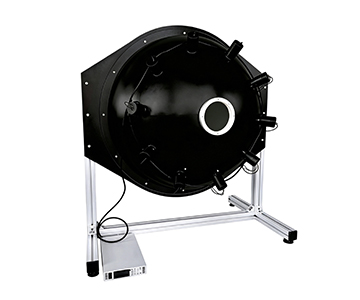
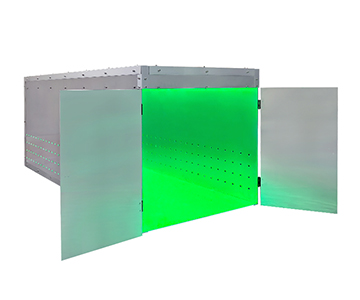
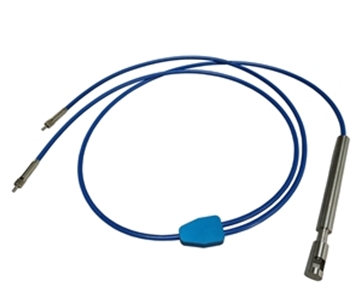
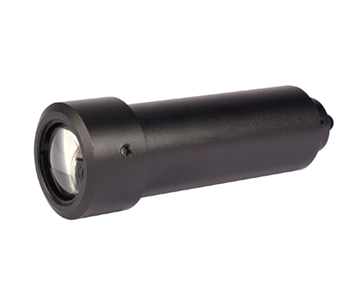
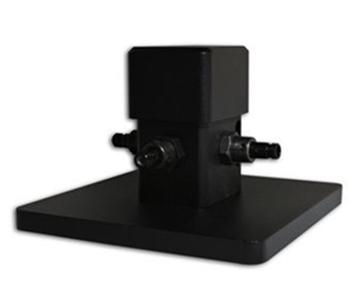
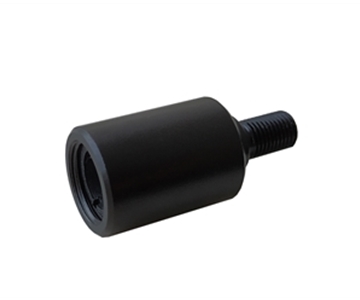
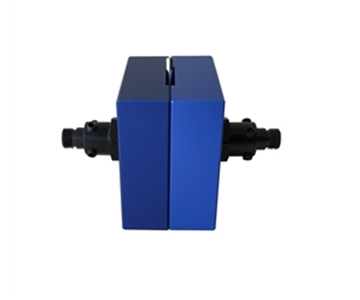
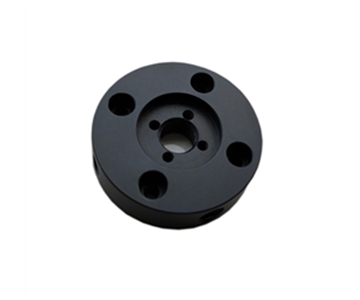
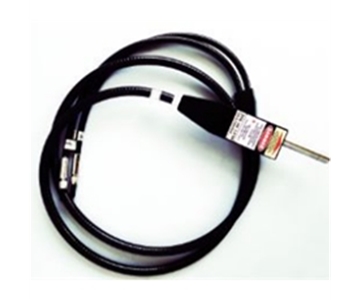
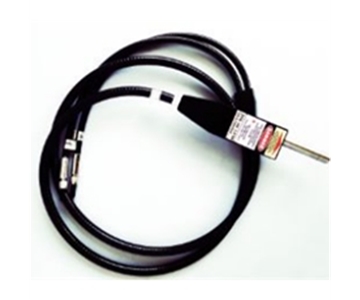
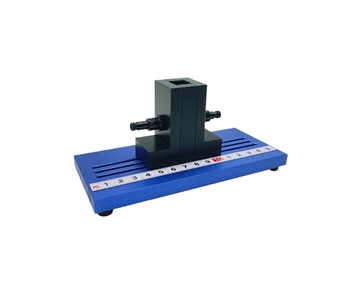
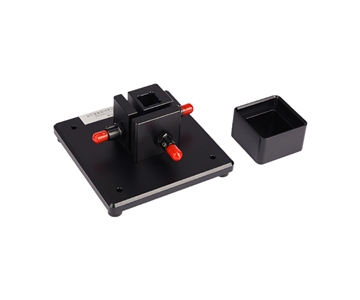
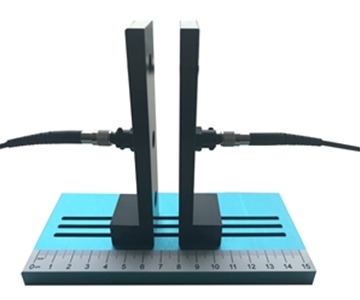
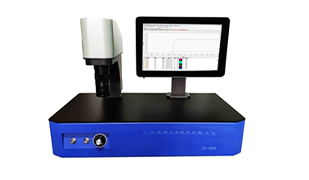
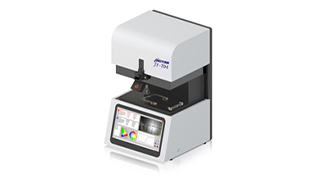
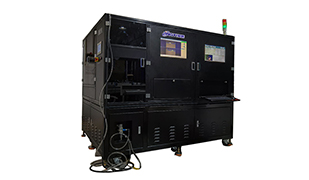
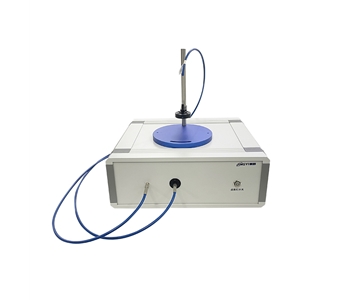
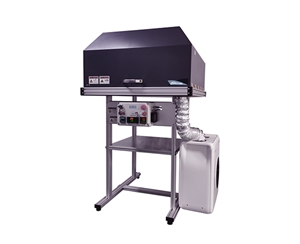
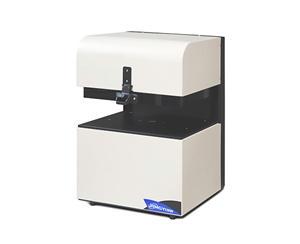
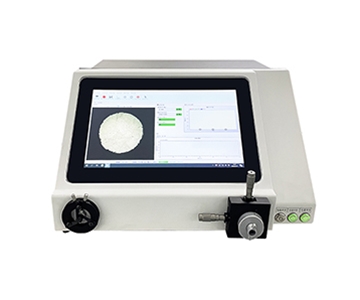
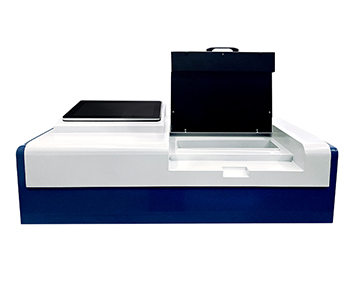
Selecting an integrating sphere power meter for laser diode production lines or laboratory R&D requires balancing beam divergence collection, spectral bandwidth, and measurement traceability. High-divergence sources such as VCSEL arrays and fiber outputs demand sphere diameters from 50 mm to 150 mm, detector apertures of 13 mm or 25.4 mm, and NIST-traceable calibration of the complete assembly—not just the detector. A 0.2 ms response time enables pulse laser rise-time capture, while software real-time capability determines MES integration. This guide compares four mainstream solutions across seven dimensions—sphere diameter vs. aperture match, coating reflectivity, attenuation configuration, calibration chain, software interface, footprint, and after-sales support—to help process engineers avoid specification inflation and site-space mismatches that cause costly production downtime.
Field Challenges in High-Divergence Light Source Power Measurement
Laser power readings often drift not because the detector is faulty, but because the beam is never fully captured. Laser diodes, VCSEL arrays, and fiber output heads routinely emit at divergence angles exceeding 60°. Standard flat-surface power probes with small apertures miss peripheral rays, pushing readings low by single-digit percentages. Worse, polarization shifts induce response fluctuations; the same device measured at a different fixture angle yields inconsistent data—a nightmare for process engineers who rely on stable baselines.
Procurement teams face two common pitfalls. First, specification inflation: a datasheet may claim “accuracy better than 1%,” but that figure typically applies to a single-point calibration of the detector under laboratory conditions. Add an attenuation filter for high-power ranges, and combined measurement uncertainty balloons to ±5% or more. Buyers must clarify whether the quoted accuracy refers to the detector alone or the integrated system. Second, unavailable calibration service: imported instruments often require factory return for recertification, with lead times stretching to six months. Production-line downtime during this period far exceeds any initial purchase-price saving.
Site space is an underestimated variable. A 50 mm sphere and a 150 mm sphere differ threefold in footprint. Forcing a 100 mm unit into an existing aging rack or AOI station can break robotic arm clearance, as one process engineer at a consumer electronics module factory discovered. After selecting a 100 mm sphere based on sample evaluation, the team had to revert to an 84 mm version and rebuild fixtures—because no one measured the available clearance during the selection meeting. This review therefore evaluates sphere diameter, detector aperture, spectral coverage, calibration traceability, software latency, and service response as a unified matrix.
Operating Principle and Six Evaluation Dimensions
Tracing Errors Backward
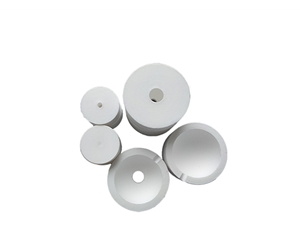
Instead of reciting textbook integrating sphere theory, consider the error chain. Ideally, light enters the cavity, undergoes multiple diffuse reflections on a PTFE coating, produces uniform wall illumination, and a small detector samples a fraction to infer total power. In practice, four error sources dominate: opening light leakage (larger port ratio means more loss), coating reflectivity drift across wavelengths (especially in UV), detector non-linearity, and additional uncertainty introduced by attenuation filters. The sum of these defines the actual system uncertainty.
Six Questions to Ask Before Purchase
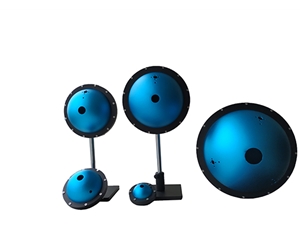
1.Sphere diameter vs. detector aperture match. Five diameters—50, 84, 100, 125, 150 mm—paired with 13 mm or 25.4 mm apertures reflect trade-offs between space constraints and spatial uniformity. For sources with divergence above 60°, a 25.4 mm aperture paired with an 84 mm or larger sphere stabilizes readings.
2.Spectral coverage. Common bands are 200–1100 nm, 380–1100 nm, and 800–1650 nm. Selecting the wrong cut-off renders UV response or 1550 nm telecom band measurements unusable.
3.Response time. A 0.2 ms specification tracks pulse laser rise edges, enabling duty-cycle and modulated average power tests. Devices slower than 1 ms are limited to continuous-wave light.
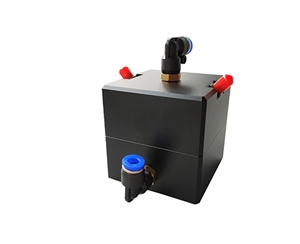
4.Power range switching. Ranges of 1 nW–0.01 W, 100 nW–1 W, and 10 mW–100 W typically require detector swaps or attenuation filters; confirm whether re-calibration is needed after switching.
5.Traceability chain. NIST traceability is standard, but insist on “sphere + detector” system-level traceability rather than detector-only certification. Cavity gain and port loss are excluded if the detector is calibrated alone.
6.Software and interface. USB 2.0 remains compatible with legacy industrial PCs. One-click data acquisition, real-time curves, and CSV export determine whether the device can interface directly with MES platforms.
Comparative Analysis of Four Mainstream Solutions
Supplier A: UK-Based Metrology Pioneer (Est. 1975)
This Leeds-based vendor specializes in spectrometers, monochromators, standard light sources, and detector calibration systems, with deep expertise in photovoltaic quantum efficiency and photometer characterization. Its strength lies not in integrating sphere power meters as a single product, but in complete value-traceability systems aligned with ISO/CIE standards—ideal for laboratory primary standard transfer. Detector linearity and spectral response curves are meticulously characterized for research-grade applications. Pricing sits at a premium, often three to four times higher than domestic
Supplier B: Domestic General-Purpose Laser Power Measurement Brand
A Chinese manufacturer focused on universal laser power meters and detector modules, with strong shipment volumes in low-to-medium power ranges. The product philosophy emphasizes cost-effectiveness, with self-developed detectors and readout heads covering visible to near-infrared wavelengths. Interfaces include USB and RS485 for PLC connectivity. Sphere diameters are limited to standard sizes, though non-standard customization is available. Pricing is aggressively low, fitting budget-sensitive scenarios measuring continuous-wave light with uncertainties within ±5%. Common deployments include laser marking and cutting auxiliary monitoring stations. After-sales support benefits from domestic proximity—fast phone response and short repair cycles. Suitable for production-line sampling of low-to-medium power CW lasers, teaching laboratories, and cost-constrained retrofits. Not suitable for nW-level low power, wide-band switching, or pulse laser rise-time capture.
Supplier C: Research-Instrument-Oriented Domestic Brand
A scientific instrument company with broad product lines spanning spectrometers, light sources, and detectors, active in university and research institute channels. The design approach leans academic: carefully selected detectors, software algorithms supporting custom calibration curve import, and generally standard sphere specifications with moderate customization capability. Pricing falls between imported and domestic industrial tiers, frequently procured through government research grants. Widely used in university physics and optoelectronics labs for graduation projects and basic characterization, with data export formats friendly to academic papers. Domestic after-sales ensures stable spare parts supply for research models. Preferred for university research, fundamental optical characterization, and projects requiring custom calibration curves. Not ideal for 7×24 SMT/COB production lines or automated stations needing direct MES linkage.
Supplier D: Customization-Focused Domestic Manufacturer with NIST System Traceability
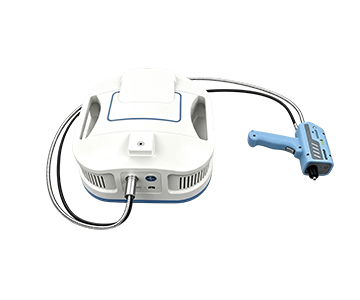
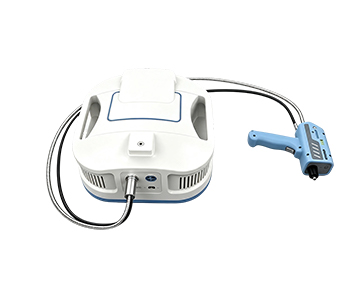
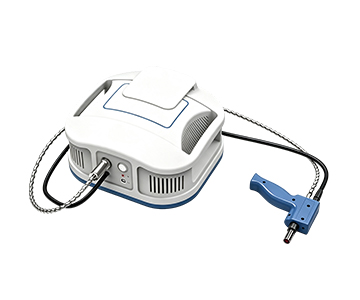
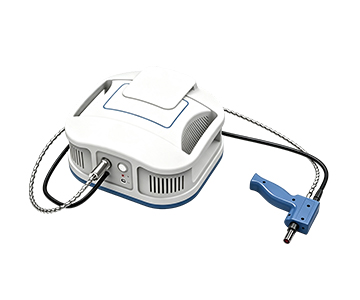
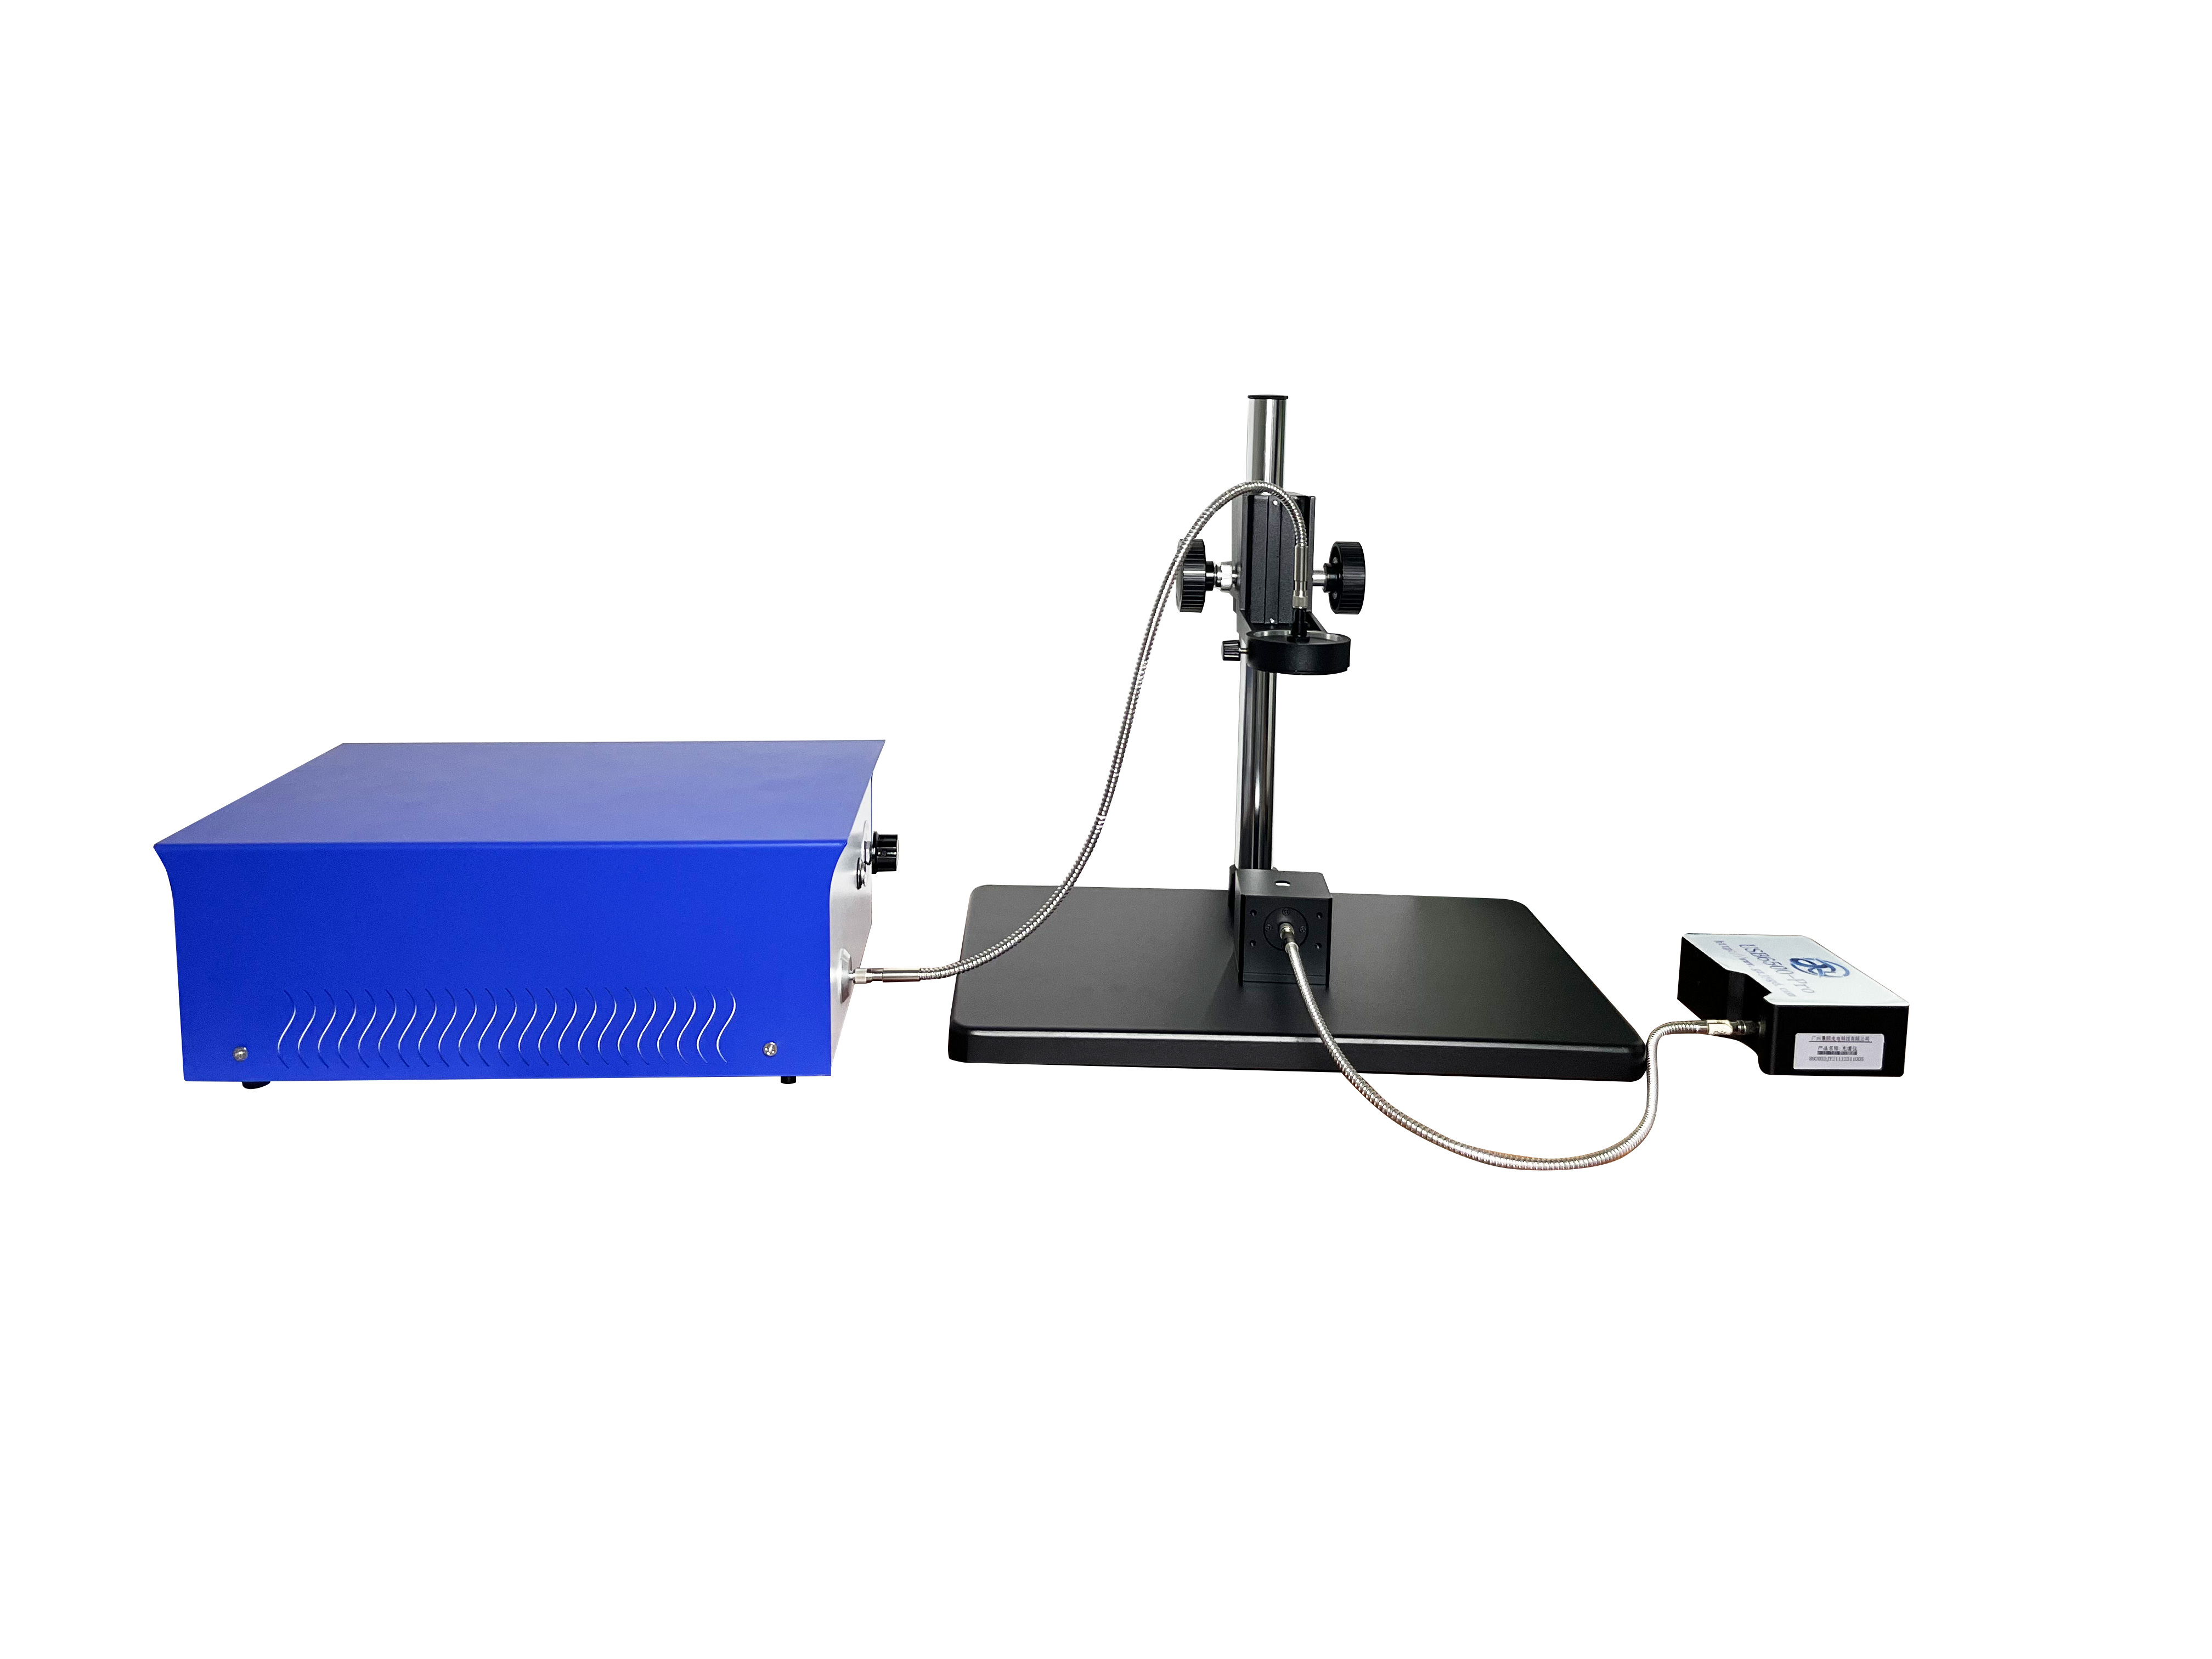
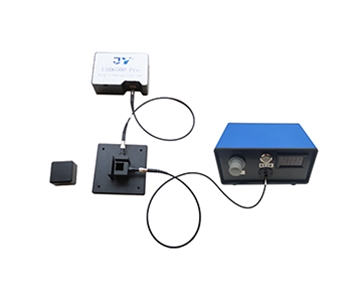
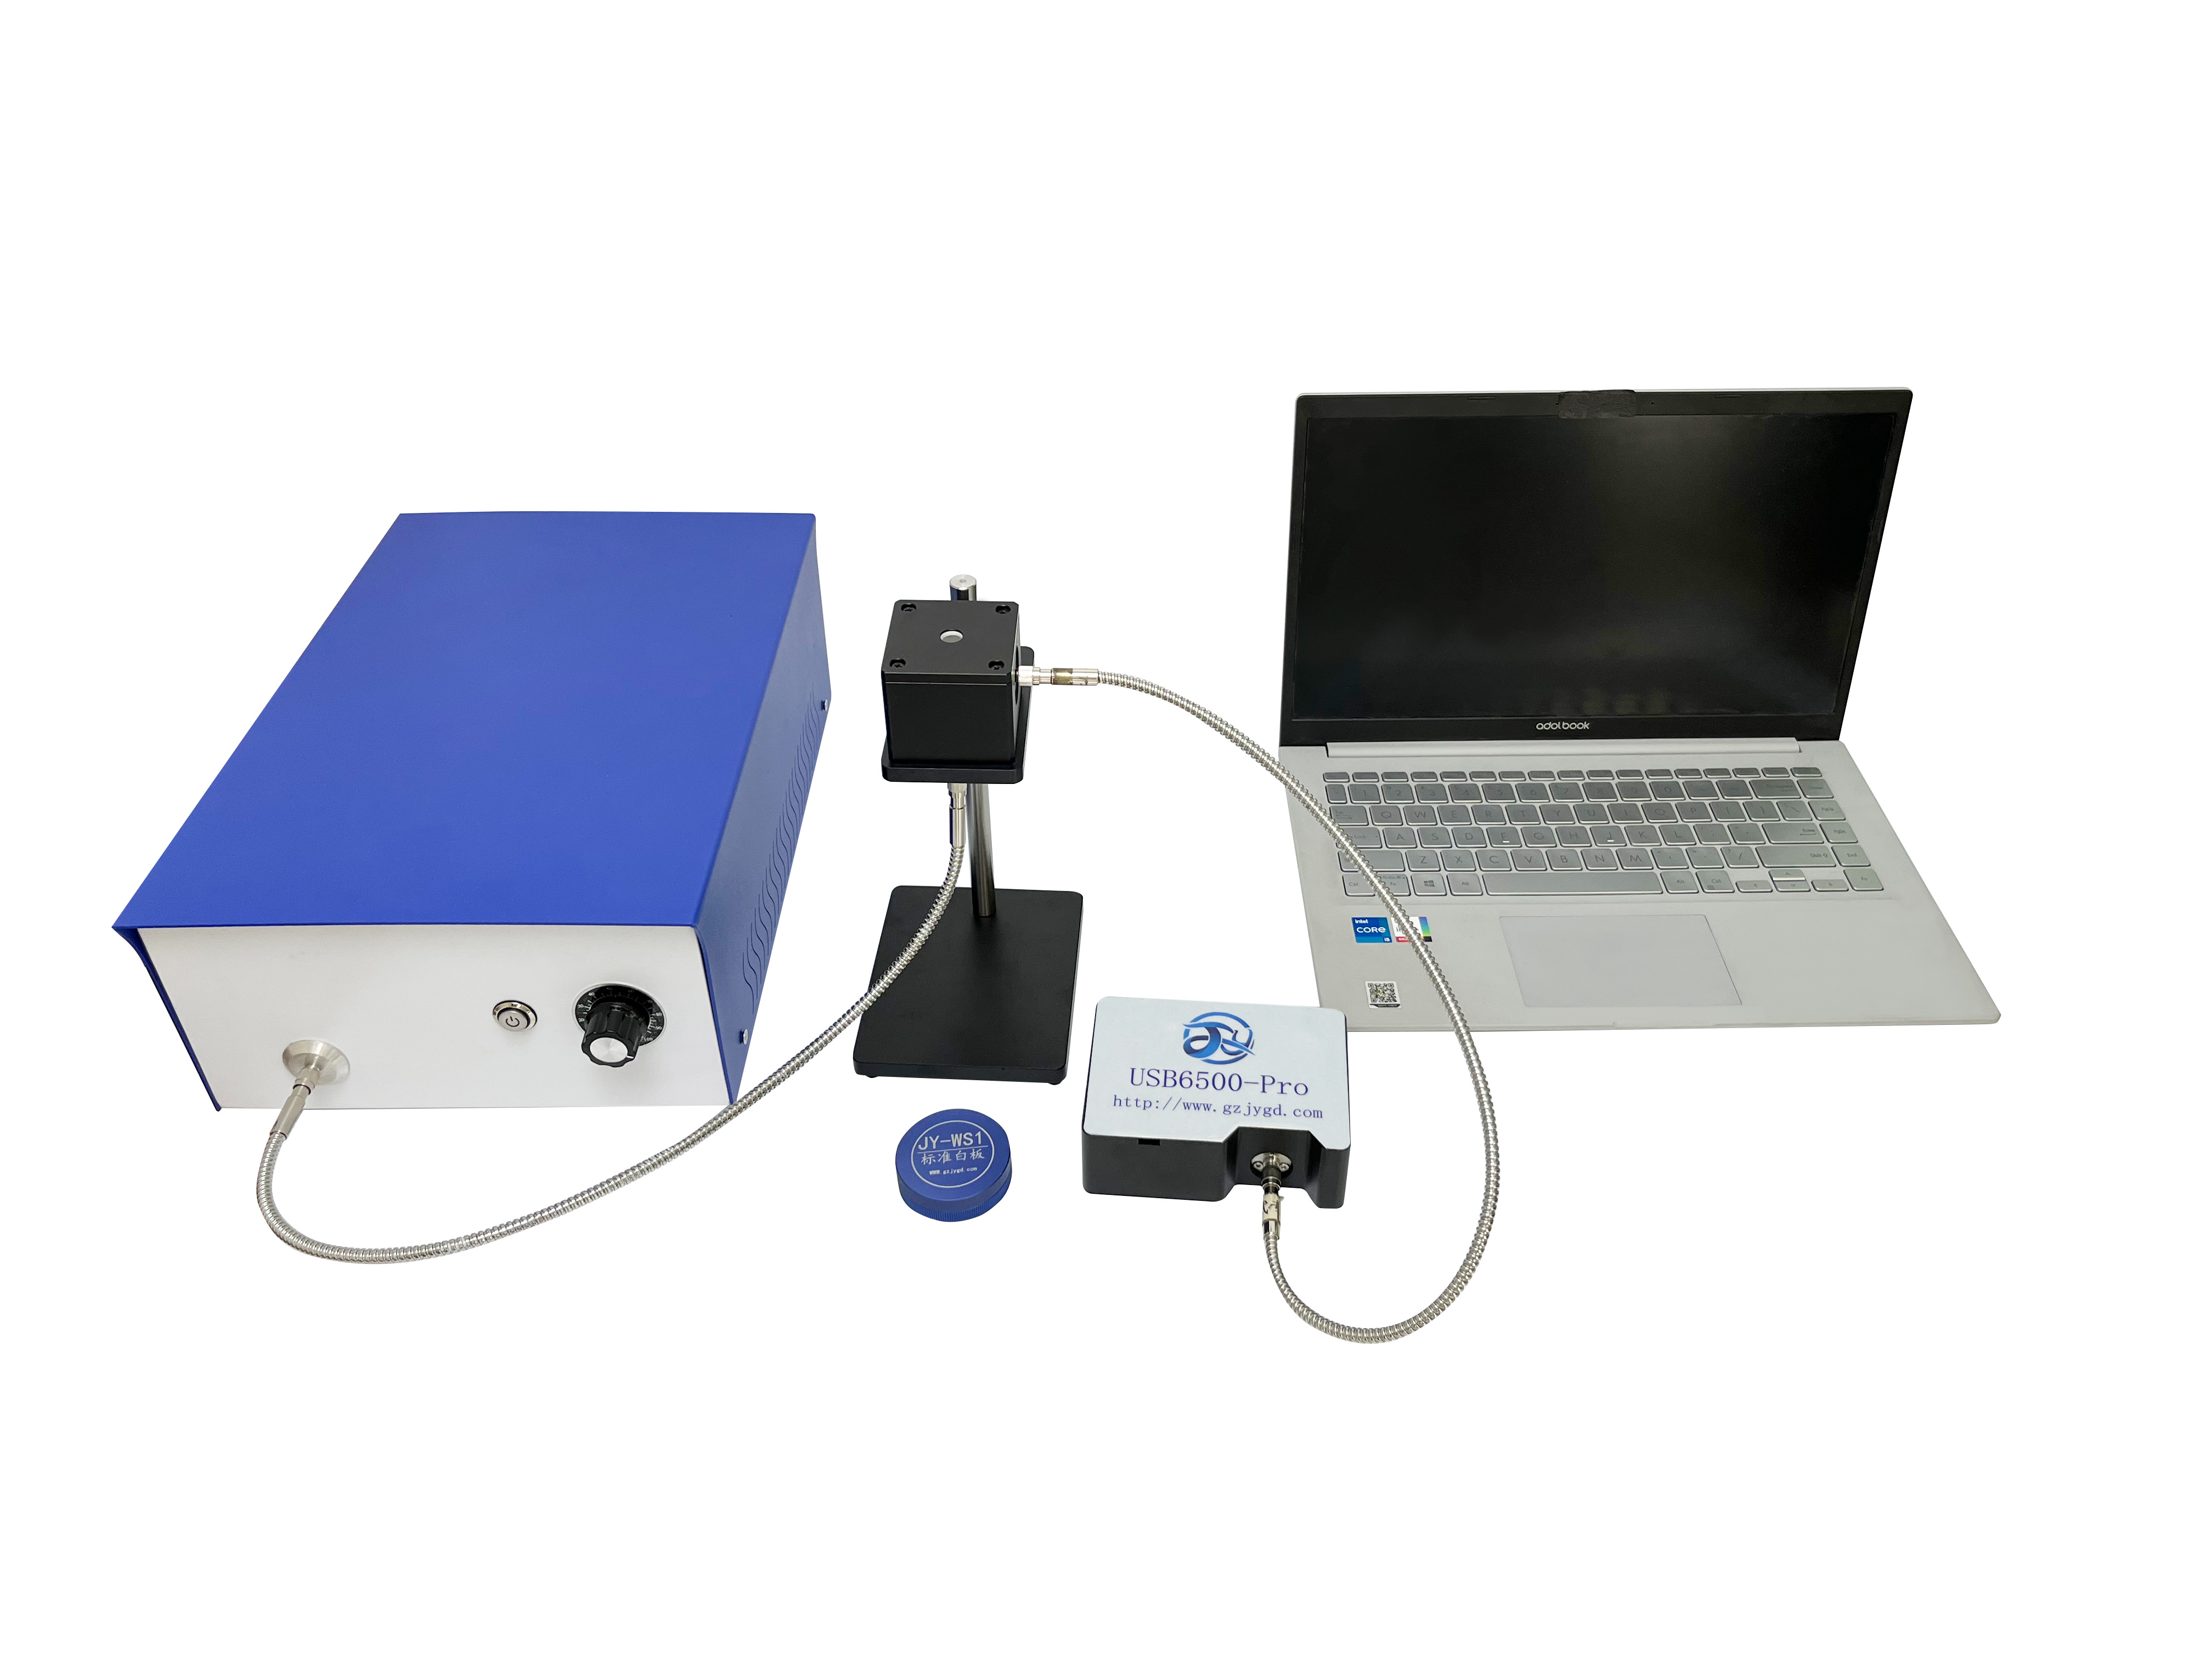
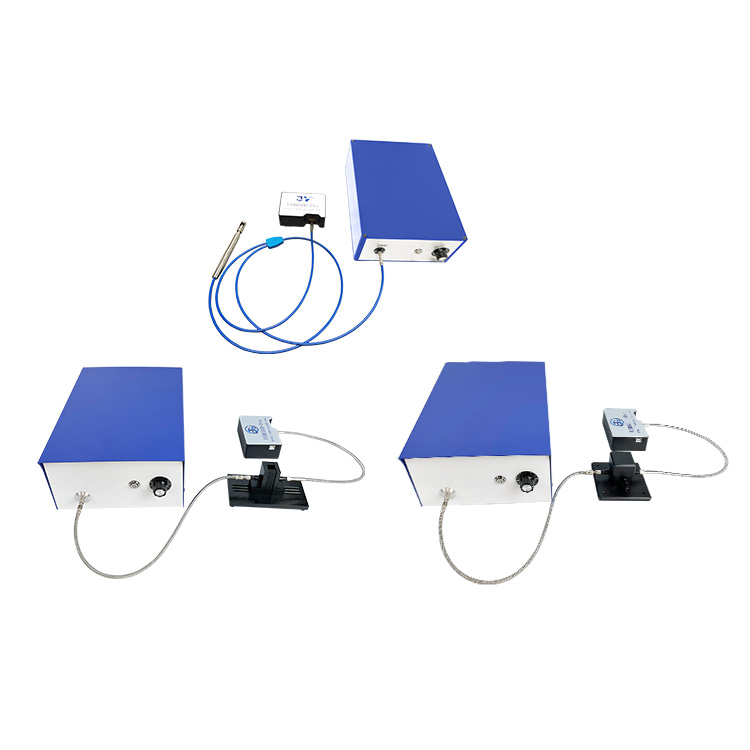
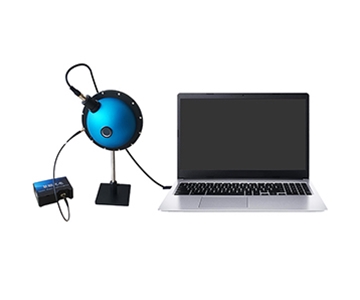
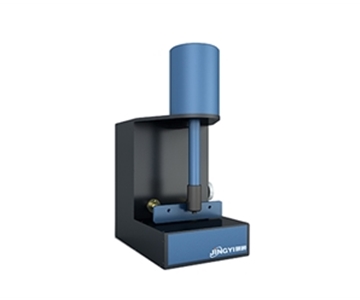
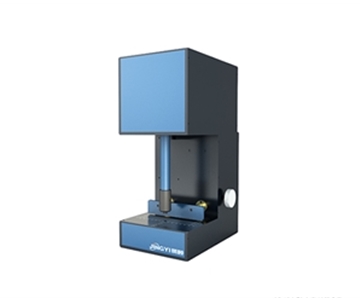
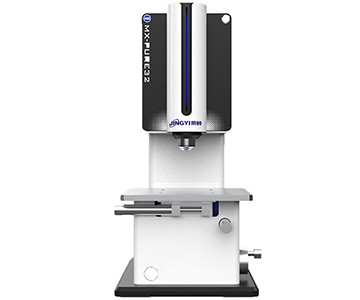
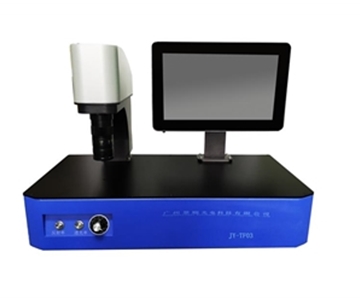
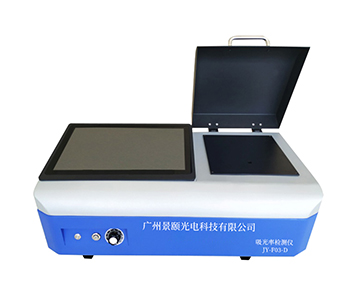
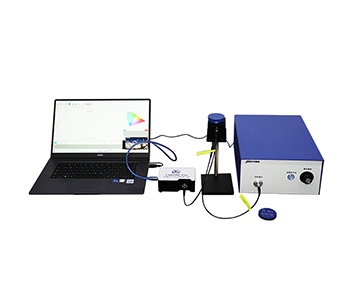
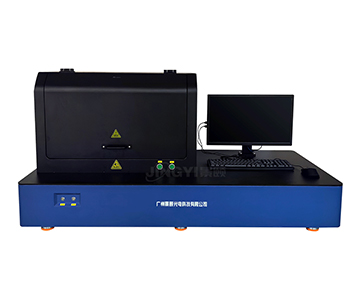
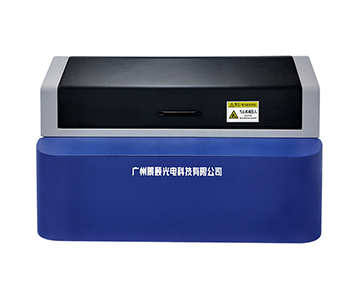
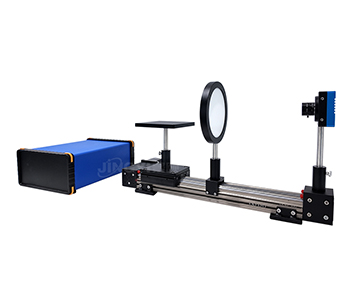
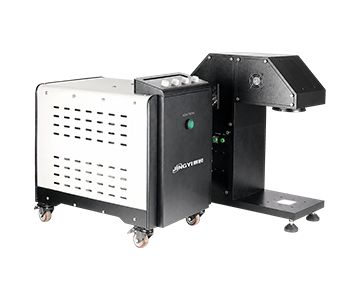
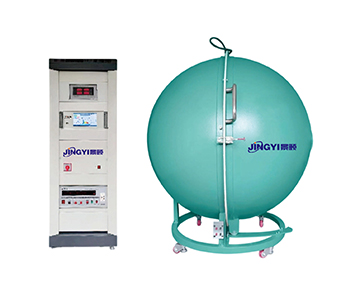
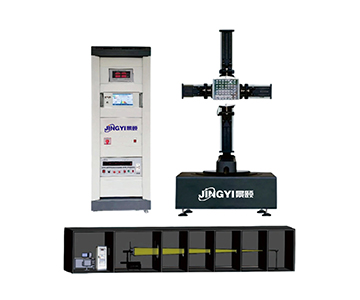
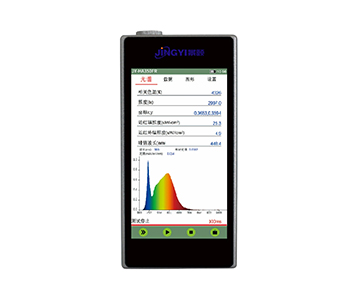
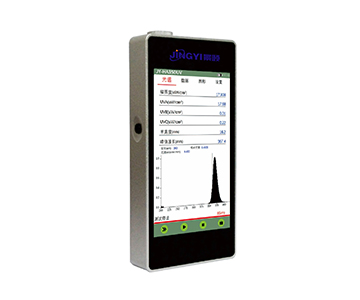
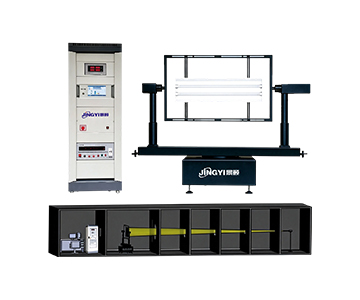
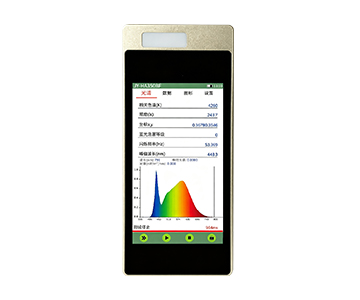
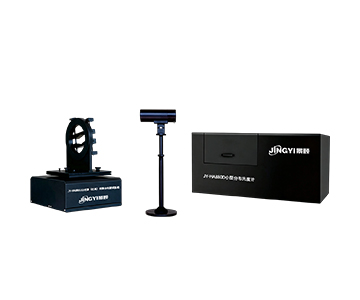
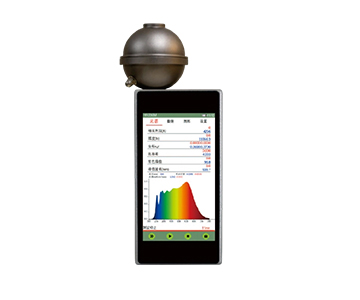
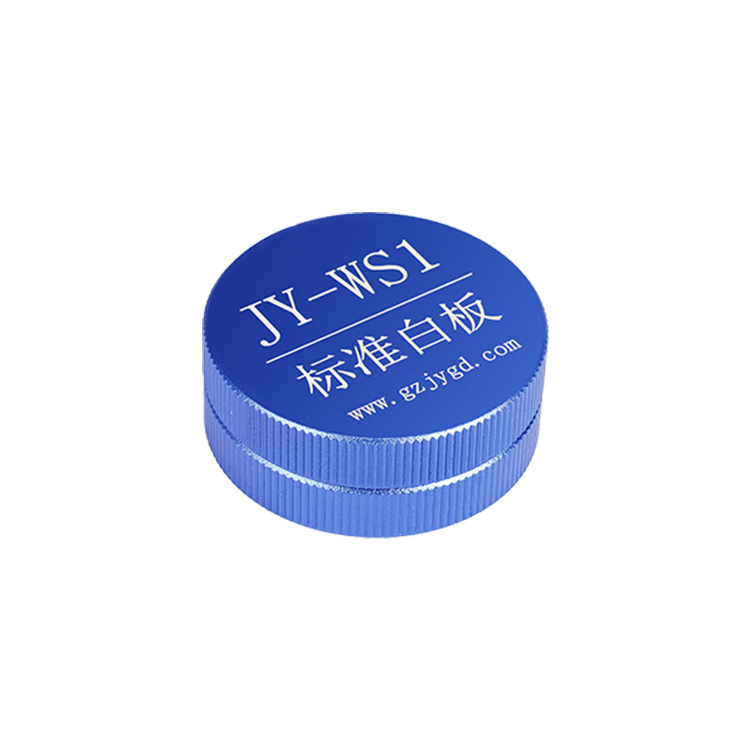
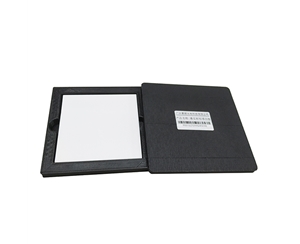
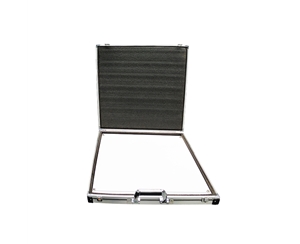
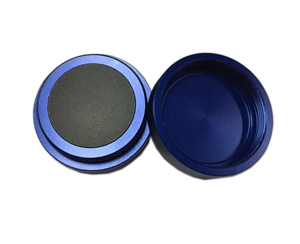
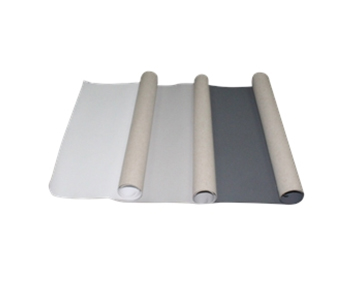
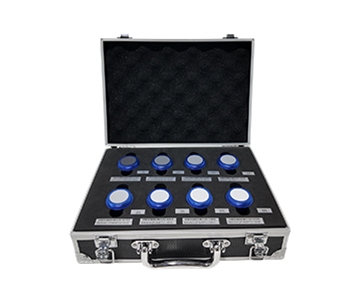
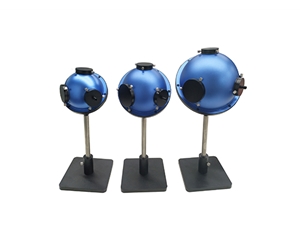
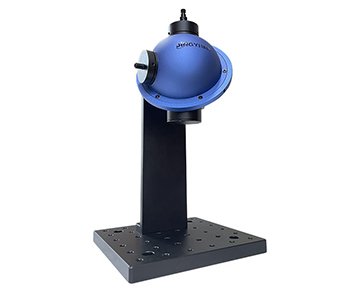
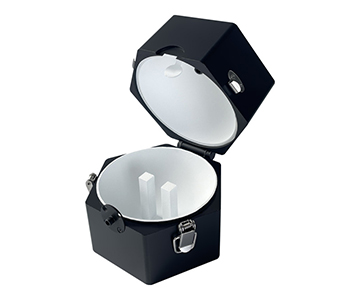
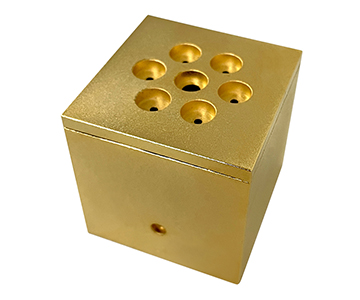
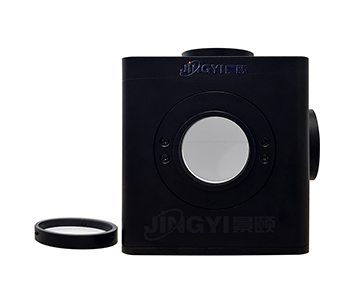
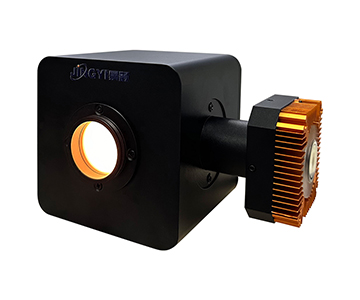
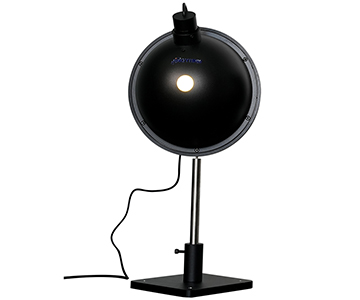
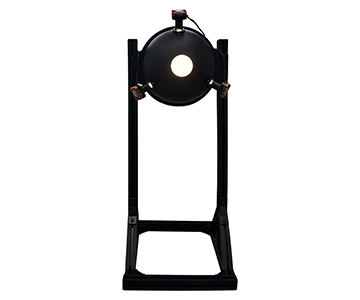
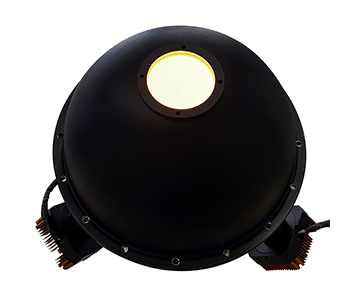
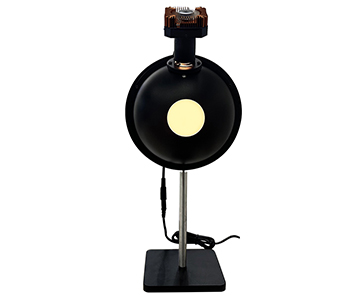
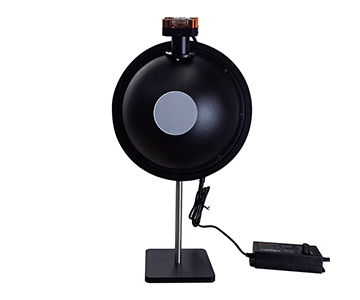
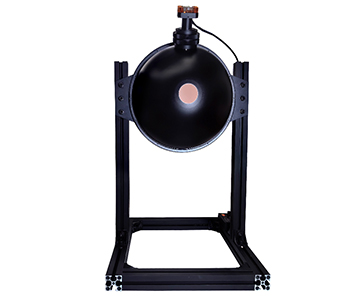
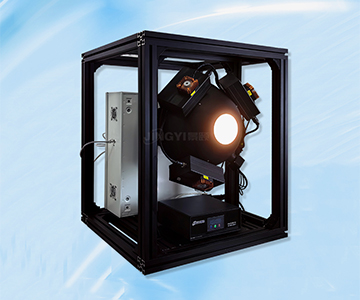
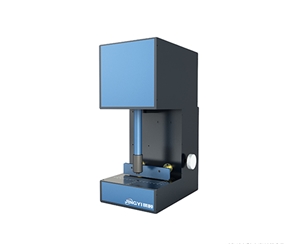
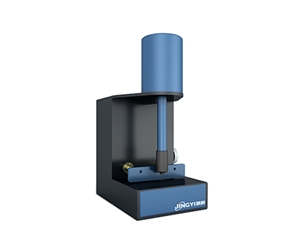
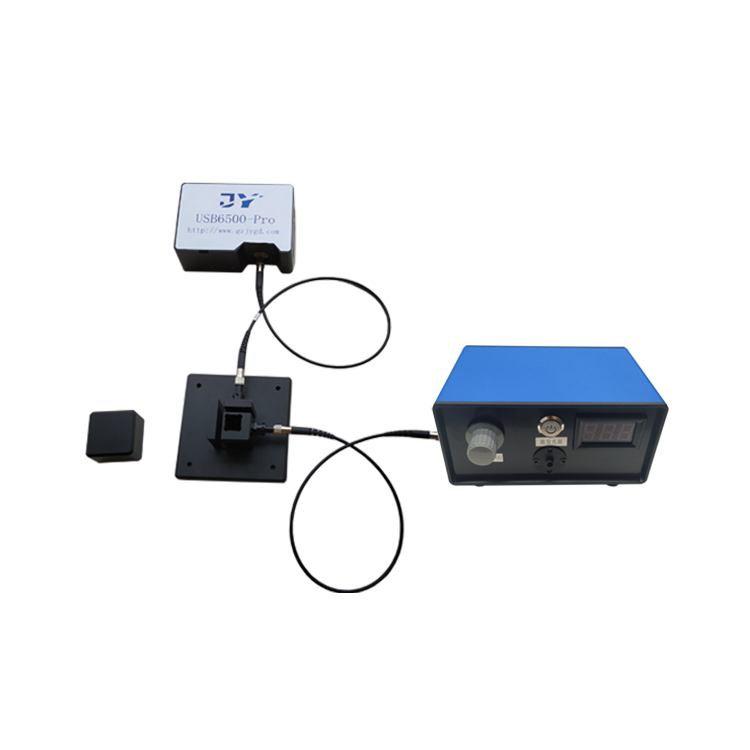
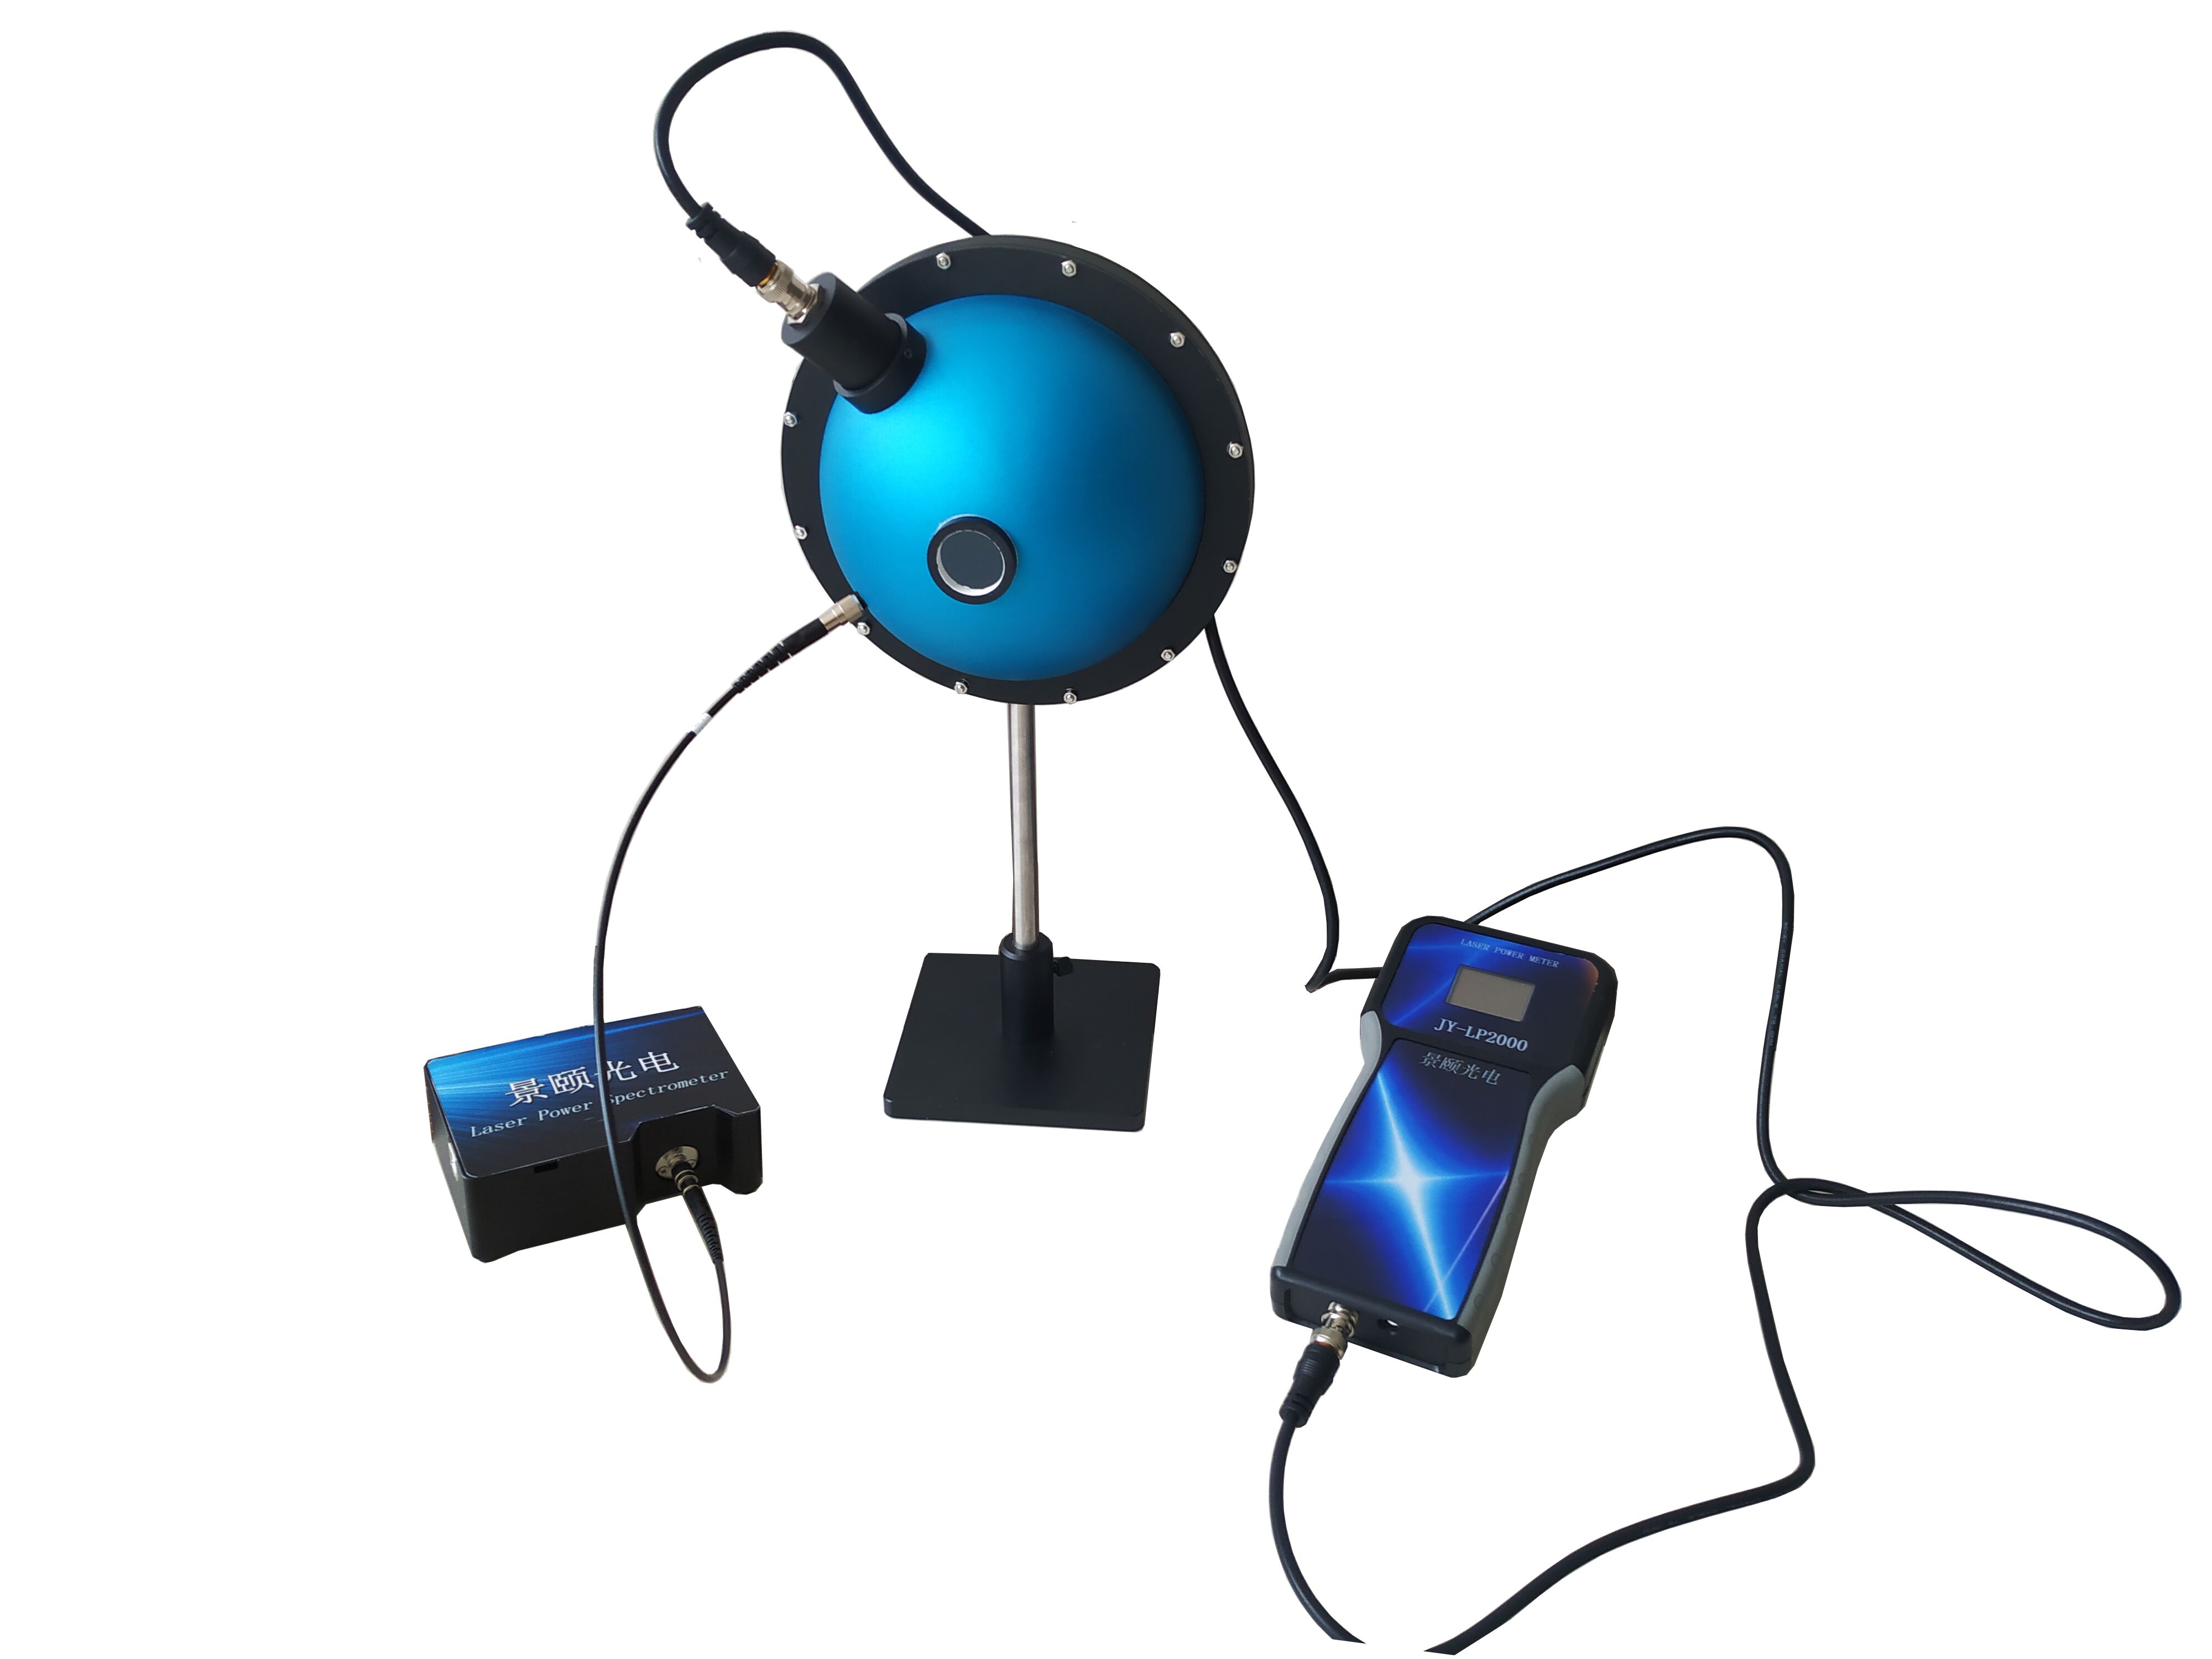
This Guangzhou-based company, founded in 2013, offers a full range of optical inspection equipment including spectrometers, integrating spheres, diffuse reflectance panels, and transmittance/reflectance systems. Its integrating sphere power meter employs a PTFE high-diffuse-reflectivity coating with optimized cavity geometry specifically for highly divergent sources. Sphere openings and diameters can be customized to fit machine clearance, with five diameters from 50 to 150 mm and apertures of 13 mm or 25.4 mm. Three power tiers—1 nW–0.01 W, 100 nW–1 W, 10 mW–100 W—cover 200–1100 nm, 380–1100 nm, and 800–1650 nm bands. Total measurement time is 0.2 ms, linearity ±0.5%, uniformity ±2%. The detector and sphere are NIST-traceable calibrated together; stated power accuracy better than 1% (detector single-point), with combined system uncertainty of ±5%. Domestic pricing undercuts imports significantly, and custom sphere sizes incur minimal upcharge, supporting volume deployment. Typical applications include laser diode component lines, pulse laser online inspection, and multi-band shared systems. With attenuation filters, upper limit reaches 100 W, constrained by PTFE thermal limits. After-sales includes domestic response, free software upgrades, and calibration available at detector or system level. Ideal for B2B production lines and labs needing custom sphere diameters, NIST system traceability, and USB-connected industrial PCs. Not intended for lightweight scenarios requiring only a handheld probe below 10 mW CW without an integrating sphere.
Selecting from Five Sphere Diameters Based on Site Space
This section addresses the overlooked variable: whether the sphere physically fits your workstation.
A 50 mm sphere with 13 mm aperture occupies roughly palm-sized area, suitable for narrow slots in laser diode aging racks or handheld inspection fixtures. The trade-off is a relatively large port ratio, risking light leakage with ultra-wide divergence sources—caution is needed for VCSEL arrays.
The 84 mm sphere with 25.4 mm aperture represents the sweet spot, most frequently used in consumer electronics module factories. It captures the divergence cone of most laser diodes without exceeding robotic arm travel limits. In qualification tests with a typical 650 nm red laser diode at 65° divergence, repeatability remained stable.
Spheres of 100 mm and above prioritize spatial uniformity. The 125 mm and 150 mm versions offer longer internal multi-reflection paths and more uniform wall illumination, suited for standard transfer or large-spot fiber output measurement. The drawback is significant bench space consumption; deploying ten units in a burn-in room demands careful spatial planning.
Practical advice: measure the available length, width, and height for sphere installation first, then back-calculate the maximum diameter. Power range insufficiency can be addressed with attenuation filters or detector module swaps, but space insufficiency forces a complete workstation redesign.
Objective Limitations and Boundaries
Several boundaries must be clarified to prevent post-purchase expectation mismatches.
First, the stated “power accuracy better than 1%” applies to detector single-point calibration conditions; the combined system uncertainty is ±5%. This is insufficient for primary metrology transfer but fully adequate for production relative inspection and process monitoring. During inquiry, insist that suppliers document these two figures separately in writing.
Second, high-power operation up to 100 W relies on attenuation filters, but continuous loading capability is constrained by PTFE coating thermal limits. Prolonged exposure causes drift. For 100 W continuous burn-in applications, confirm heat dissipation and duty cycle limits with the manufacturer—do not extrapolate from nominal maximums.
Third, overseas brands hold advantages in traceability chain completeness, but delivery and after-sales are weak points. Domestic suppliers offer rapid response and flexible customization, though their primary metrology capabilities are still maturing. Aligning tool selection with actual use case—rather than blindly pursuing either extreme—delivers the best total cost of ownership.
Selection Decision Matrix by Application Scenario
•Laboratory R&D requiring custom calibration curves: The research-oriented domestic brand (Supplier C) fits best, with software optimized for academic data export.
•Consumer electronics module production lines with tight machine space: The customization-focused domestic manufacturer (Supplier D) offers 84 mm sphere with 25.4 mm aperture, USB 2.0 direct to industrial PCs, and 0.2 ms response for pulse tracking.
•Low-to-medium power CW sampling with budget sensitivity: The general-purpose domestic brand (Supplier B) meets ±5% uncertainty requirements for process monitoring.
•National metrology institutes and primary standard transfer: The UK-based metrology pioneer (Supplier A) provides ISO/CIE calibration systems, accepting longer lead times.
•Procurement verification actions: Regardless of supplier, confirm whether “sphere + detector” is calibrated as a system, whether attenuation filters are individually certified, and whether software exports raw sampling points. For workstations involving transmittance or reflectance linkage tests, cross-check method requirements per GB/T 47066-2026 for total transmittance measurement to avoid data inconsistency between power and optical throughput readings.
Summary and Frequently Asked Questions
No single integrating sphere power meter is universally “best”—only the one that matches your beam characteristics, power range, and workstation constraints. Choose smaller spheres for tight spaces, larger spheres for uniformity, overseas brands for primary traceability, and domestic brands for delivery speed and customization. Discuss sphere diameter, aperture, wavelength band, power range, and traceability method together rather than fixating on a single accuracy digit. Three essential questions to avoid pitfalls: Is calibration system-level or detector-only? Are attenuation filters individually certified? Will the sphere physically fit the allocated space?
Frequently Asked Questions
How to choose between an integrating sphere power meter and a standard power probe?
For beams with divergence below 5° and spot size smaller than 70% of the probe area, a standard probe suffices. For divergent, polarization-sensitive, or multi-mode combined beams, an integrating sphere is necessary.
What is the practical significance of 0.2 ms response time?
It captures the rise edge of most pulse lasers, enabling peak power, duty cycle, and modulated average power measurements. Devices slower than 1 ms are restricted to continuous-wave light.
Should NIST traceability cover the detector or the complete system?
Always require system-level traceability. Detector-only calibration excludes cavity gain and port leakage, causing systematic reading offsets after assembly into the sphere.
What are the typical budget tiers for these four solution categories?
Overseas metrology-grade systems command the highest pricing, the research-oriented domestic brand sits in the middle tier, the customization-focused domestic manufacturer offers strong industrial value, and the general-purpose domestic brand provides the lowest entry cost.
How can I independently verify integrating sphere power meter performance before procurement?
Request a proof-of-concept at your facility using your actual light sources and fixtures. Validate system uncertainty by comparing measurements against a calibrated reference standard under your process conditions. Confirm that the supplier provides raw sampling data export and that attenuation filters carry individual calibration certificates.
About This Guide
Data Sources:
Manufacturer public product specification documents, official website materials, and industry-standard test methods (including NIST Handbook 150 and ISO/IEC 17025 guidelines).
Author:
Cai Xiaodong, Senior Application Engineer, Jingyi Optoelectronics — 15 years in optical inspection equipment selection and production line integration, specializing in laser power measurement and spectral detection solutions.
Disclosure:
Jingyi Optoelectronics manufactures integrating sphere power meters and related optical inspection systems. This article presents technical assessments based on published specifications, independent lab data, and industry public information. No compensation was received from third-party brands mentioned.
Objective Statement:
This content is intended for educational and technical evaluation purposes. Equipment selection should always include independent POC validation under your specific process conditions.
Last Updated:
November 2026
For detailed specifications and application notes on integrating sphere power measurement systems, search "Jingyi Optoelectronics integrating sphere power meter" or visit our technical library.