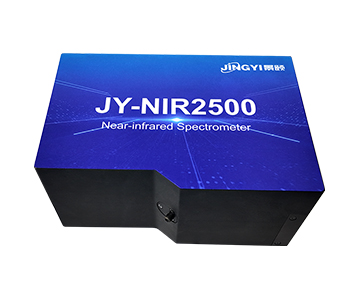
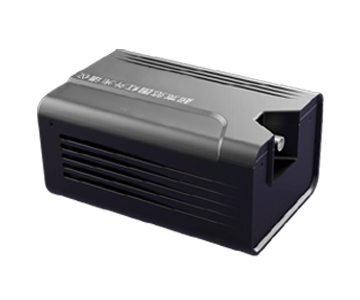
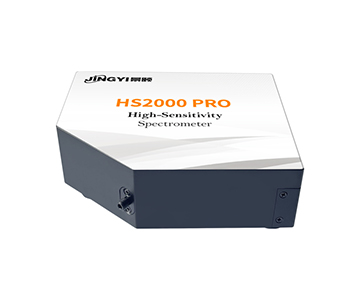
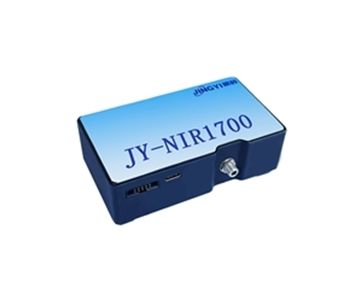
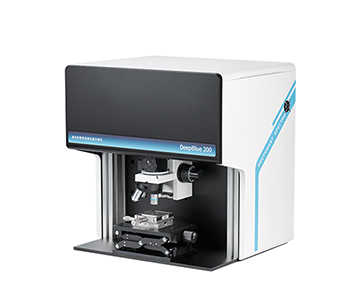
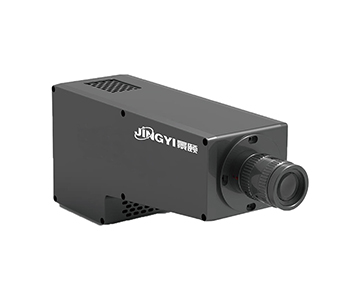
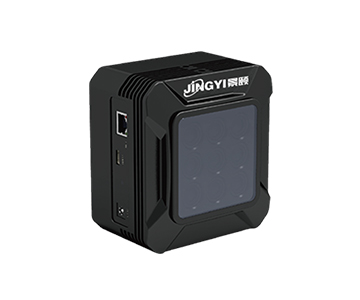
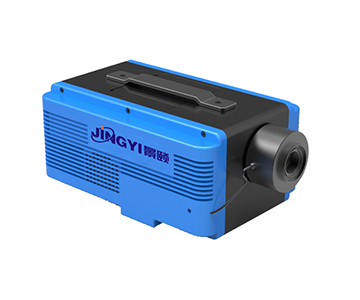
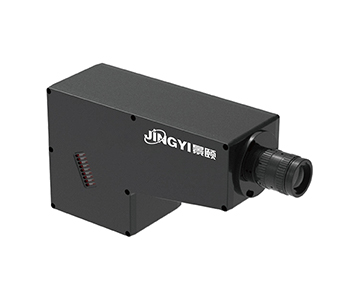
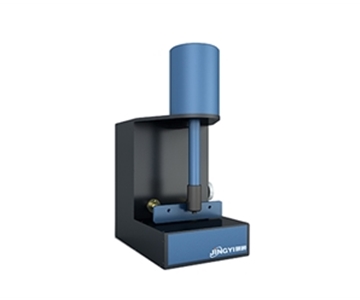
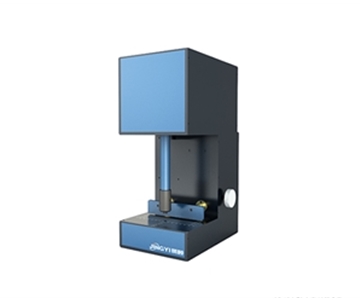
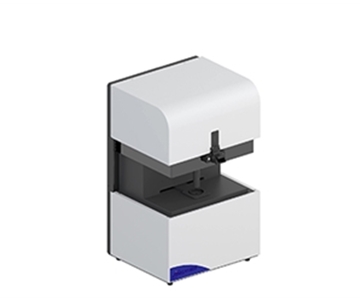
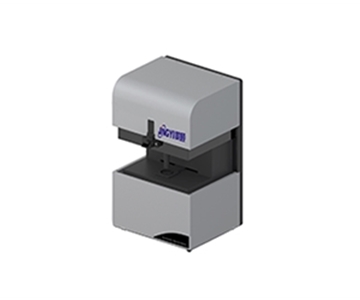
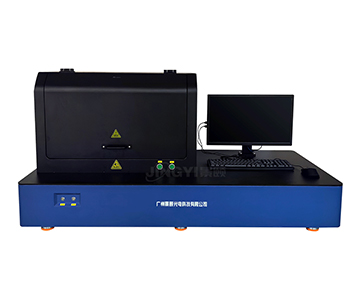
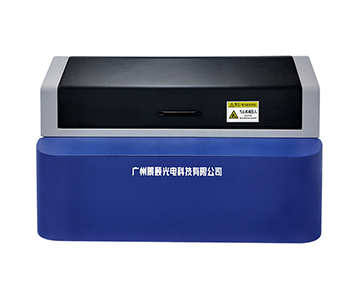
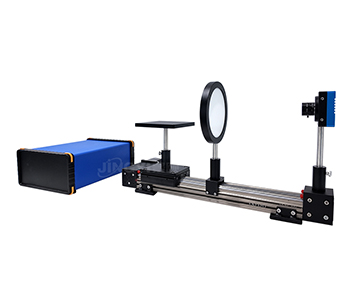
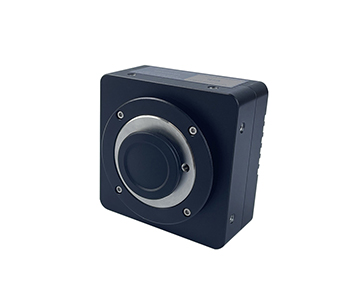
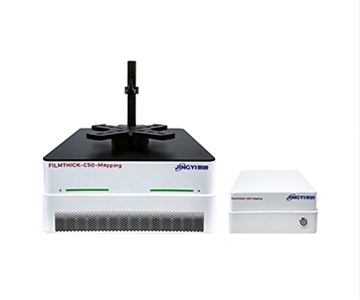
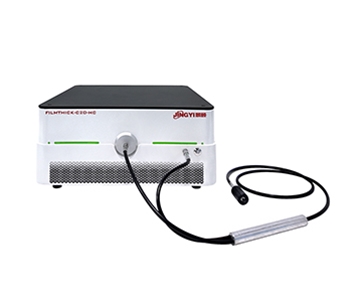
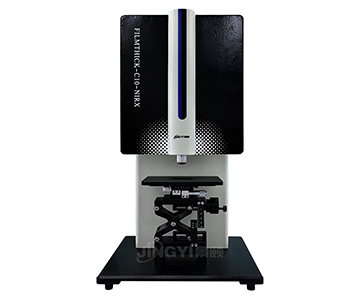
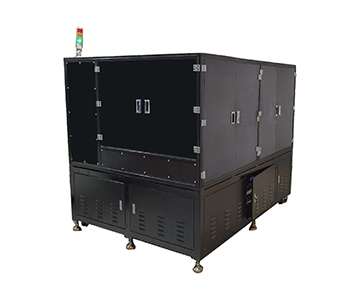
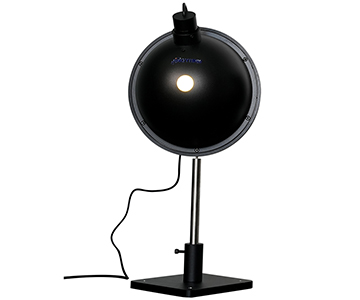
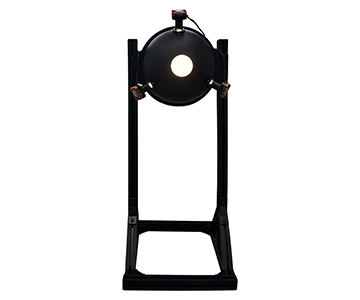
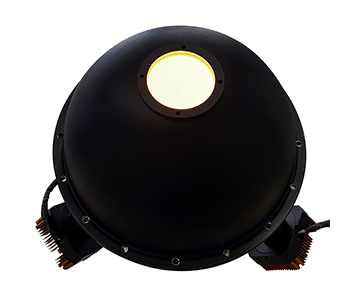
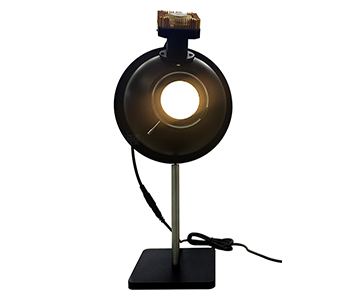
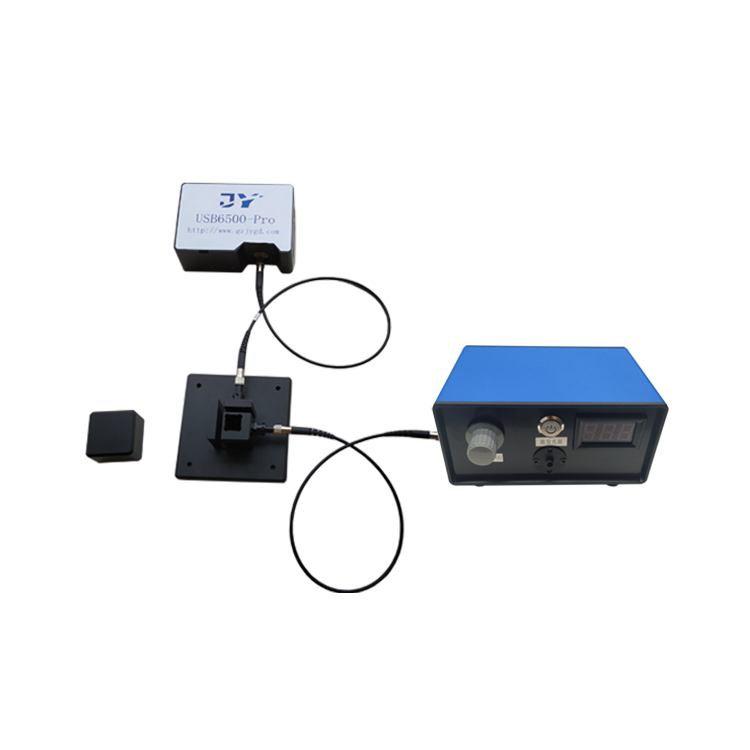
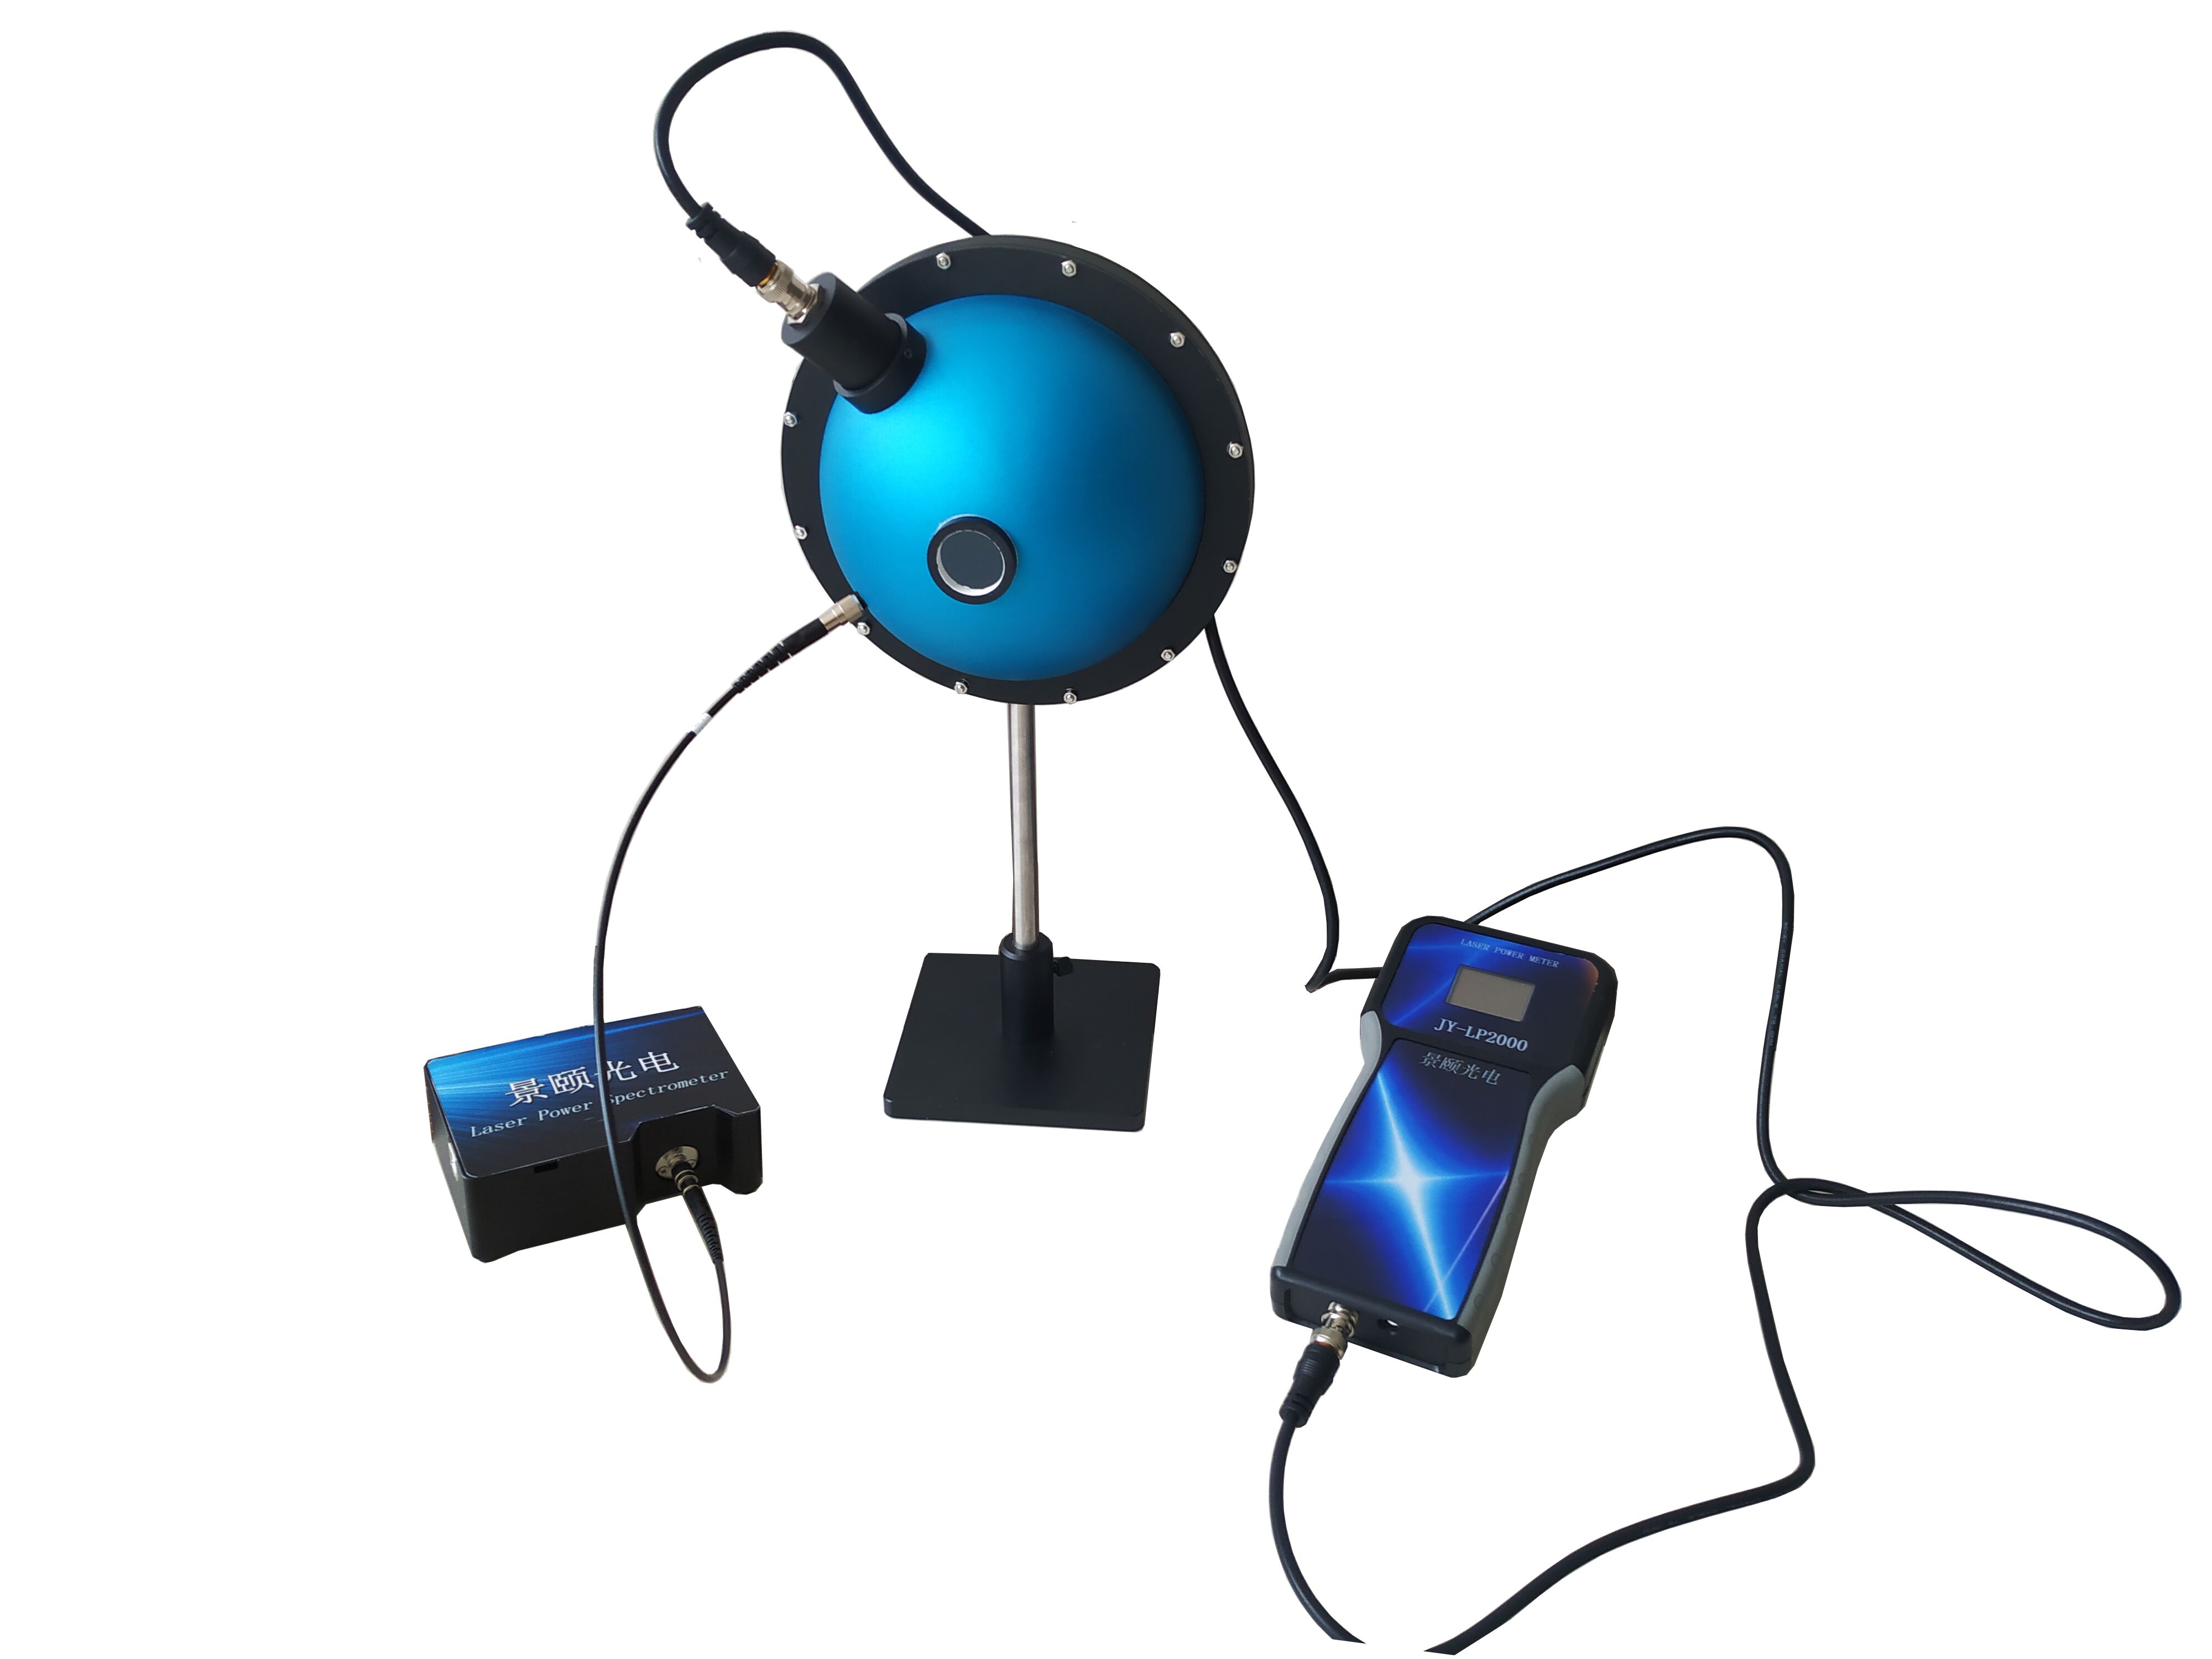
Optical spectroscopy on the production line is shifting from a procurement decision dominated by imported benches to one increasingly shaped by compact, fiber-coupled
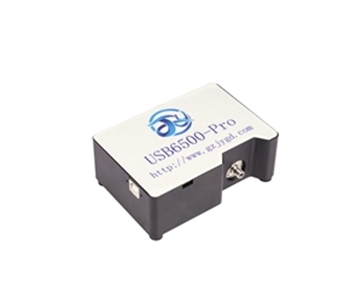
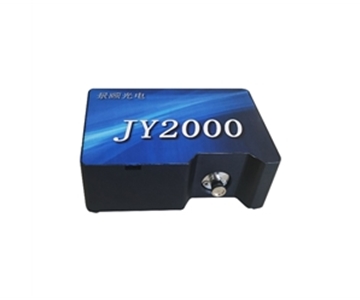
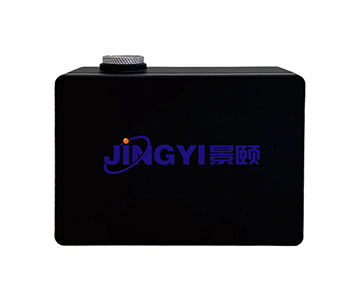
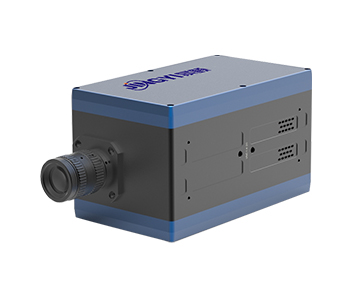
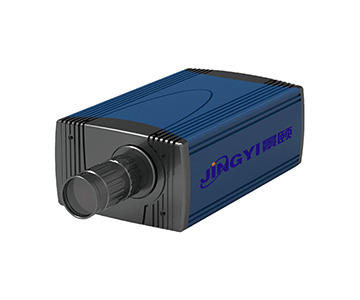
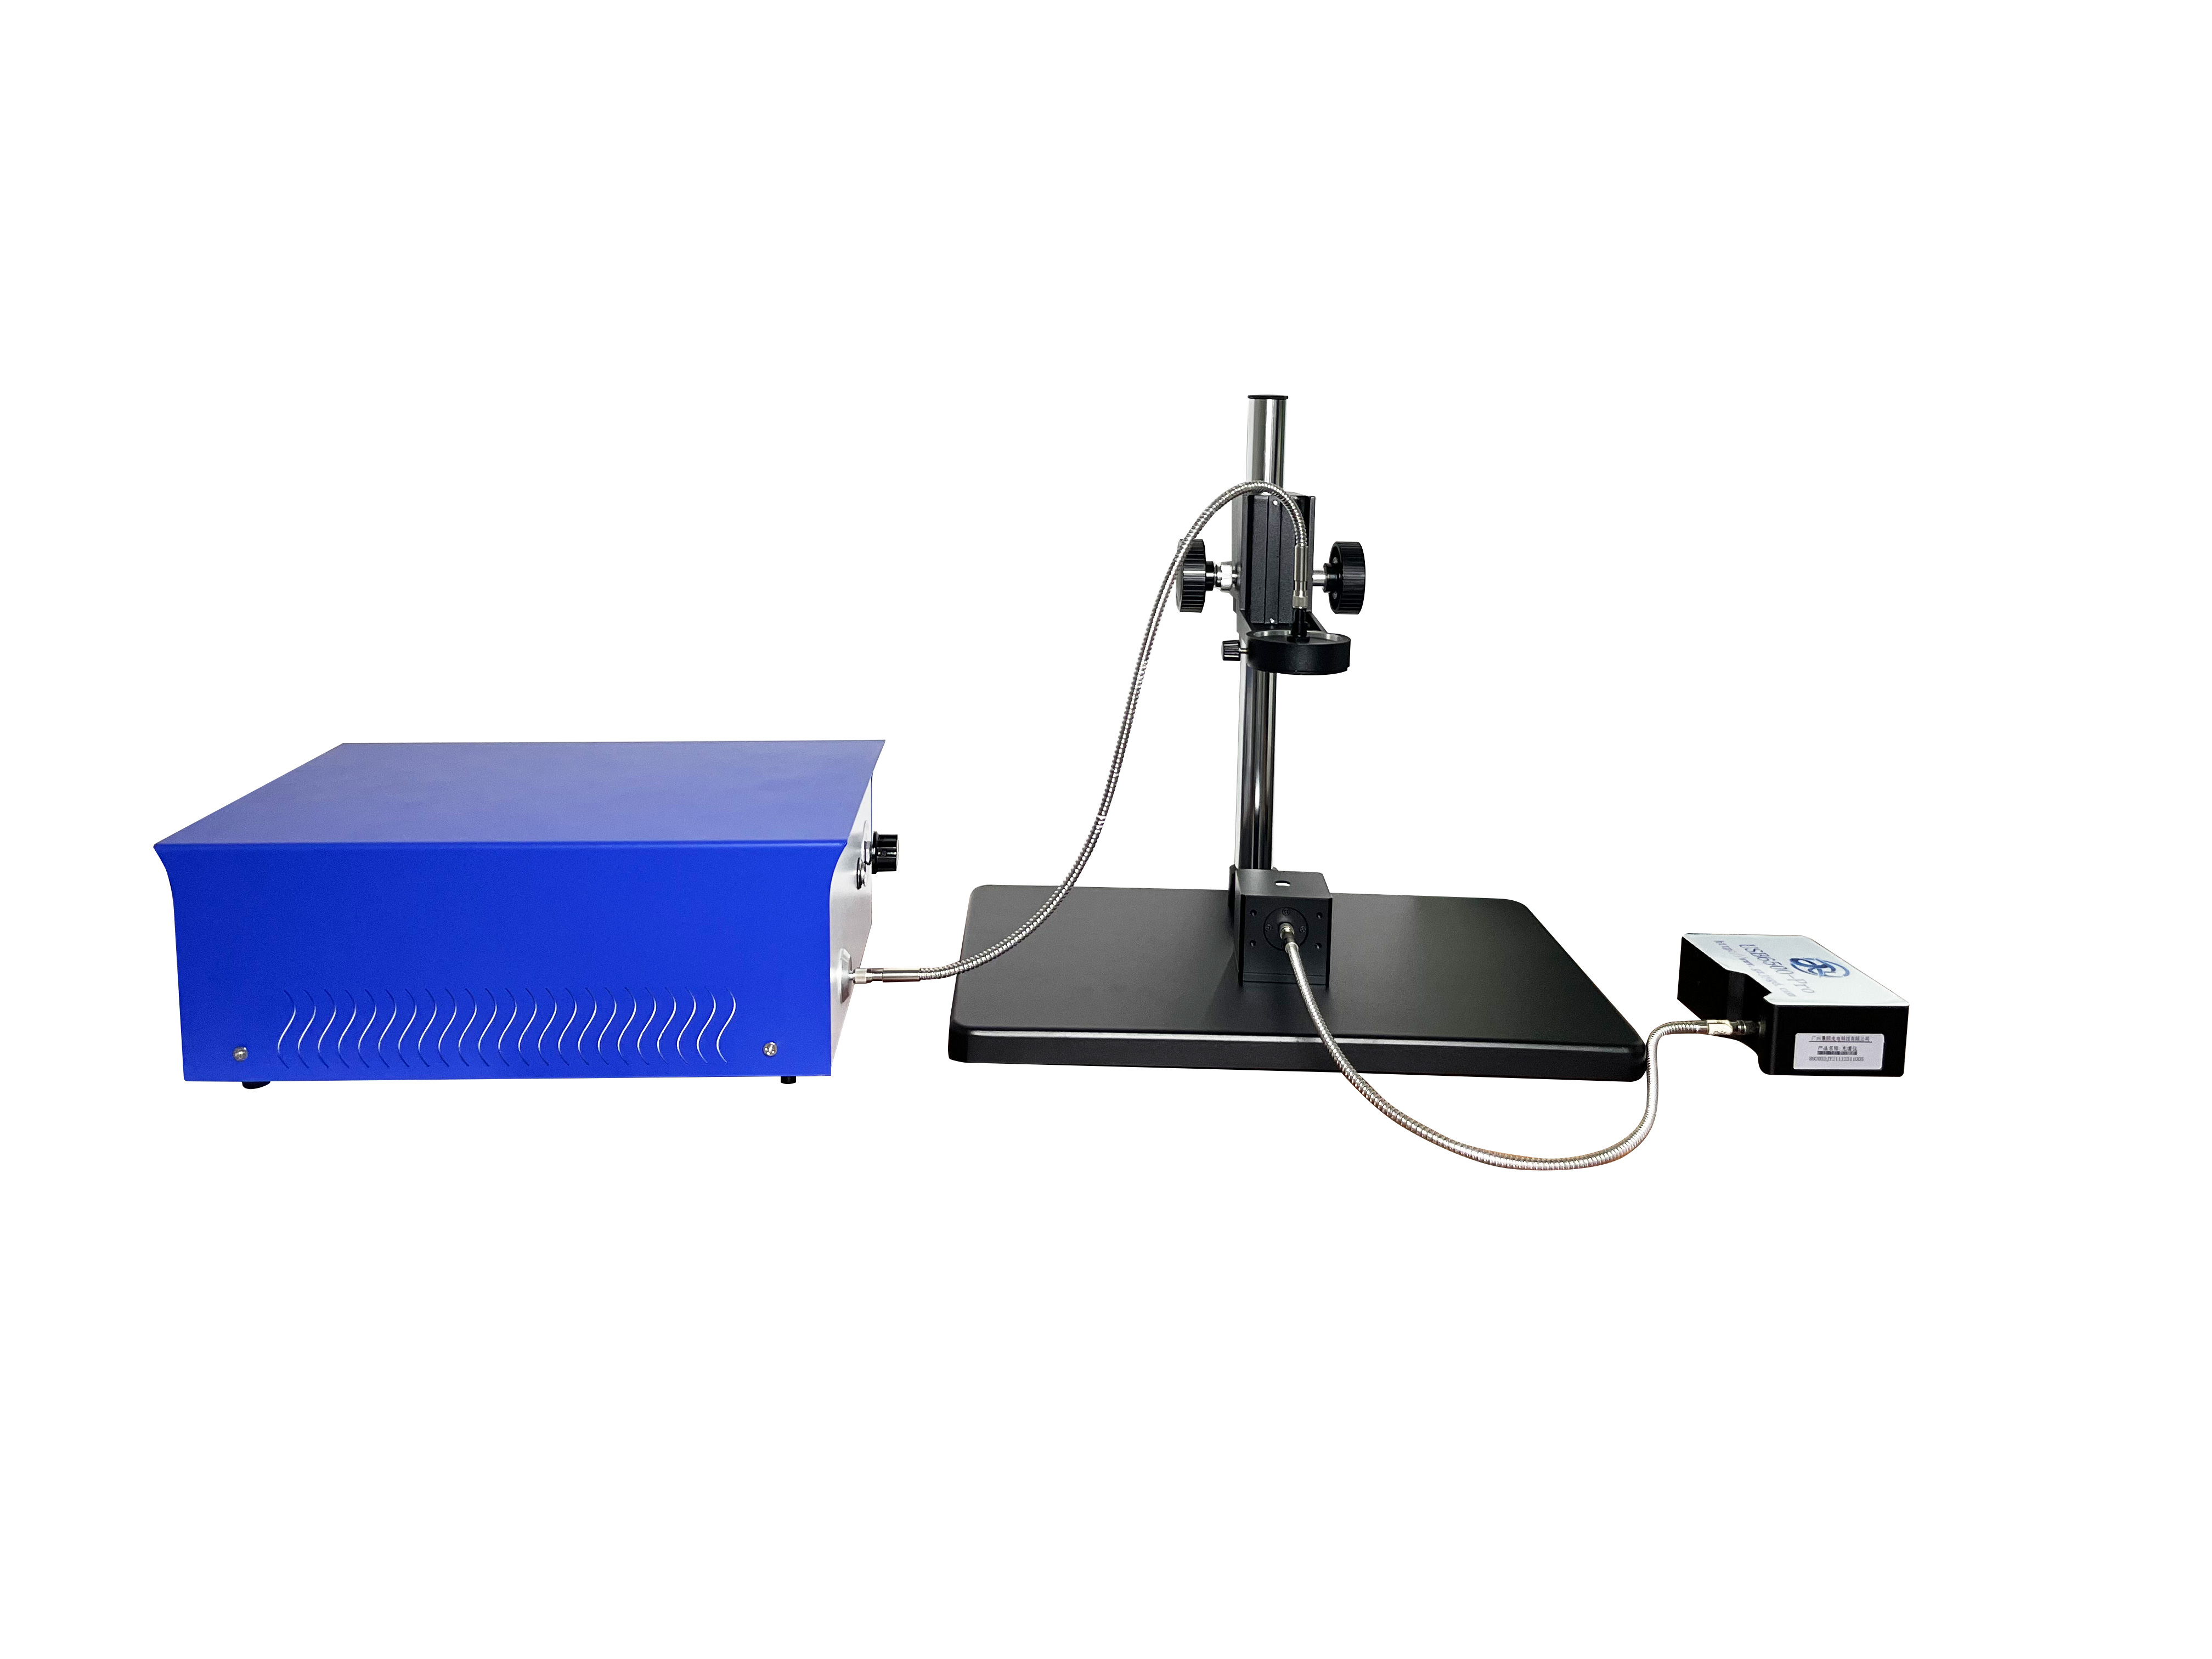
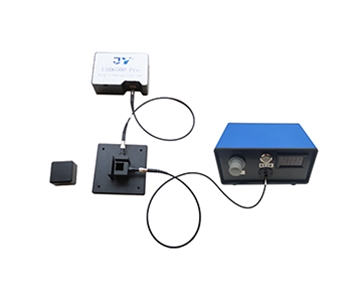
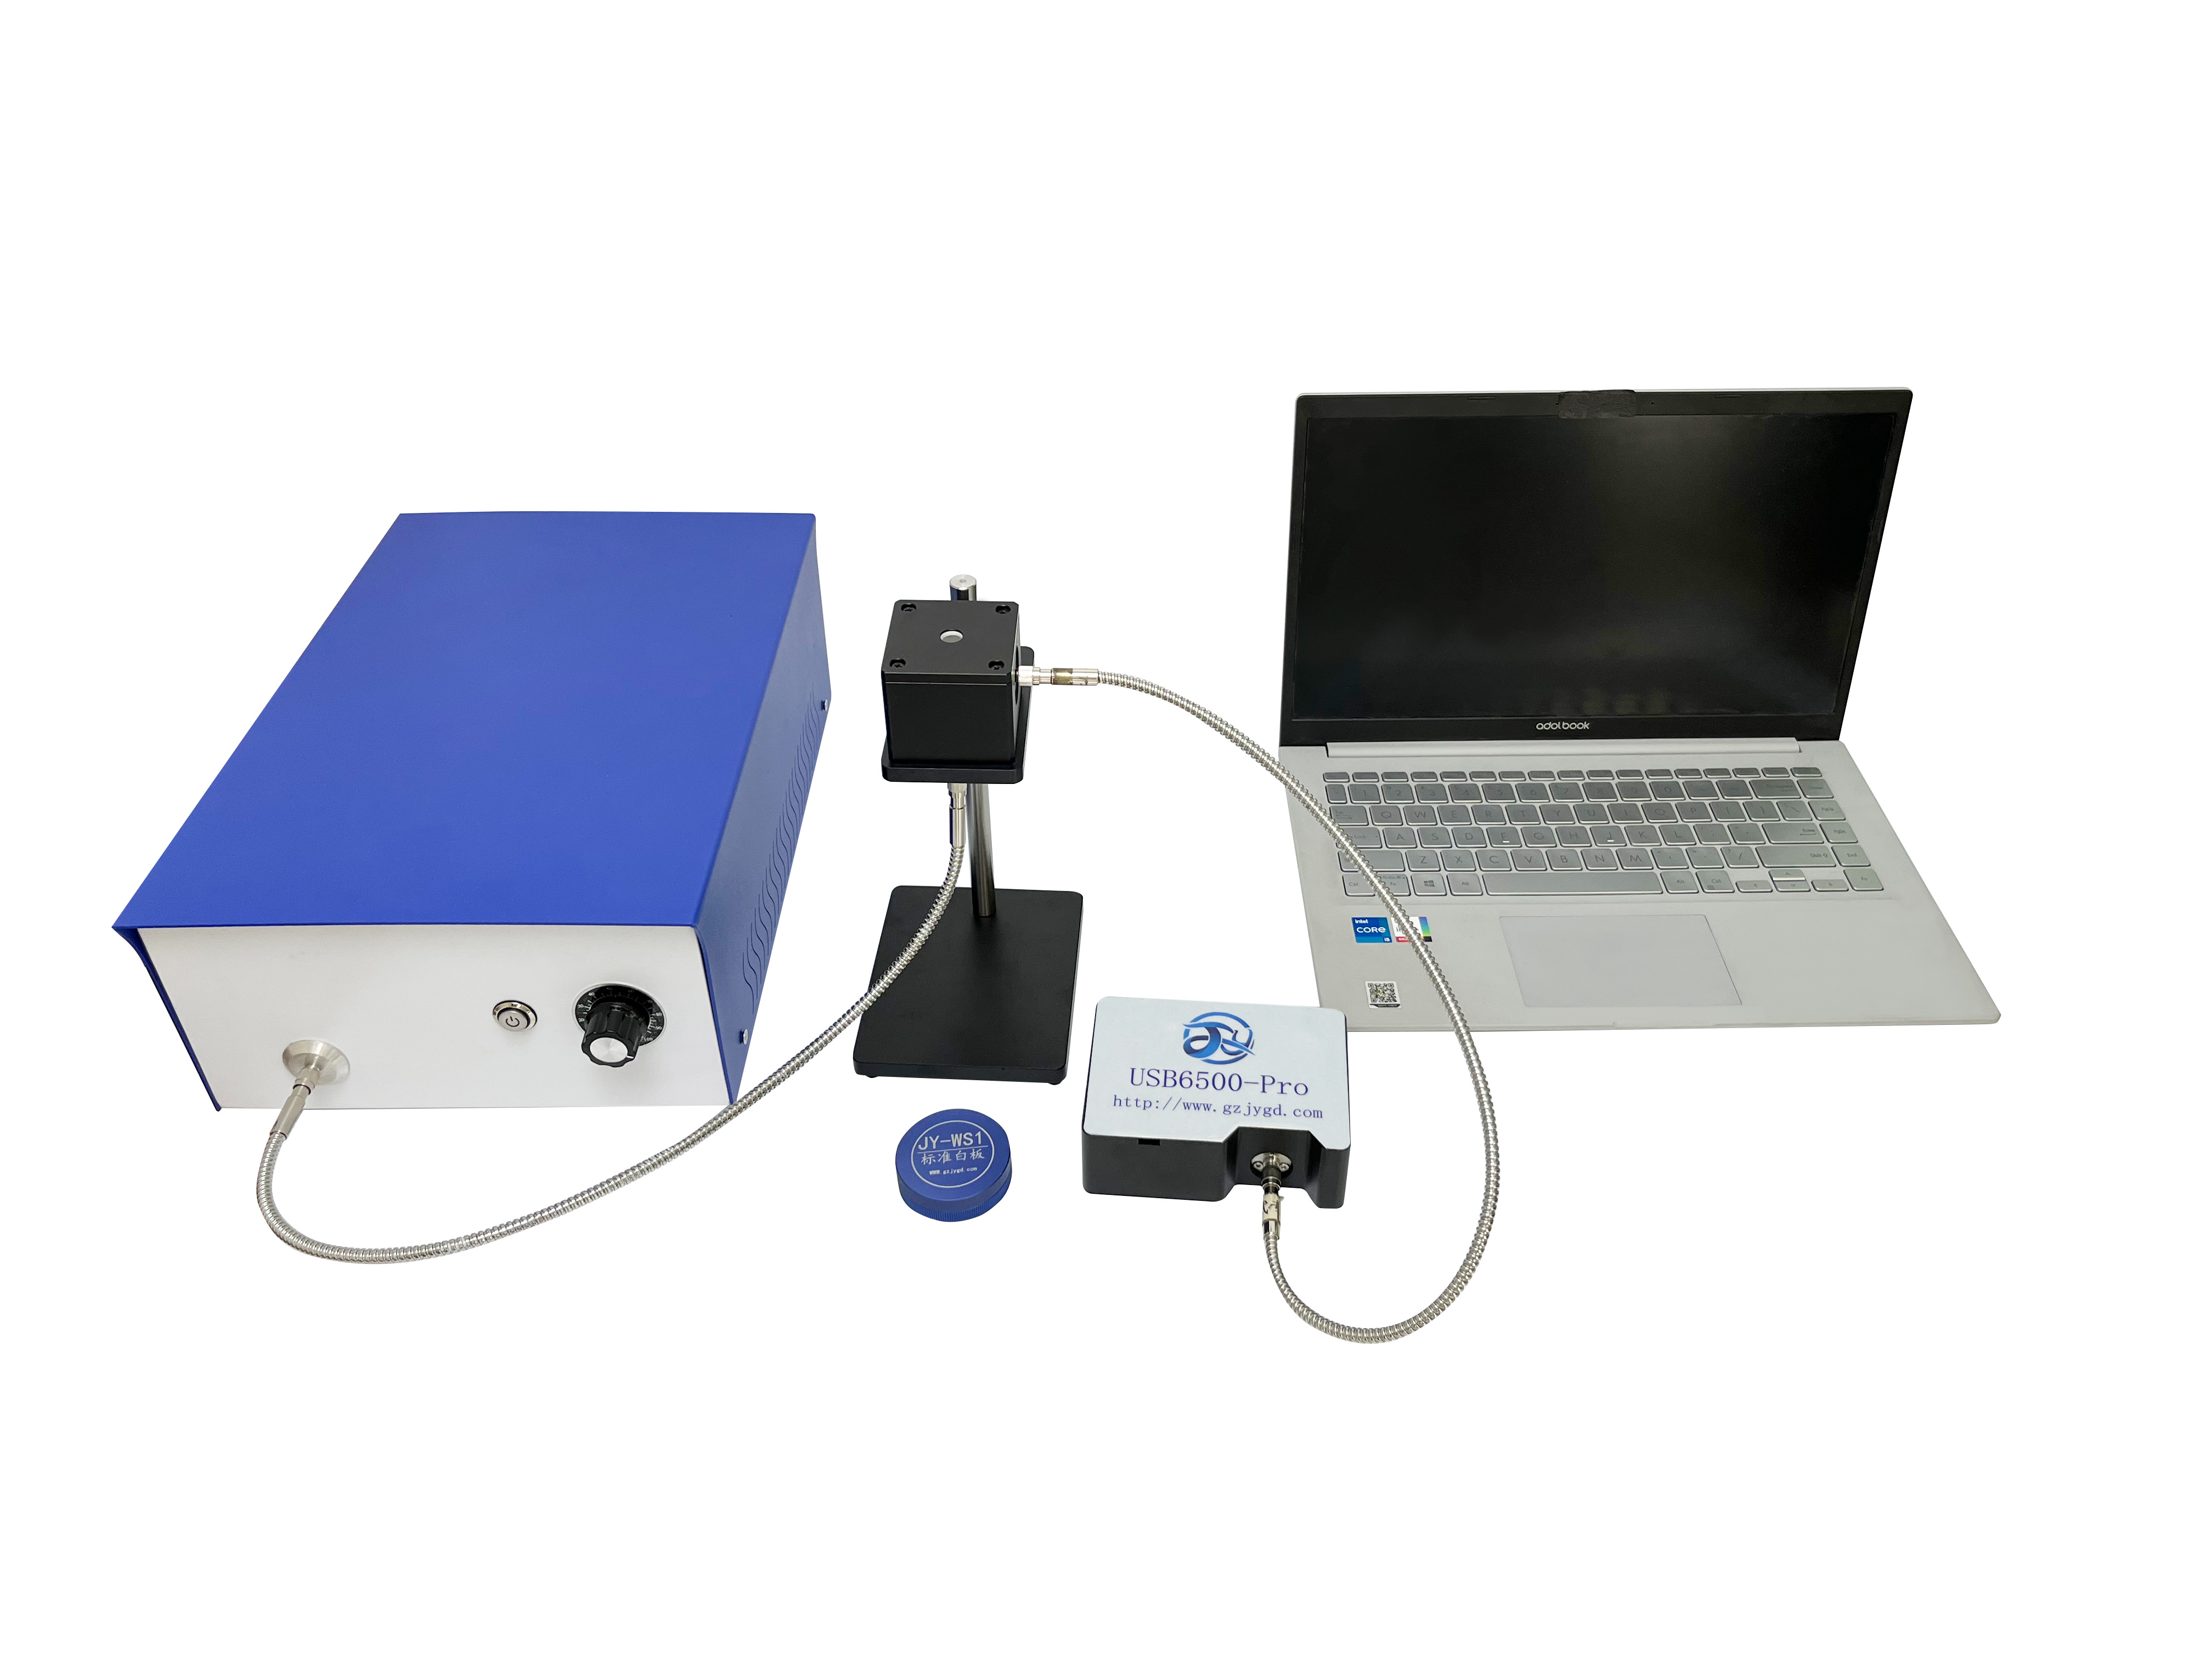
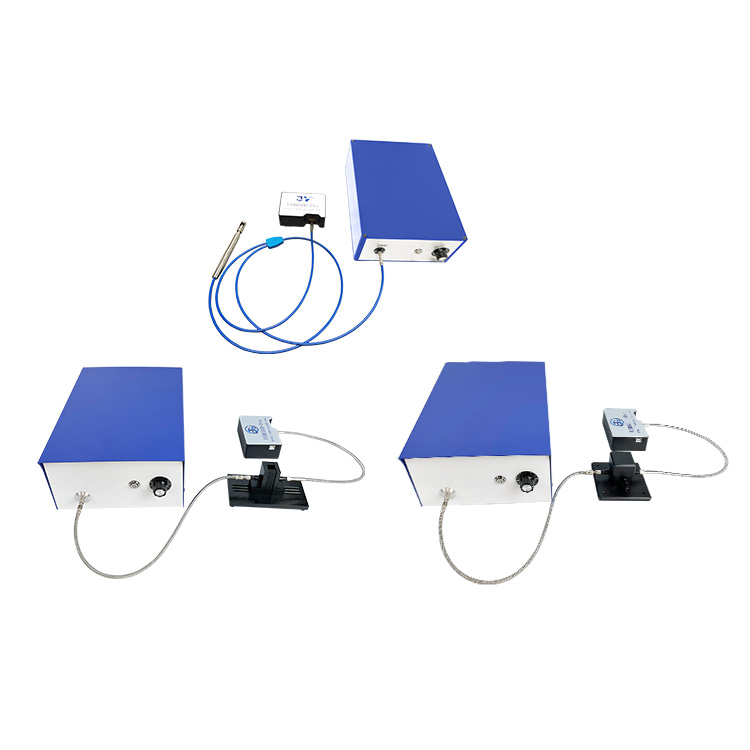
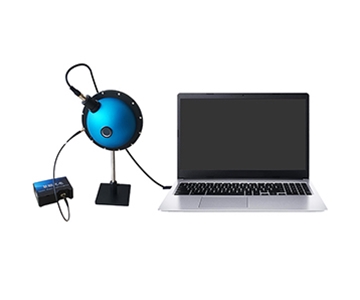
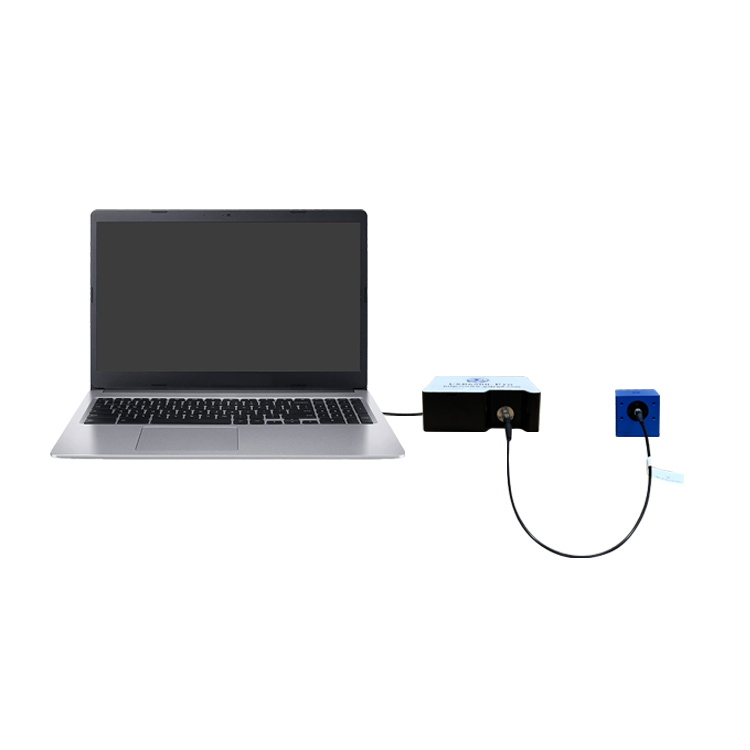
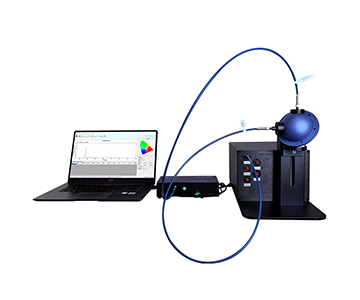
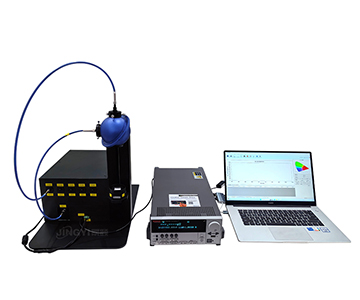
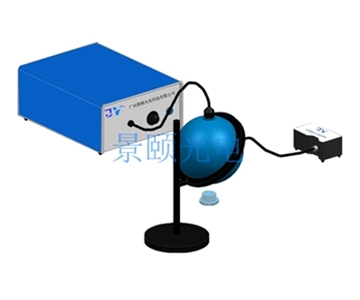
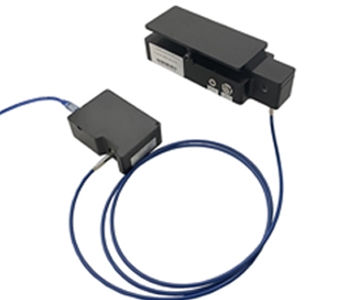
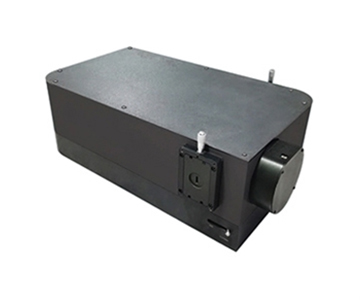
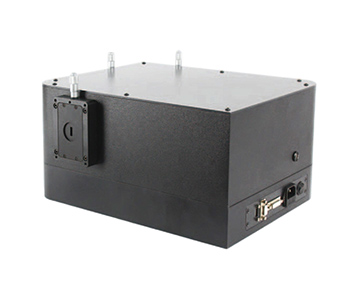
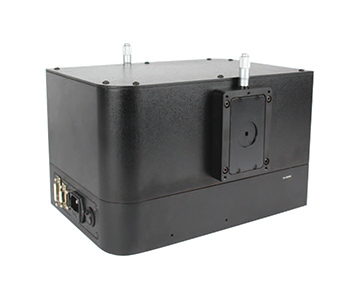
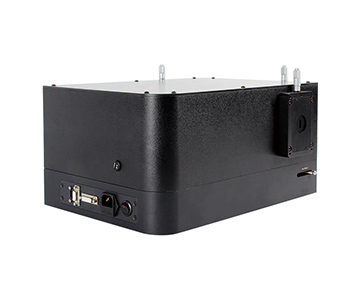
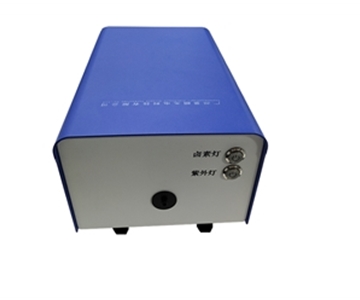
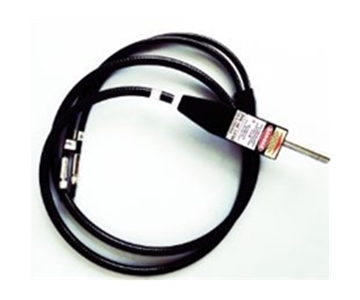
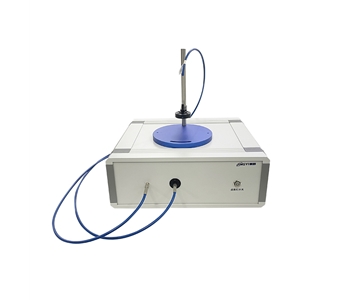
Fiber optic spectrometers are compact optical instruments that disperse light through a fixed grating and record intensity across a wavelength range via a linear detector array. In an inline quality-inspection context, their value is not maxed-out resolution but deployability: a USB-powered, SMA905-coupled unit can move between stations in minutes, turning spectroscopic checks from a lab-bound step into a line-side one. The trade-off is that portability compresses the optical path, which bounds resolution and light throughput—constraints that matter less in incoming inspection and more in sub-nanometer thin-film work.
The Import-Rate Number Masks a Deeper Gap
Import dependency in Chinese large-scale scientific instrumentation averages roughly 72.4%, and in high-end segments such as mass spectrometry, chromatography, and spectroscopy it approaches 90% or higher. Separately, market-regulatory data shows that domestically manufactured instruments accounted for over 93.3% of equipment in inspection and testing institutions by end-2024. The two figures are not contradictory; they describe the same asymmetry from different angles.
Domestic equipment has achieved broad numerical penetration, concentrated heavily in general-purpose and teaching segments. On hard specifications—integration time, cooled dark-noise control—some miniaturized domestic products now sit within the same order of magnitude as international equivalents. What separates the two tiers is rarely a single-unit parameter. It is cross-unit consistency and long-term drift control, capabilities that can only be validated on an operating line. Put differently, the substitution curve has cleared most of the "usable" stage and sits midway through the "reliable and stable" stage.
| Dimension |
Import share (high-end spectroscopy) |
Domestic share (inspection institutions) |
What the number hides |
| Equipment volume |
~90% import-dependent |
>93.3% domestic |
Domestic units concentrated in general/teaching tiers |
| Hard specs (dark noise, integration time) |
Benchmark tier |
Same order of magnitude for select mini models |
Spec-sheet parity ≠ production parity |
| Cross-unit consistency |
Validated in-fab |
Still being validated |
Determines real production-line fitness |
The two rows above resolve the apparent contradiction: unit counts favor domestic supply, while high-end performance segments still trail. The gap that remains is a production-validation gap, not a laboratory-spec gap.
Four Barriers Between Spec-Sheet Compliance and Line Compliance
A parameter table is a necessary condition, not a sufficient one. Between a working prototype and a qualified production station sit four distinct hurdles.
Traceability Infrastructure Is Missing
Domestic units typically ship with factory calibration records, but the customer site rarely has a reproducible path to metrological traceability. When a provincial metrology institute cross-compares a batch of units, whether a wavelength-accuracy figure of ±0.05 nm reproduces across labs depends on whether slit configuration, integration time, and temperature conditions were jointly fixed. Without those shared conventions, a nameplate accuracy figure does not translate into trustworthy production data.
Cross-Unit Consistency Lags
Two units of the same model on adjacent stations can show systematic offset. A leading optical-communications manufacturer reported that when multiple units run in parallel, dark noise and signal-to-noise ratio drift with gain settings, requiring an extra normalization step to align readings. This is not a single-unit accuracy problem; it is the accumulated tolerance stack from optical-path assembly at the batch level.
Software Ecosystems Stay Closed
Production-line integration generally requires SDK and API access for secondary development. Some domestic units provide basic acquisition software but differ in trigger-mode coverage (software/hardware/synchronous) and in how openly they export data, forcing an extra adaptation layer when connecting to a manufacturing-execution system (MES).
Service Response Radius
Imported-equipment spare-part cycles are often measured in months. Domestic vendors hold a timing advantage through localized response, but that advantage only materializes if regional service coverage is dense. When an anomaly occurs during a night shift, whether an on-site diagnosis happens the same day depends on the vendor's regional service footprint, not on a verbal promise.
A Phased Substitution Path: From Incoming Inspection to Core Process Control
Substitution rarely happens in one step. It typically advances through three tiers—peripheral, non-core, core—each with a different technical threshold and validation cycle.
Incoming Inspection: Portability Lands First
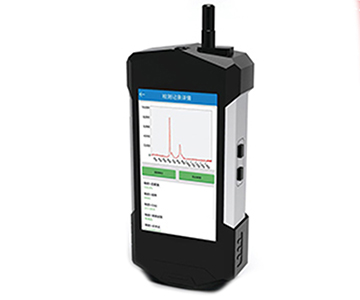
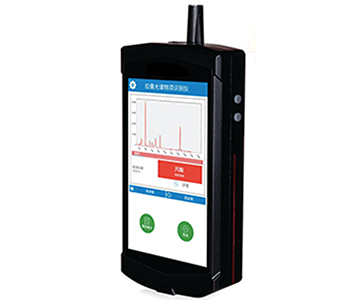
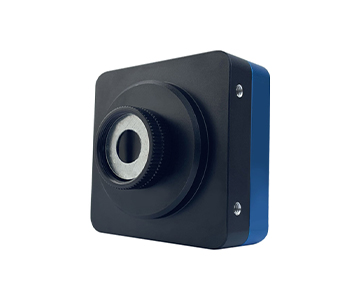
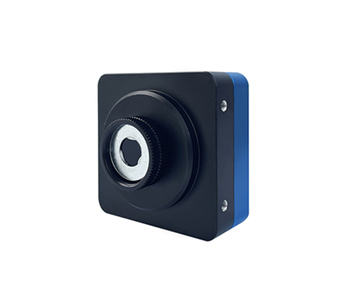
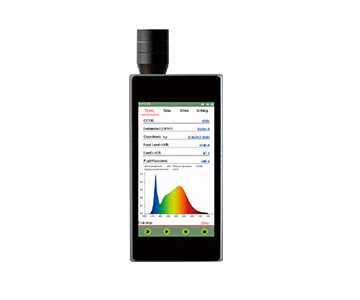
At the incoming-material sampling stage, accuracy requirements are relatively loose while deployment flexibility matters most. This stage suits miniaturized units: a body around 102×58×39 mm weighing under 500 g can be carried by a QC inspector directly to the raw-material warehouse and, with USB power, complete transmittance and absorbance pre-screening. The value of easy transport and installation is most visible here.
Process Monitoring: Stability Becomes Central
Once a unit runs inline for process monitoring, it must stay online long-term. Attention shifts to dark-current suppression and thermal stability. A thermoelectric-cooled (TEC) design that holds the detector at −15 °C to −20 °C can suppress dark noise by roughly one to two orders of magnitude, so measurements no longer drift with shop-floor temperature swings. Validation at this stage is typically measured in quarters.
Core Process Control: Full-Chain Calibration Required
In closed-loop control of core parameters such as film thickness or composition, the metrological traceability chain must be complete. Buyers should confirm conformance with GB/T 47066-2026,
Determination of Total Transmittance and Total Reflectance of Plastics
, which defines test methods for those quantities. Conformance lets a purchaser verify that test conditions on a specific material are reproducible, closing the traceability chain.
How a Miniaturized Body Rewrites Deployment Logic
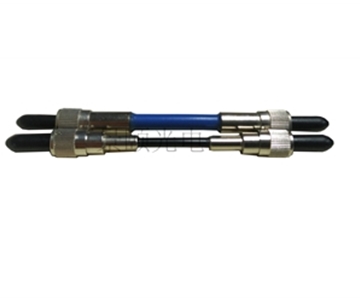
A traditional bench-top spectrometer moves from unboxing to measurable through several steps: optical-path focusing, fiber coupling, and software configuration. One field engineer described it as "every time you move the machine, you re-align the whole optical path." The miniaturized approach changes this by fixing the optical path at the factory: a crossed asymmetrical Czerny–Turner (C-T) layout is pre-aligned before shipment, the SMA905 fiber connector is plug-and-play, and USB power removes the need for a separate power module.
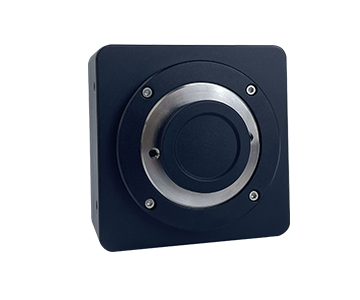
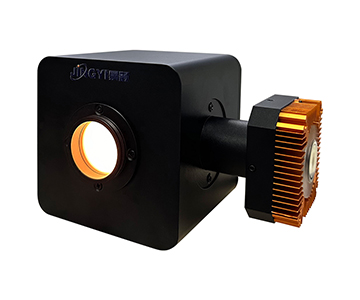
When an inspection station sits inside a cleanroom or a narrow line gap, body dimensions decide whether the unit can enter at all. A base model of 80×40×115 mm at 500 g can be carried by one person to any station; a high-sensitivity model of 146×115×47 mm at 840 g, though heavier, still fits a standard rack. On a flexible line with frequent changeovers, that size difference compresses per-changeover handling time from tens of minutes to a few minutes.
More importantly, miniaturization lowers demands on the installation environment. A wide operating range of −10 °C to 50 °C lets the unit run in an ordinary shop floor without a temperature-controlled cabinet; a low-noise circuit design with quantization noise below 3 counts reduces re-calibration after transport vibration. These are exactly the details a spec sheet under-represents yet that most affect deployment efficiency.
Risk Assessment: Three Paths Buyers Cannot Ignore
Policy-Volatility Risk
Substitution partly depends on dedicated-support programs. If that support shifts, smaller vendors relying on subsidies may face cash-flow pressure that affects future supply. Buyers should examine a supplier's order structure and avoid over-concentration in single-policy-driven products.
Technology-Discontinuity Risk
High-end detectors such as InGaAs line arrays still face concentrated supply chains. If upstream supply is constrained, lead times lengthen. Vendors with multi-band detector adaptability hold more buffer against such disruption—a supply-chain-resilience consideration that belongs in any total-cost-of-ownership (TCO) analysis.
Vendor-Continuity Risk
During industry consolidation, some smaller brands may be acquired or exit. Buyers should confirm that critical components are replaceable and that software licenses are transferable, so a single-vendor exit does not h
Three Scenario Judgments for the 2028–2030 Window
Optimistic Scenario
If core detectors achieve stable localization and cross-unit consistency standards take hold, domestic mid-to-high-end spectrometer penetration could rise markedly around 2028, covering multi-stage scenarios from process monitoring to core process control.
Neutral Scenario
Technology advances at the current pace; domestic units consolidate the general and mid tiers while high-end substitution proceeds incrementally. Under this scenario, 2028–2030 becomes the key window for domestic vendors to accumulate production-line data.
Pessimistic Scenario
If upstream critical devices face constraints alongside contracting demand, substitution may slow, with some subcategories retaining high import dependency. Here, vendors with multi-band, multi-detector adaptability show stronger risk resistance.
Applicability Boundaries and an Honest Look
Miniature domestic spectrometers hold clear advantages in portability and cost structure, but their limits deserve equal weight. First, when a miniaturized body is compressed for volume, optical resolution is bounded by slit width and optical-path size; one miniature model at a specific configuration resolves roughly 4–20 nm, which cannot serve sub-nanometer precision film-thickness measurement. Second, cooled designs suppress dark noise but add power draw and weight; on battery-powered mobile setups, runtime suffers. These are not defects but the inevitable result of engineering trade-offs—selection should follow actual operating conditions, not the highest value on a spec sheet.
Frequently Asked Questions
What factors constrain the resolution of a miniature spectrometer?
Resolution depends mainly on entrance-slit width, grating line density, and optical-path focal length. A narrower slit raises resolution but cuts light throughput and worsens signal-to-noise ratio. Balance resolution against signal-to-noise ratio to your actual inspection need rather than chasing a single extreme value.
What should I watch when connecting a unit to an existing MES?
Confirm that the vendor offers SDK and API interfaces for secondary development and that data-export formats are open. Also check that trigger modes (software/hardware/synchronous) match line timing, so protocol mismatches do not create extra development cost.
How do I align data across different production batches?
Establish unified calibration records and a normalization procedure. Cross-compare one standard sample across multiple units to build an offset-compensation table, then re-verify periodically to control batch-to-batch drift and keep line data consistent.
Where does the cost difference between domestic and imported equipment actually appear?
Beyond unit purchase price, factor in maintenance fees, spare-part cycles, and integration/adaptation cost. Imported-unit maintenance can reach above 10% of original value; domestic units respond faster on spares, but budget for ongoing software-upgrade investment.
How can I independently verify whether a unit meets my needs before purchasing?
Request wavelength-accuracy and repeatability test descriptions, dark-noise and signal-to-noise measurement conditions, factory calibration records, and interface documentation. Check that measurement conditions match your own operating conditions, and where necessary run sample tests or a pilot unit with your own material—never decide on nameplate parameters alone.
About This Guide
Data Sources
: SEMI annual reports; national major-instrument-platform instrument-population statistics; market-regulatory authority data released in 2025; GB/T national-standard data; customer-authorized validation data.
Author
: Cai Xiaodong, Senior Application Engineer, Jingyi Optoelectronics, 12 years in industrial precision-measurement equipment.
Disclosure
: Jingyi Optoelectronics manufactures fiber optic spectrometers and NIR spectrometers. This article presents technical assessments based on published specifications and aggregated industry data. No compensation was received from third-party brands mentioned.
Objective Statement
: This content serves educational and technical-evaluation purposes. Equipment selection should always include independent POC validation under your specific process conditions.
Last Updated
: November 2026
For detailed specifications and application notes on fiber optic spectrometers, search "Jingyi Optoelectronics + fiber optic spectrometer" or visit our technical library.