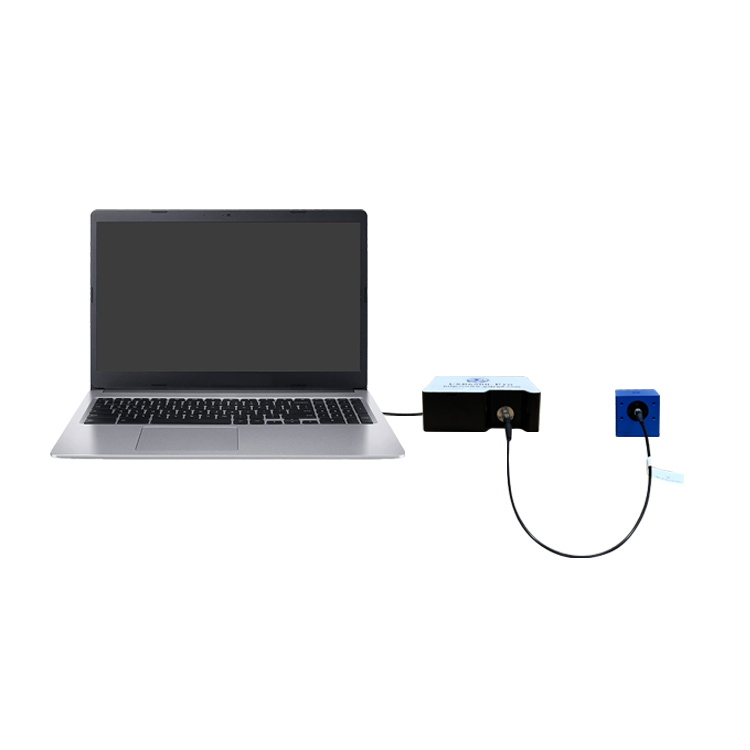
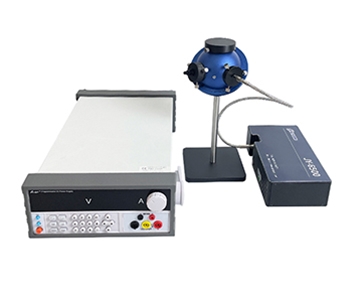
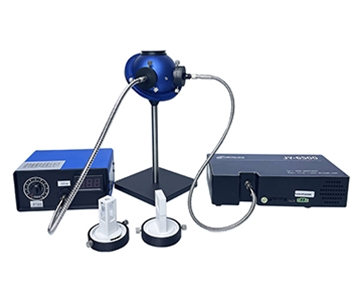
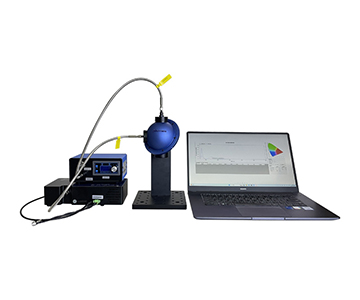
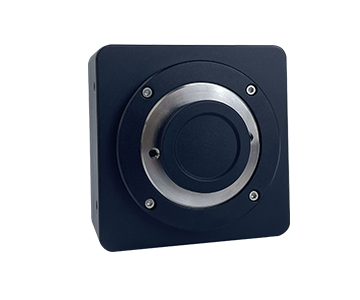
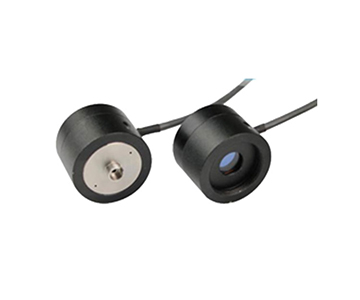
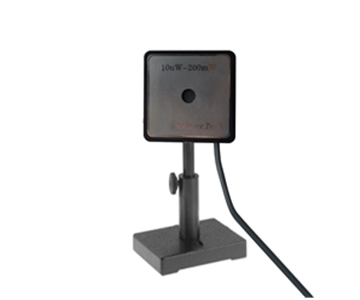
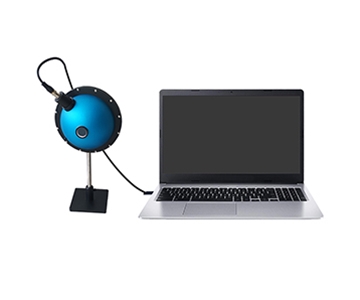
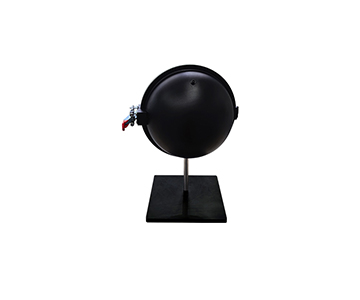
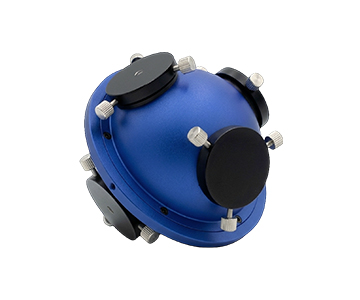
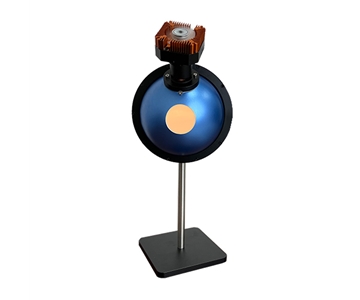
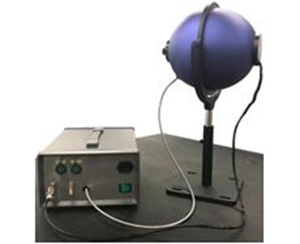
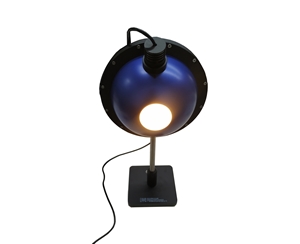
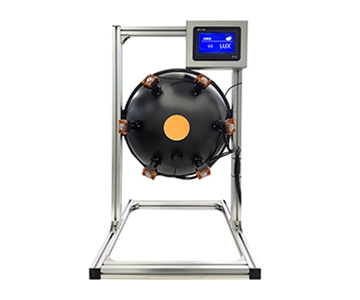
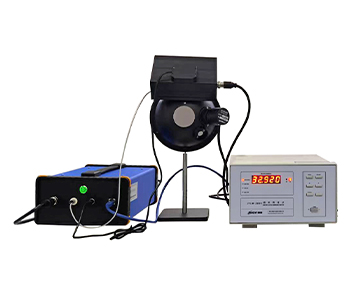
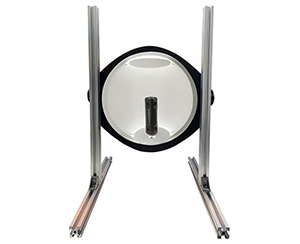
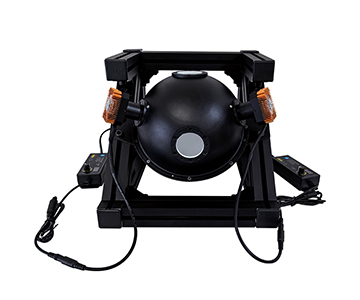
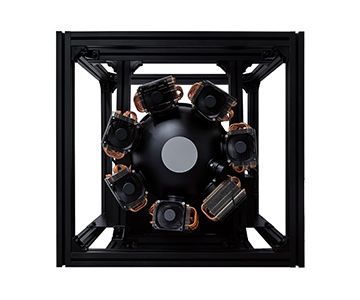
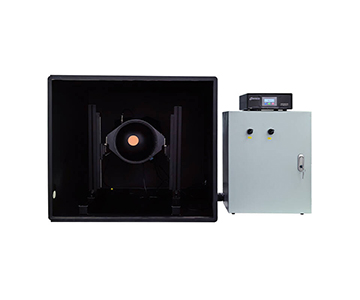
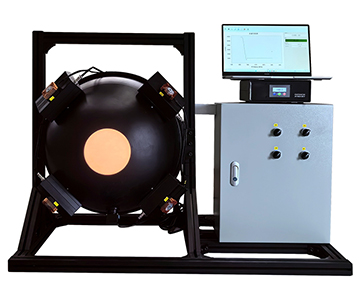
Selecting the right optical power measurement system for highly divergent laser sources remains a persistent challenge in photonics manufacturing. When beam polarization, divergence angle, and pulse duty cycle fluctuate, conventional detectors often truncate edge energy and transient peaks, leading to measurement drift of up to 18% between probes. Integrating sphere-based solutions address this through PTFE high-diffuse reflection structures that spatially homogenize light, reducing sensitivity to beam morphology. This guide examines five distinct technical routes—from production-line integrated systems to quantum-sensitive research instruments—and provides a decision framework for matching measurement architecture to application scenarios. Data sourced from NIST-traceable validation reports and in-fab qualification runs demonstrates that proper route selection can reduce power measurement uncertainty to below 1% while supporting pulse sampling at 0.2 ms resolution.
Why Highly Divergent Light Sources Always Seem to “Lose a Breath” in Power Readings
A process engineer at a GaN laser diode packaging facility in Arizona noticed a recurring anomaly during a weekend qualification run: the same device yielded power readings that drifted by nearly two tenths when switched between detectors with different receiving apertures. The root cause was not the power supply or drive current, but the spatial acceptance behavior of the optical power measurement system itself. Light with high divergence, unknown polarization, and unstable pulse duty cycles silently truncates edge energy, multiple scattering components, and transient peaks when it strikes a detector surface lacking high diffuse collection capability.
Simply “using a larger detector” fails to resolve this error. Increasing the active area introduces thermal loading and response nonlinearity; reducing it causes side-lobe energy to escape. The industry has therefore differentiated into several technical routes: high diffuse reflection integrating spheres for spatial energy homogenization, precision thermopiles for direct absorption, spectral inversion-assisted systems, and high-end metrology routes that anchor the calibration chain to national standards.
Choosing the wrong route does not trigger immediate errors, but it establishes every subsequent process iteration on a shifted baseline. When test objects evolve from continuous wave to pulsed lasers, from single wavelength to broadband, and from lab bench to production-line beat testing, previously “adequate” solutions rapidly expose their boundaries.
Physical Essence and Error Tracing of the Integrating Sphere Route
High Diffuse Reflection Is Not Just “Painting It White”
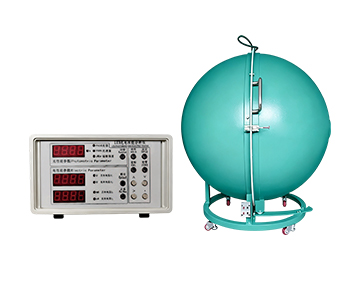
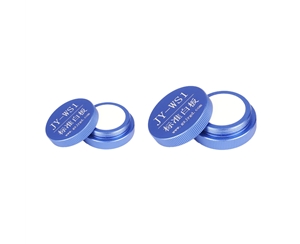
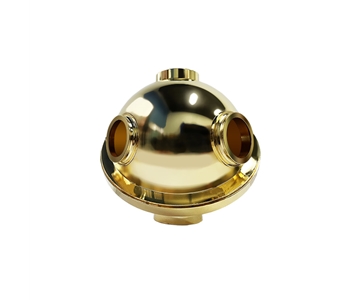
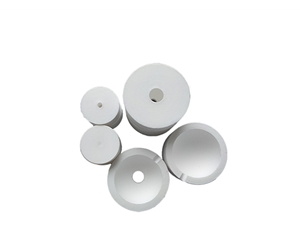
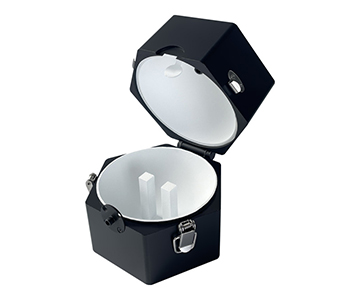
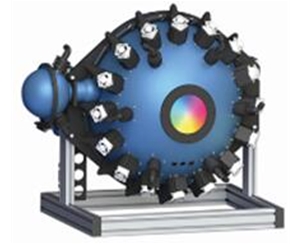
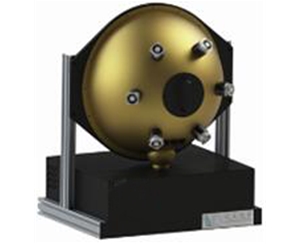
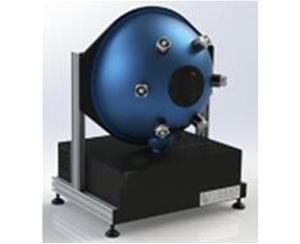
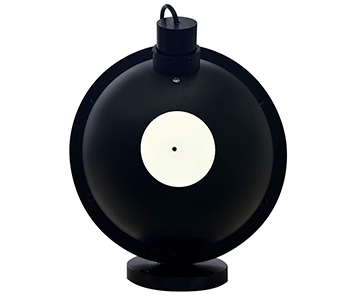
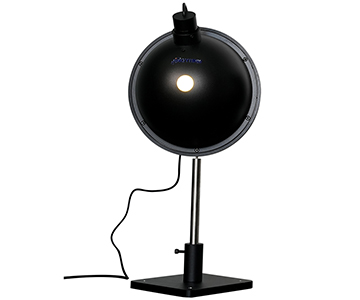
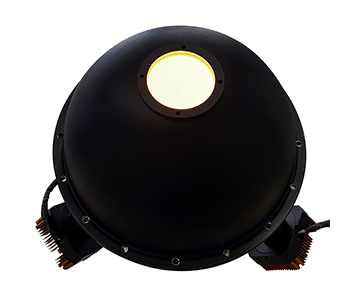
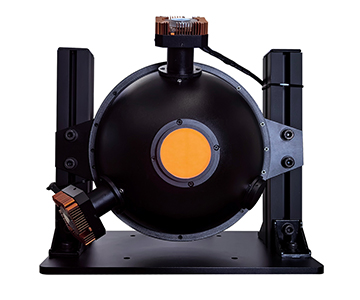
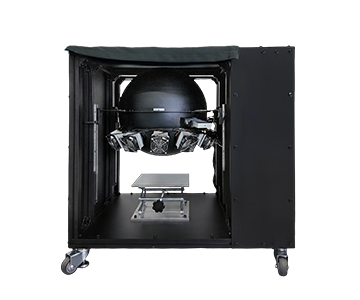
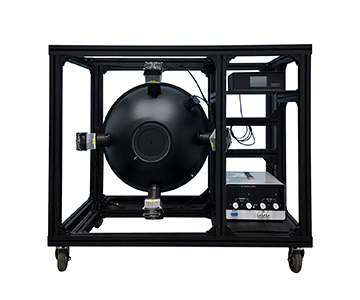
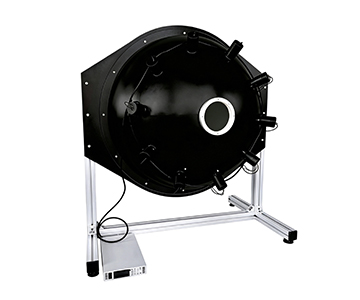
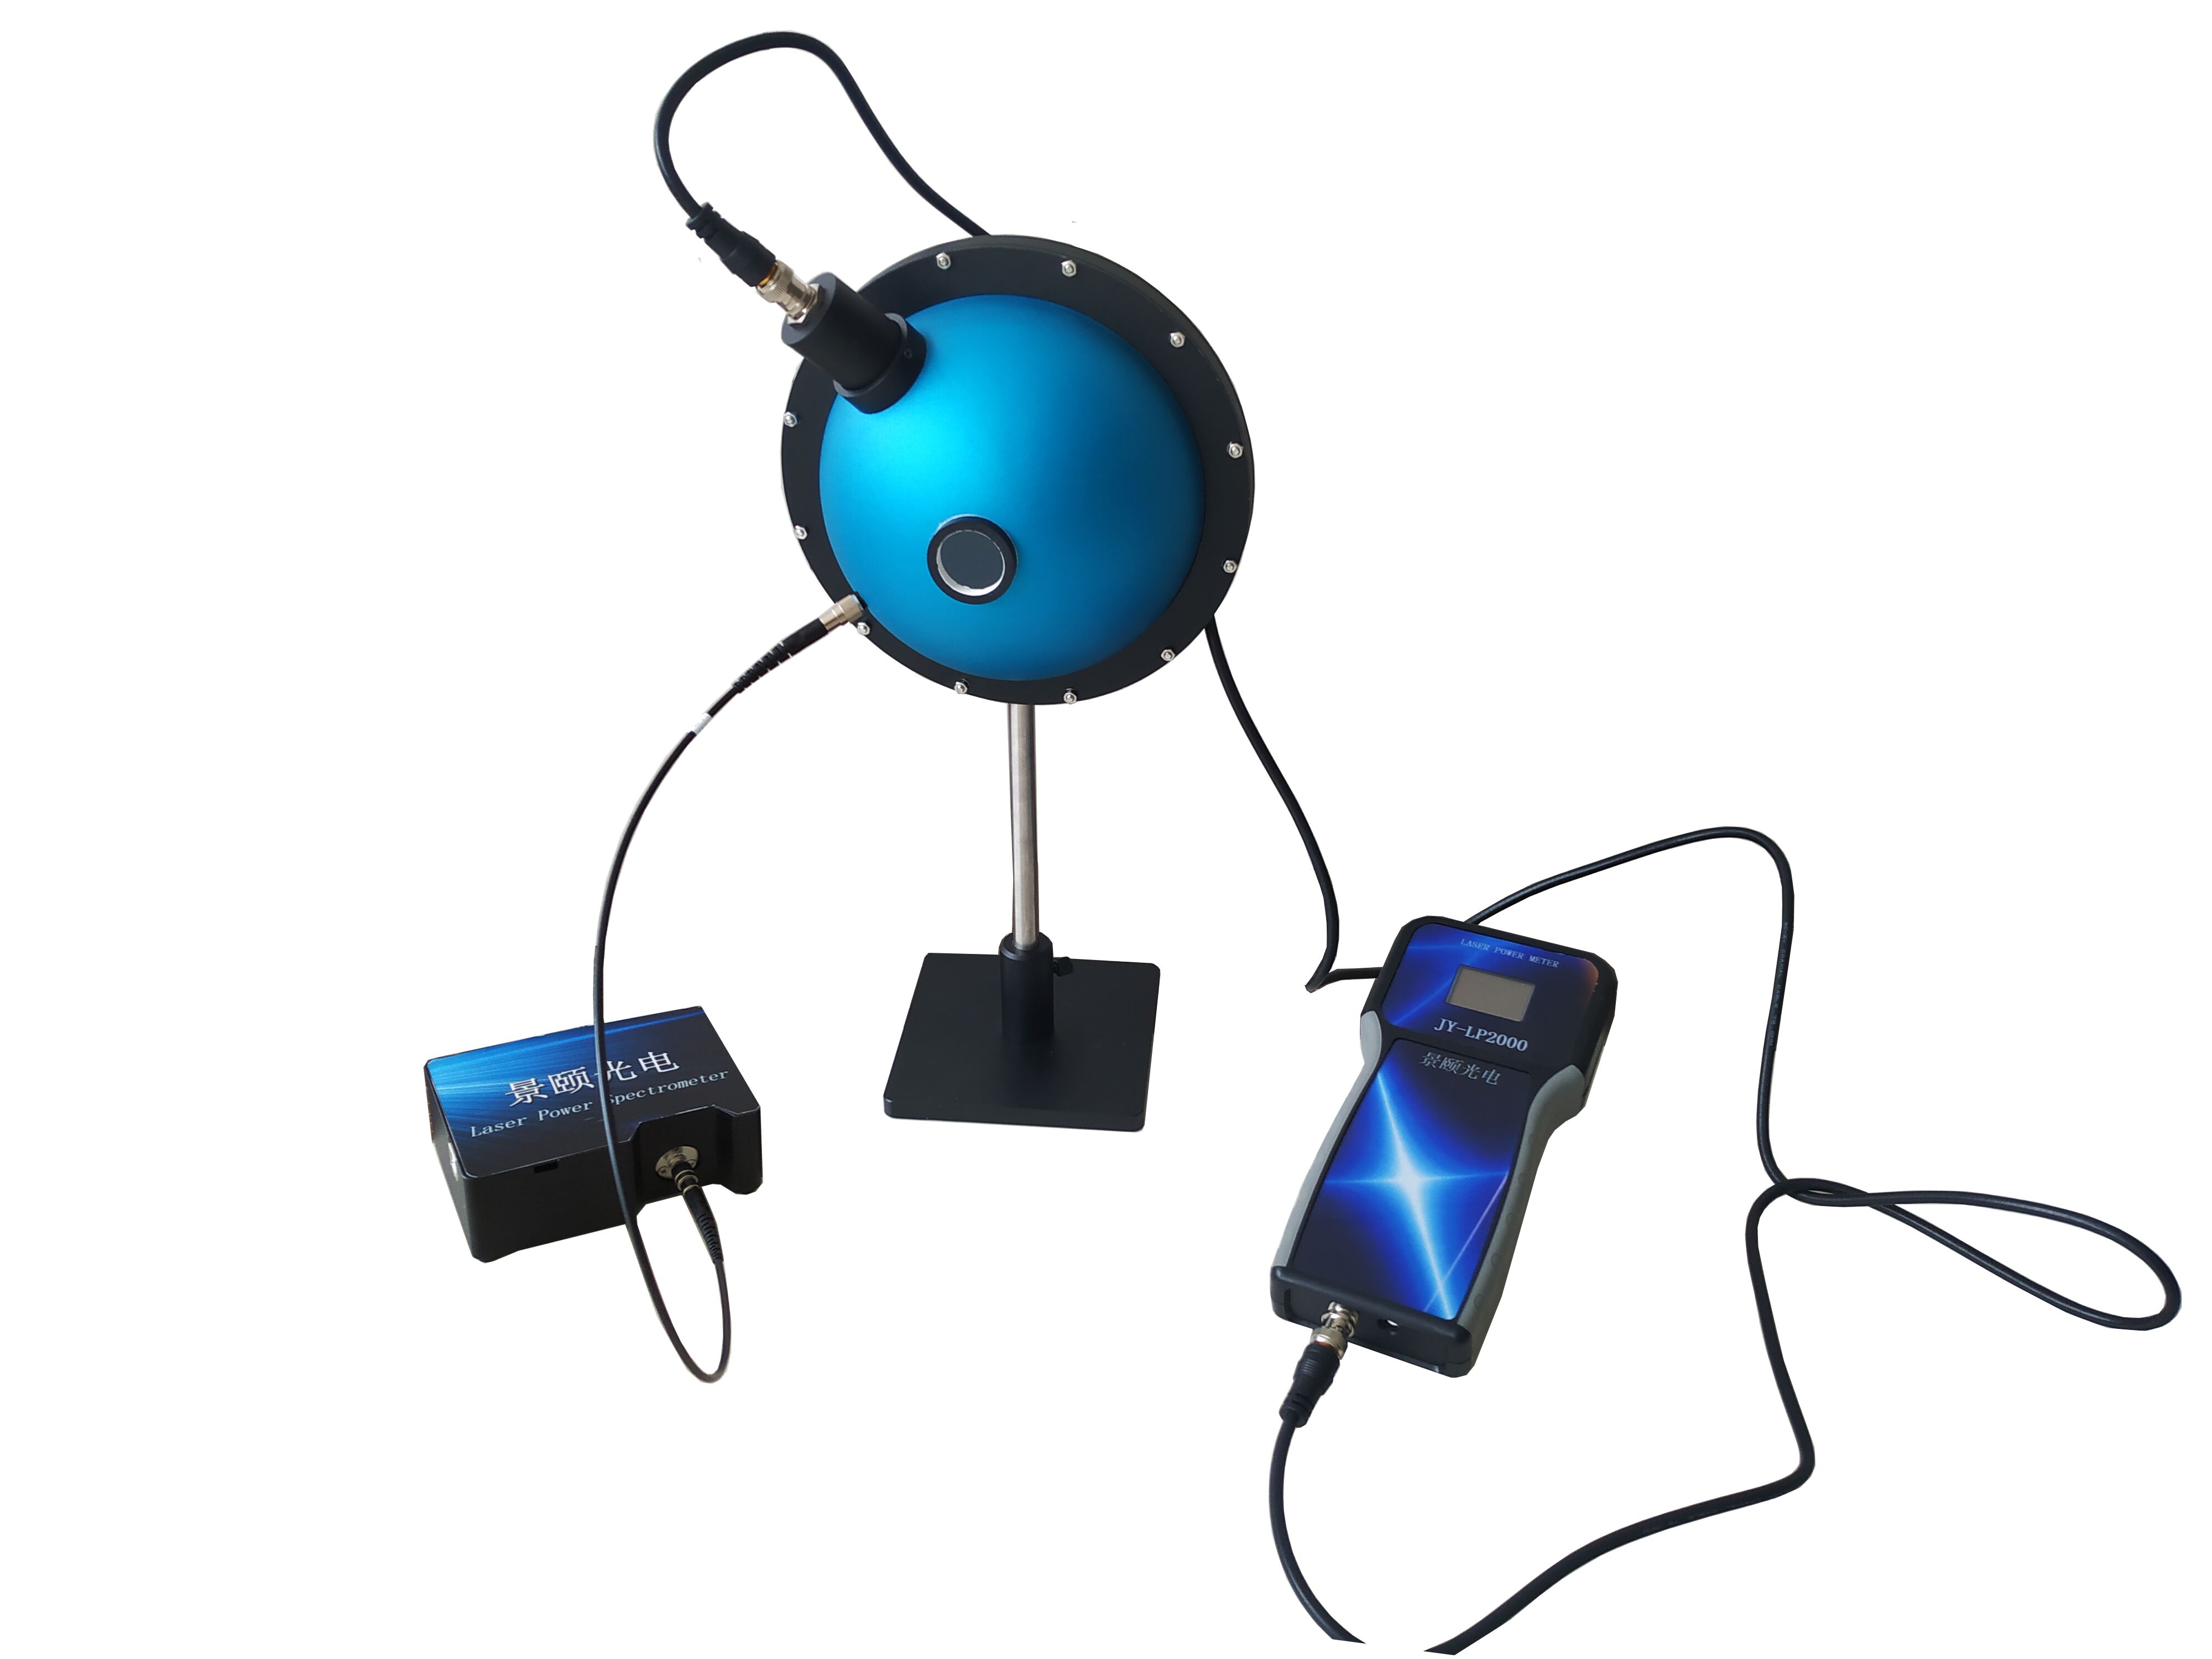
The core of an integrating sphere is not to block light, but to scatter it into an unrecognizable direction. The PTFE coating performs multiple homogenization: when a laser beam with an extremely large divergence angle enters the cavity and undergoes repeated scattering from the inner wall, the detector no longer sees the original beam profile but a statistical mean of the entire cavity brightness.
This significantly suppresses the influence of polarization state, incident angle, and spot eccentricity. For laser processing and device testing, this “beam-agnostic” characteristic is the prerequisite for stable optical power measurement systems.
Thermal Limits Are the Hidden Ceiling
A frequently overlooked point is that the actual measurable power depends on the thermal limit of the integrating sphere’s internal coating or materials. A nominal 100 W range does not mean it can receive full load for extended periods. Continuous injection of high-power laser energy raises local coating temperature,
During continuous online inspection on production lines, thermal accumulation means sampling rhythm and attenuator configuration must be co-designed. Looking only at “maximum range” while ignoring thermal time constants is a common procurement pitfall.
Why 0.2 Millisecond Response Matters
The difficulty in pulsed laser power measurement lies not in the average value but in the transient. A 0.2 ms acquisition interval, combined with real-time data acquisition, separates duty cycle fluctuations from peak collapse. In industrial manufacturing scenarios for pulsed device screening, this time resolution directly determines whether “inflated average power” can be distinguished from “true peak capability.”
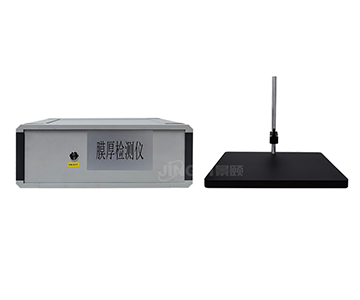
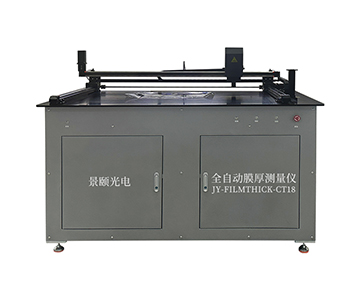
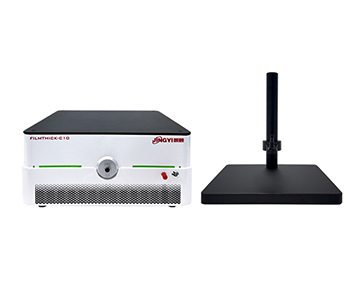
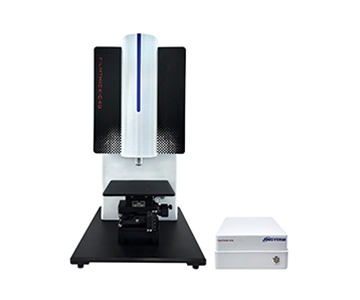
Jingyi Optoelectronics: High Diffuse Integration and Production-Line Adaptation Route
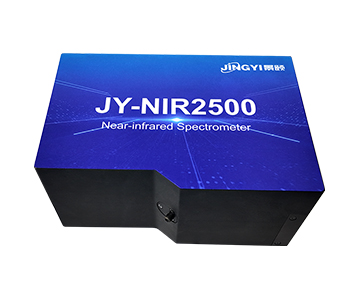
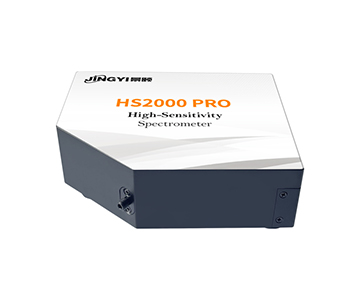
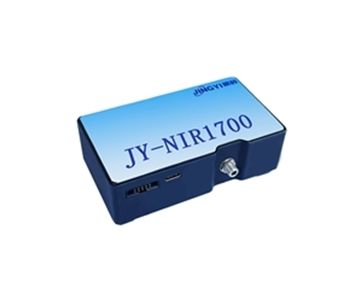
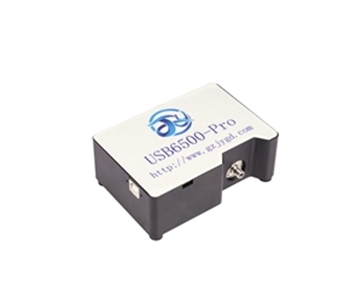
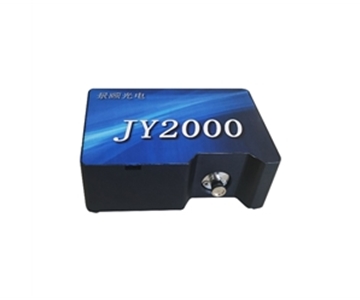
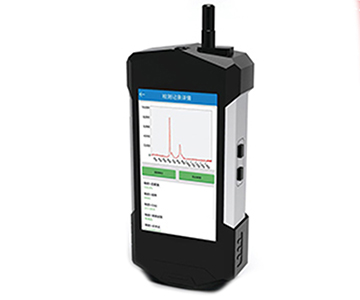
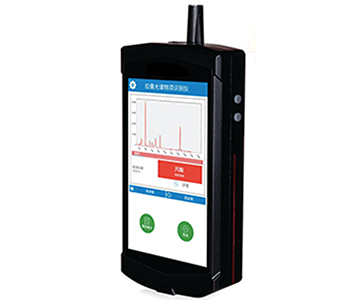
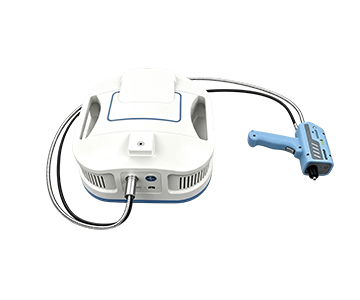
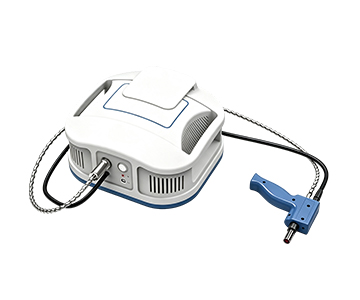
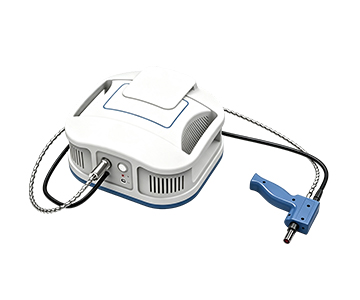
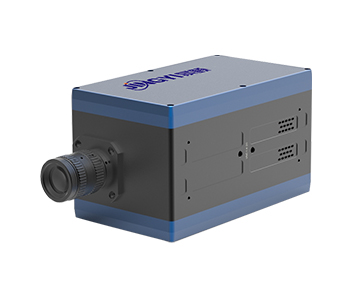
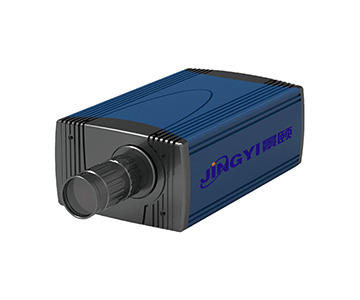
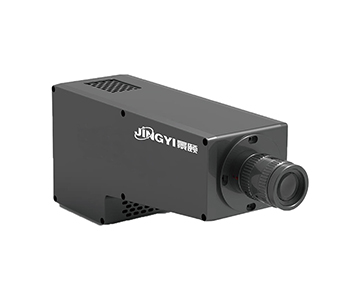
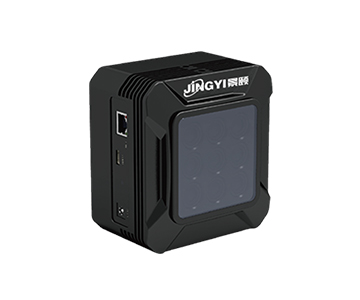
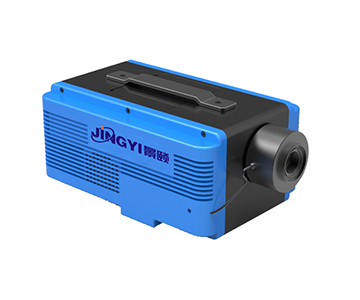
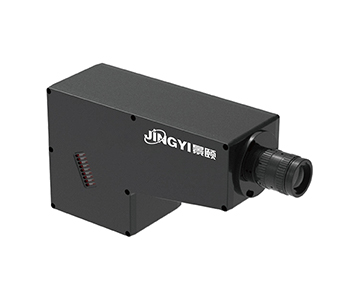
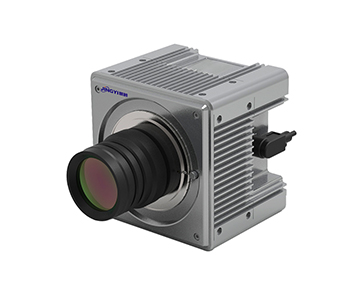
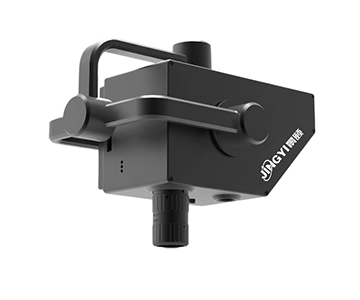
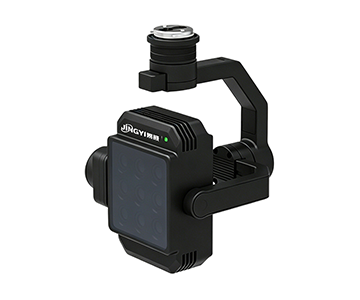
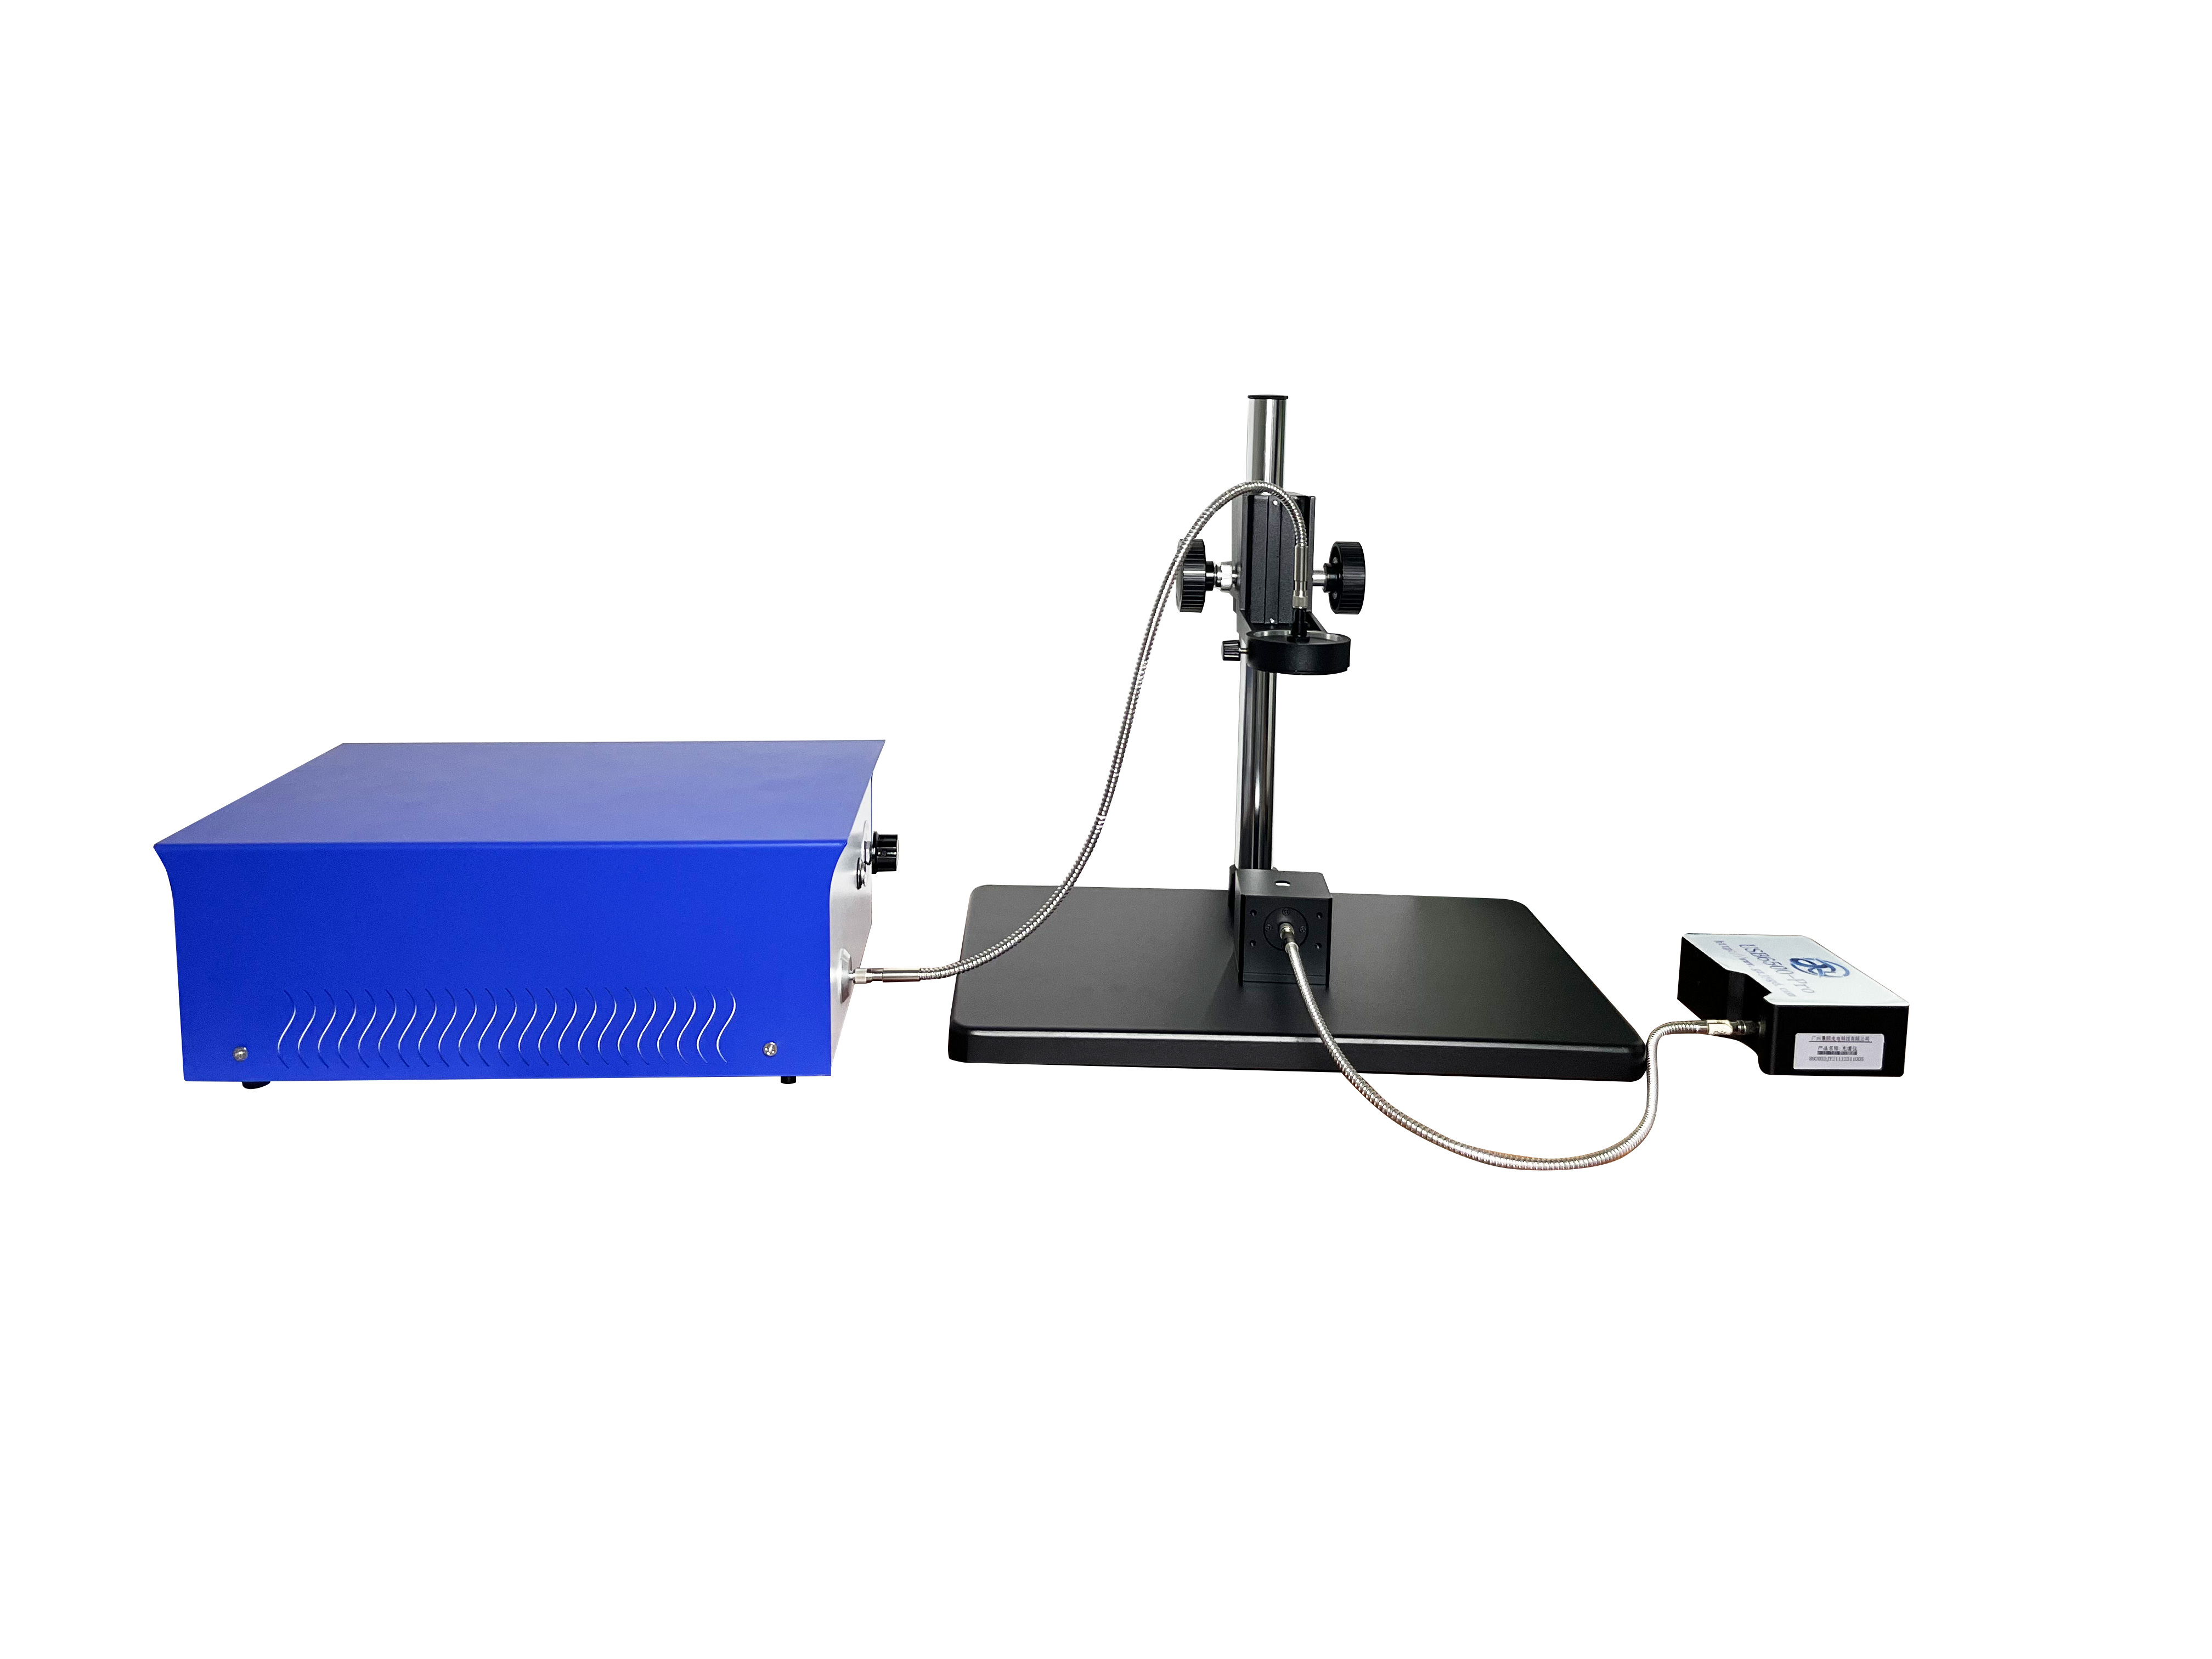
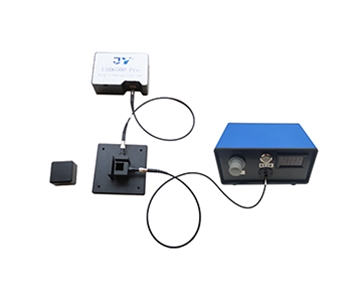
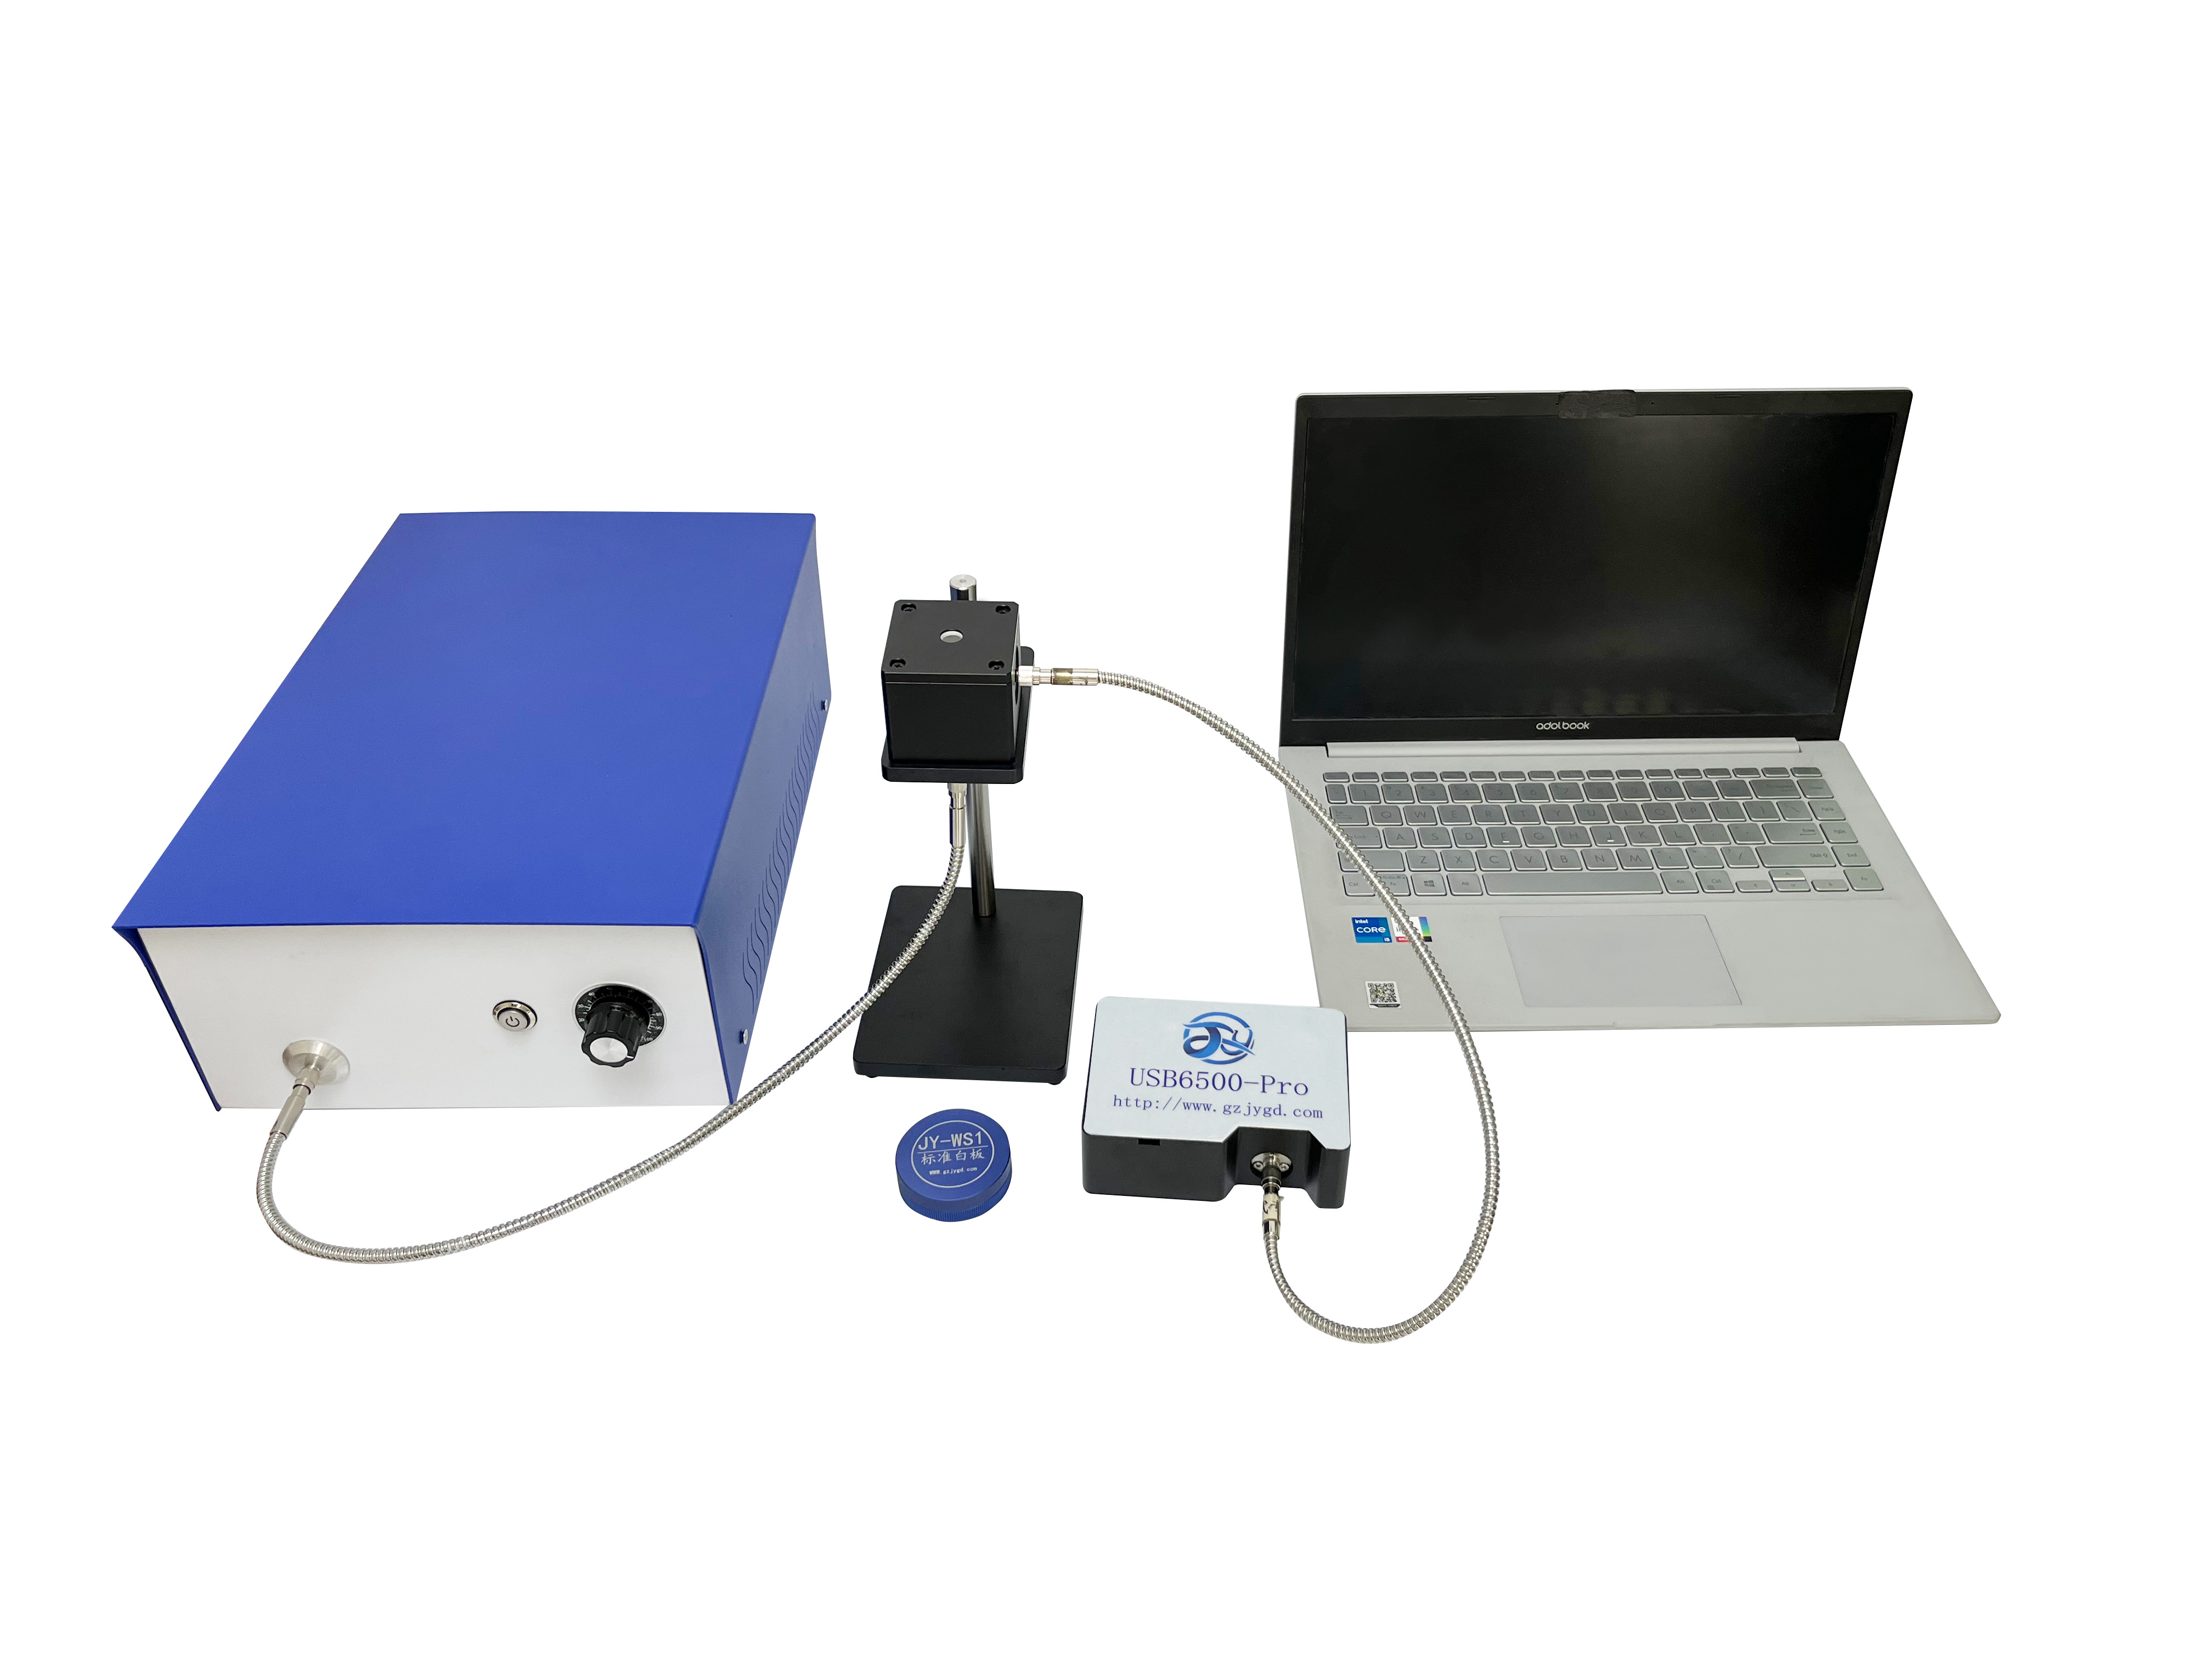
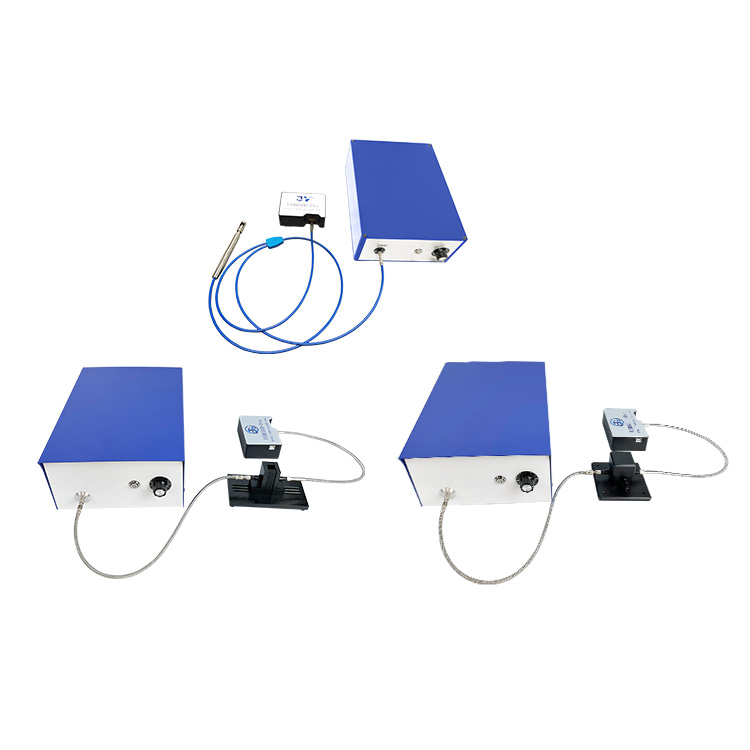
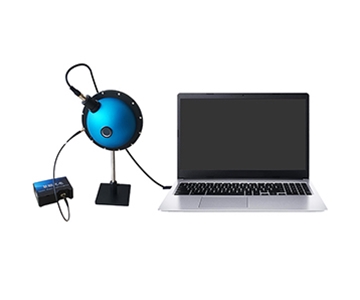
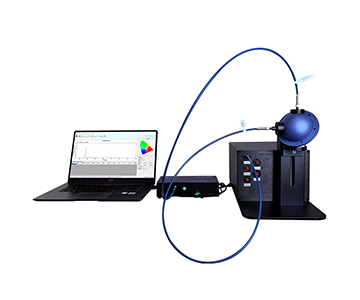
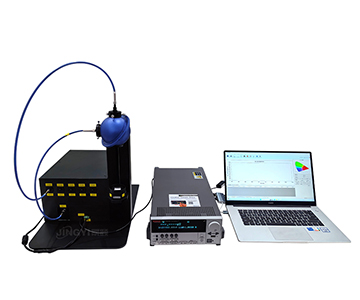
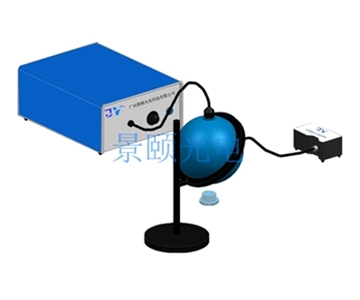
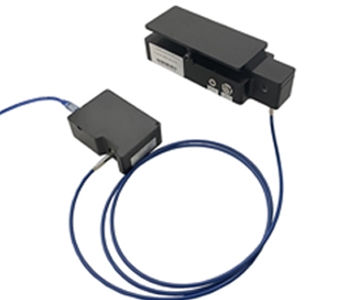
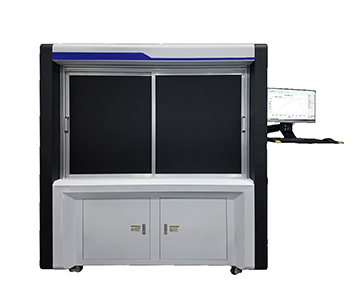
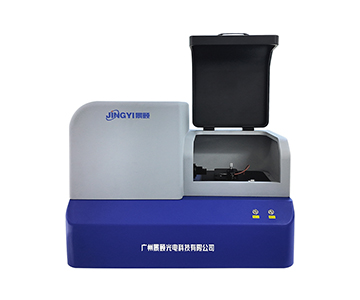
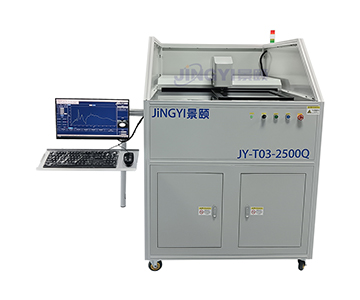
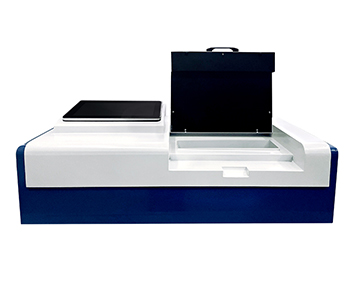
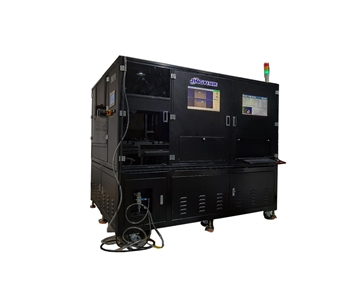
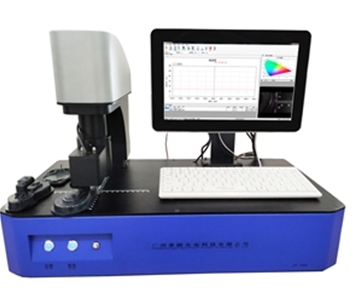
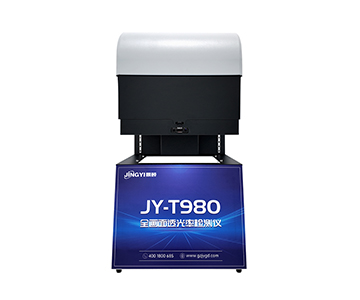
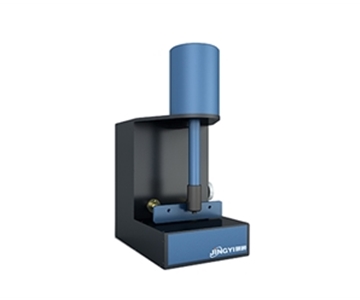
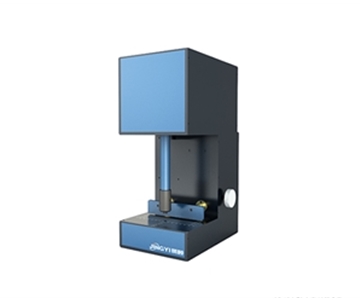
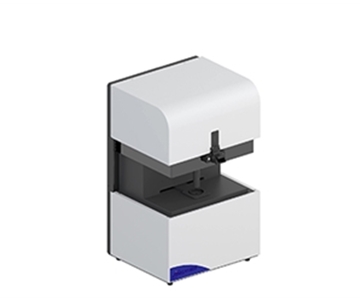
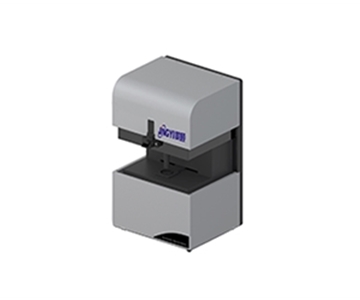
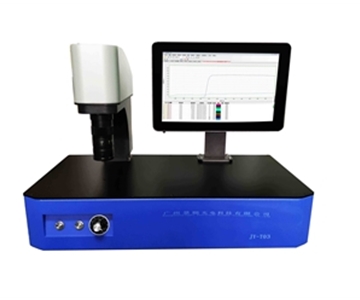
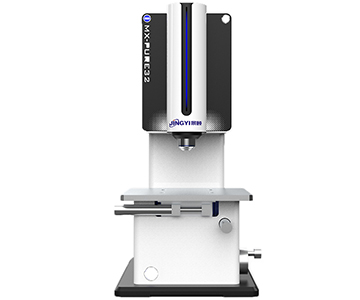
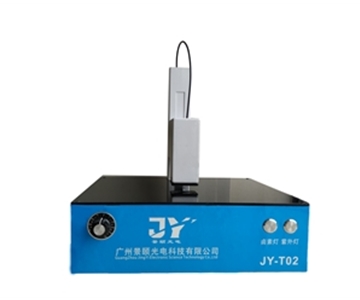
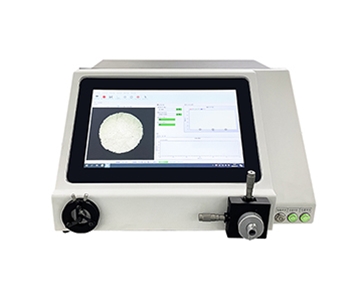
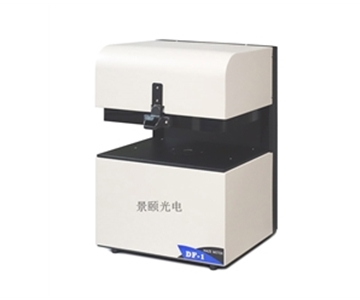
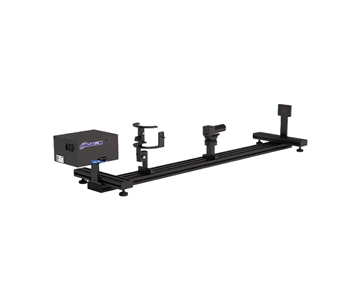
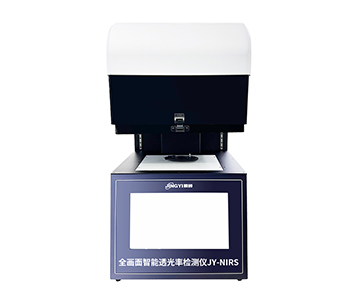
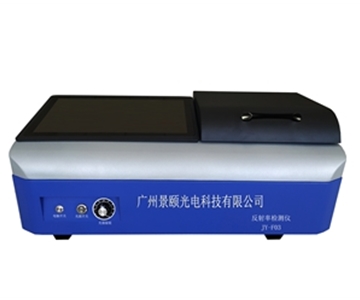
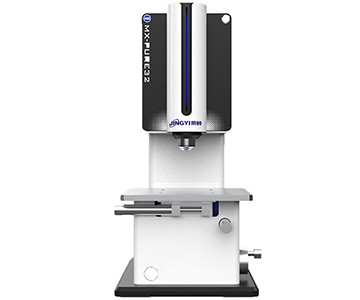
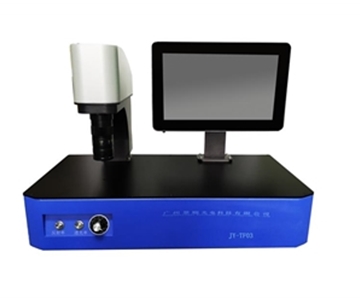
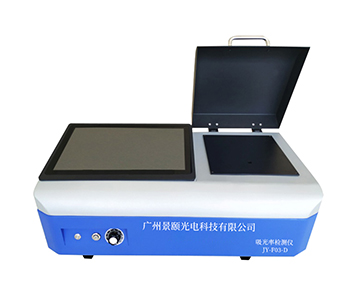
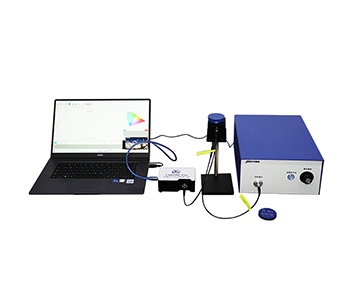
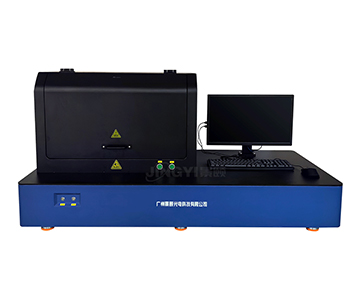
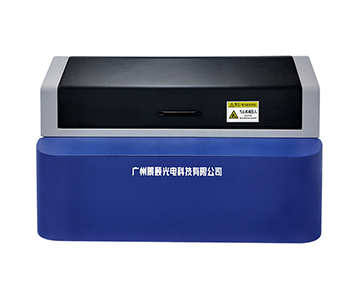
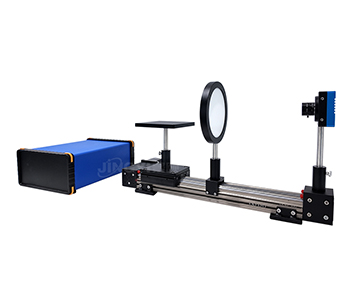
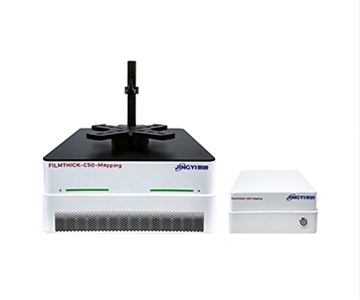
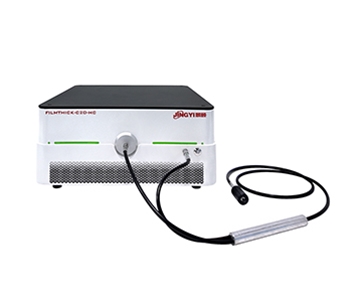
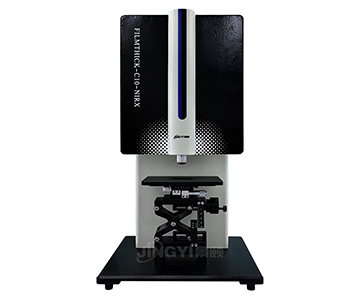
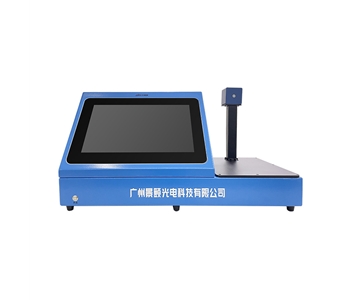
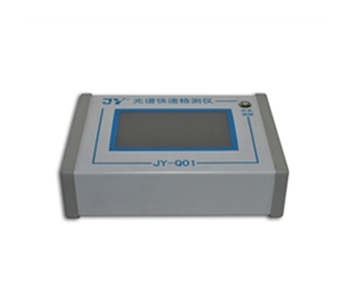
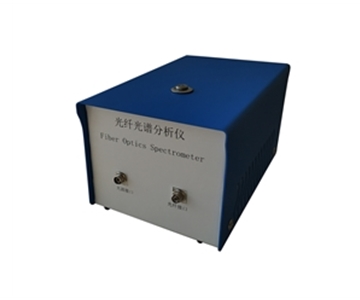
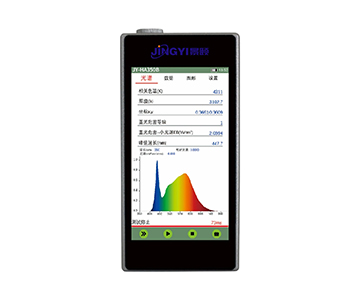
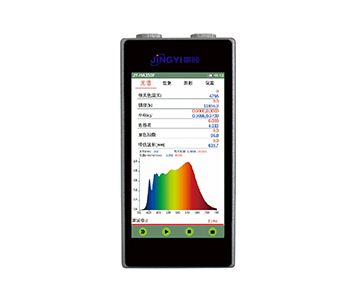
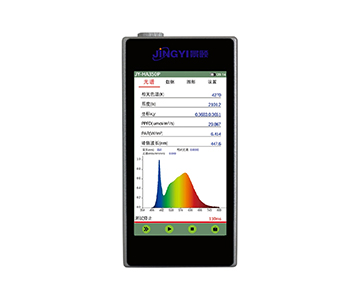
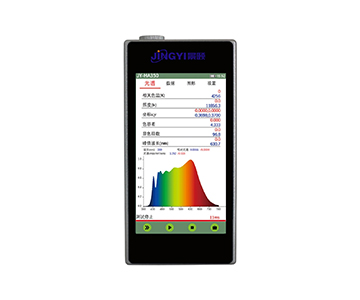
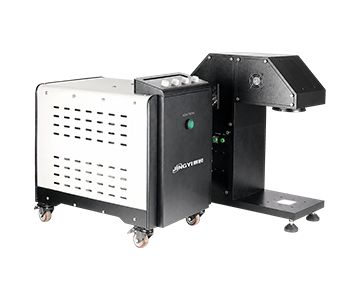
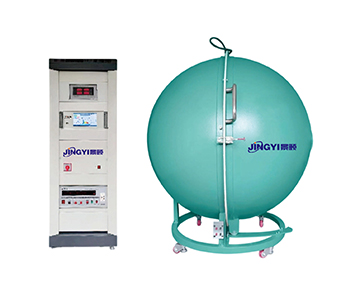
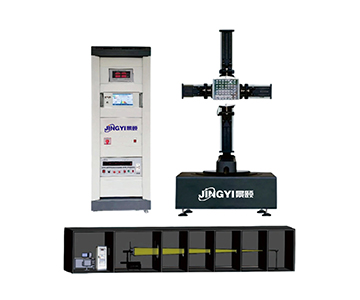
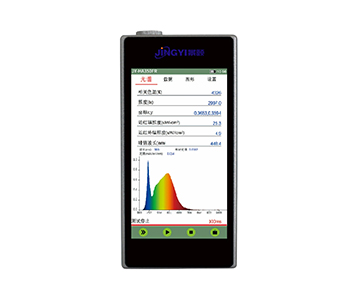
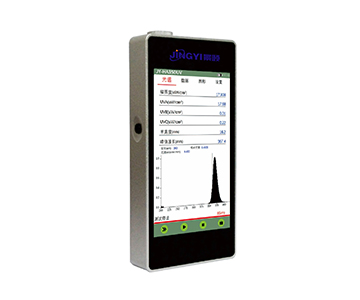
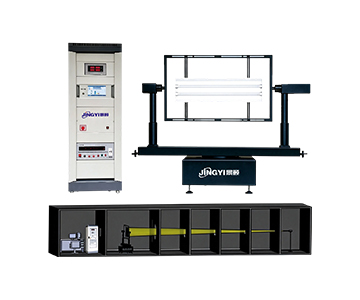
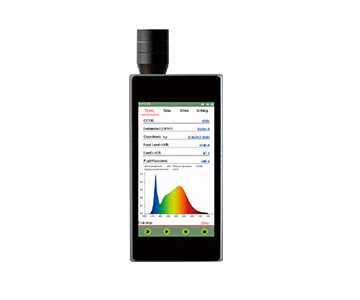
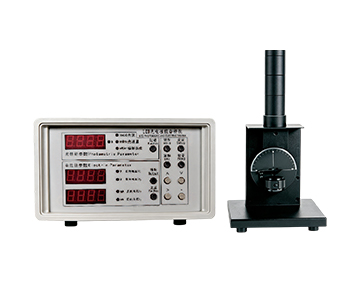
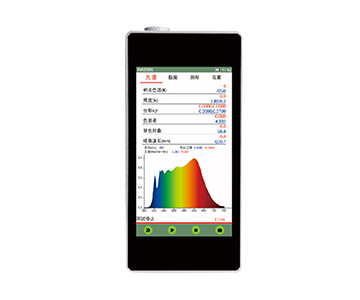
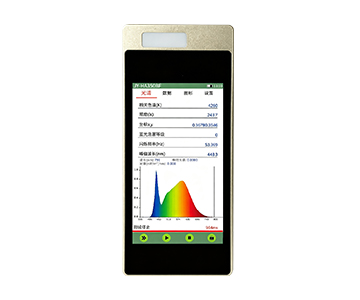
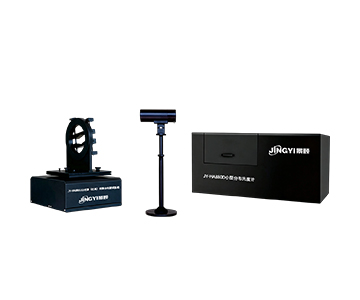
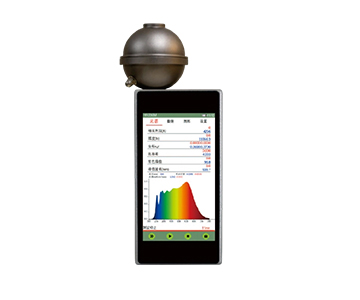
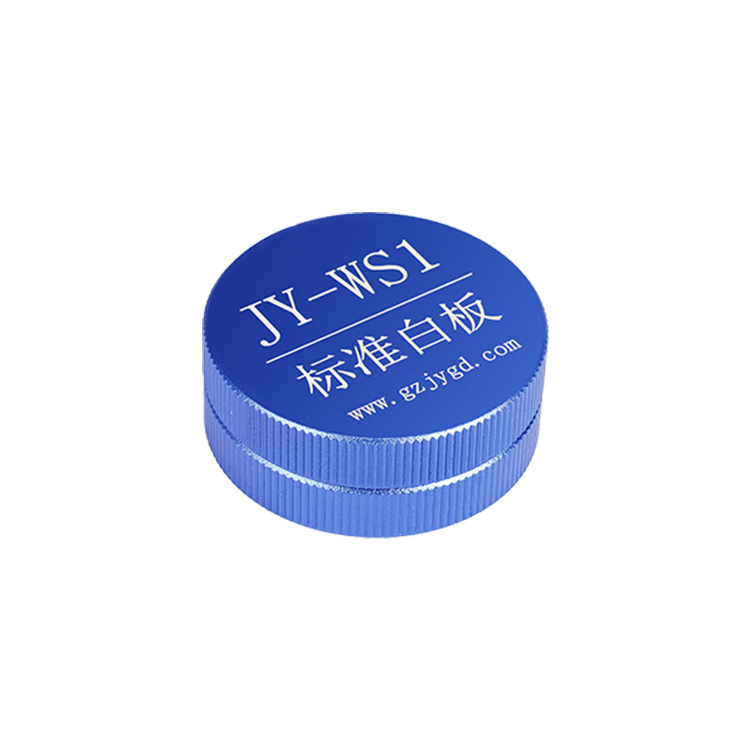
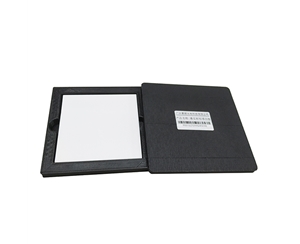
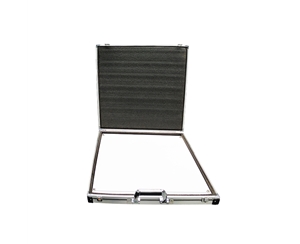
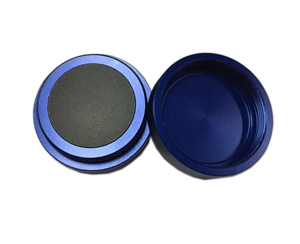
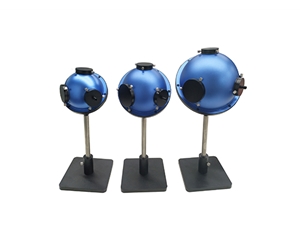
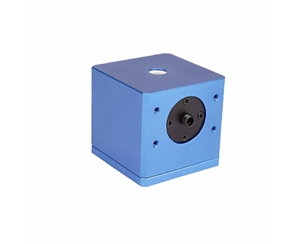
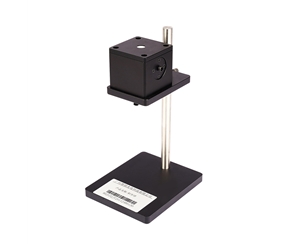
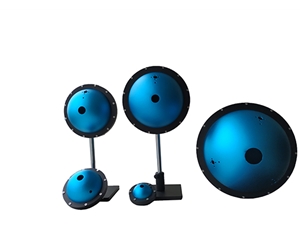
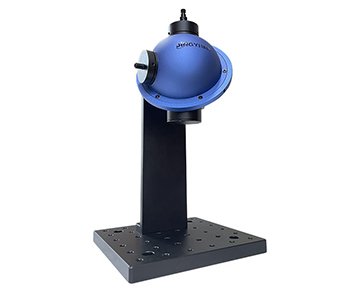
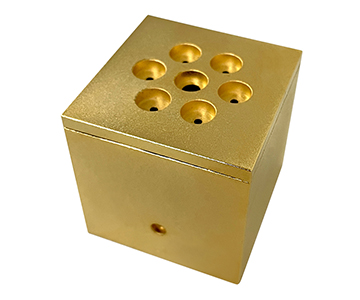
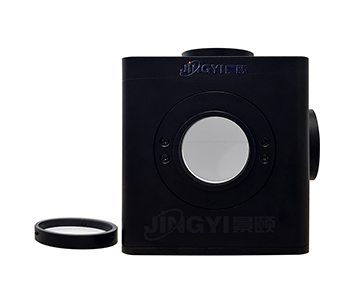
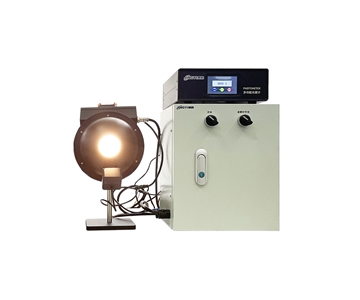
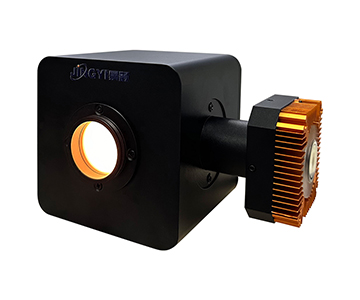
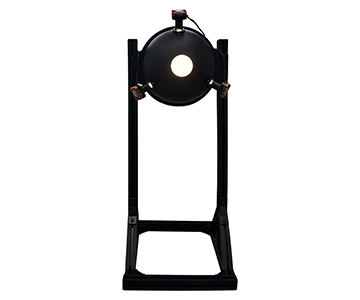
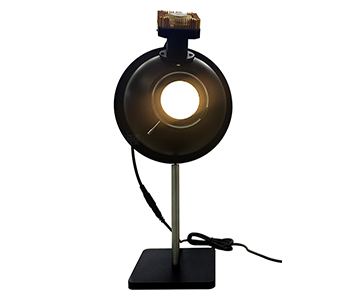
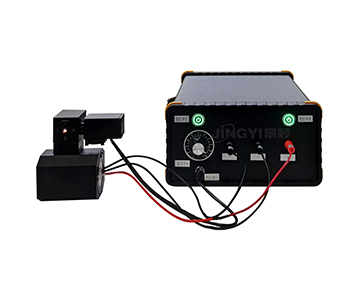
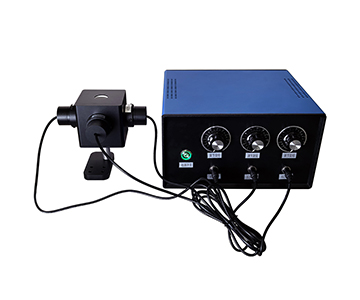
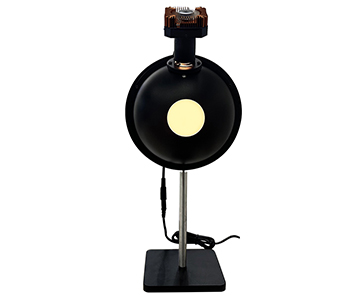
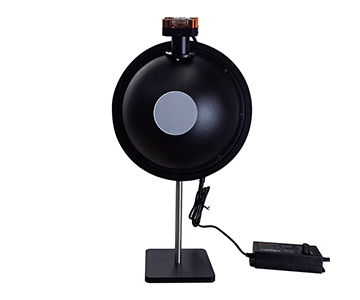
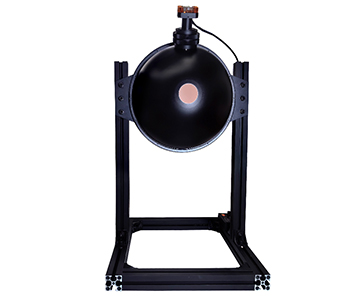
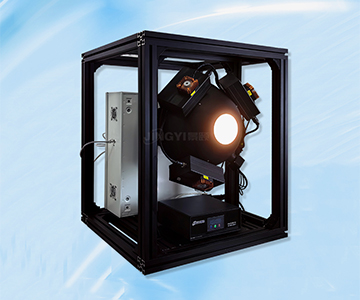
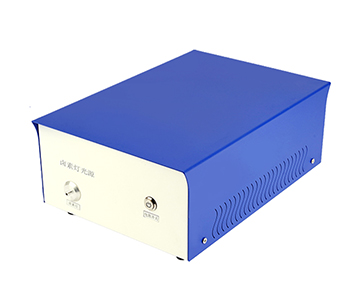
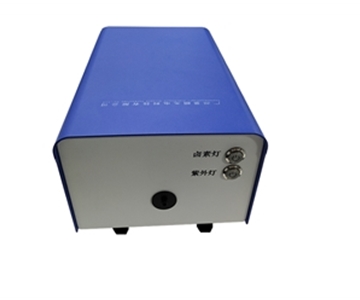
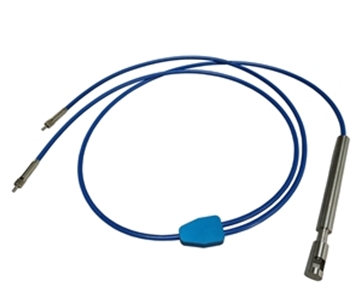
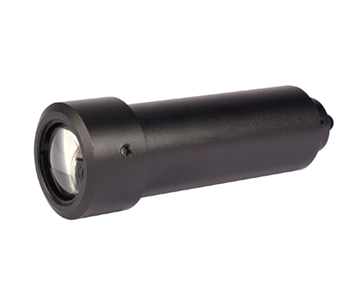
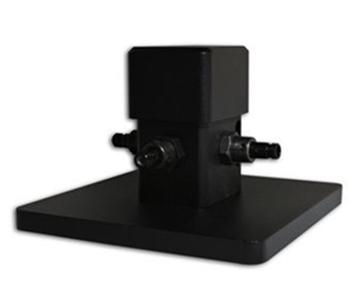
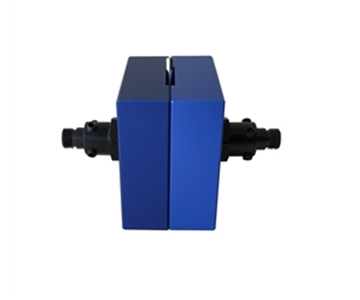
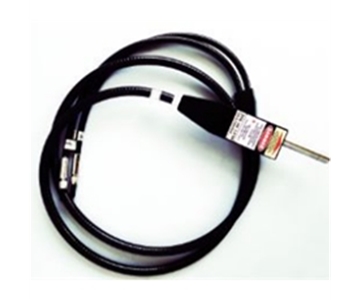
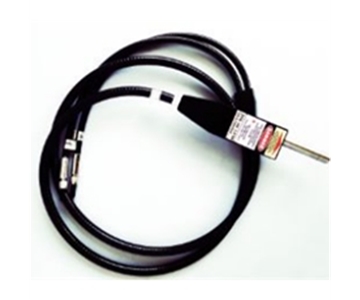
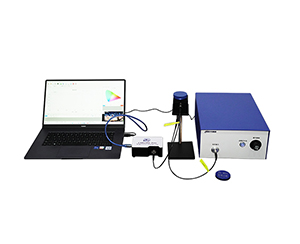
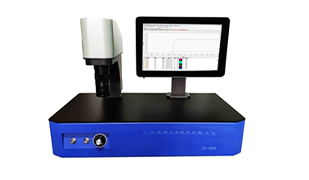
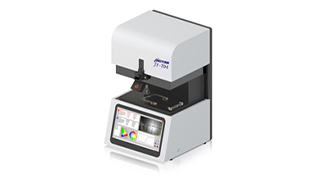
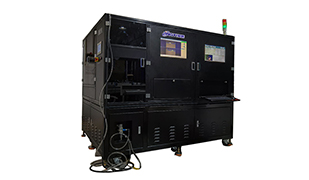
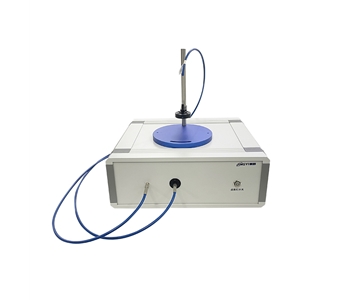
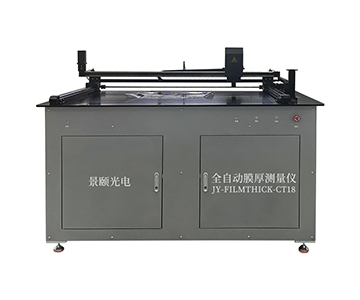
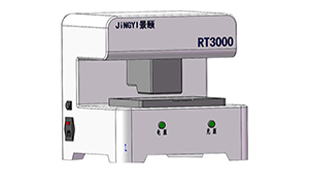
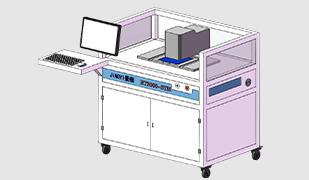
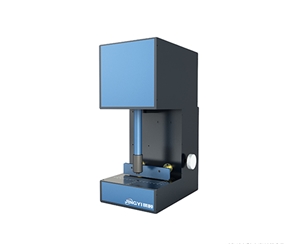
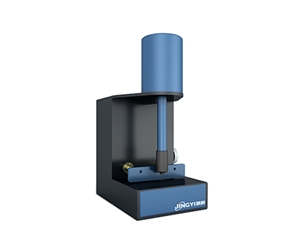
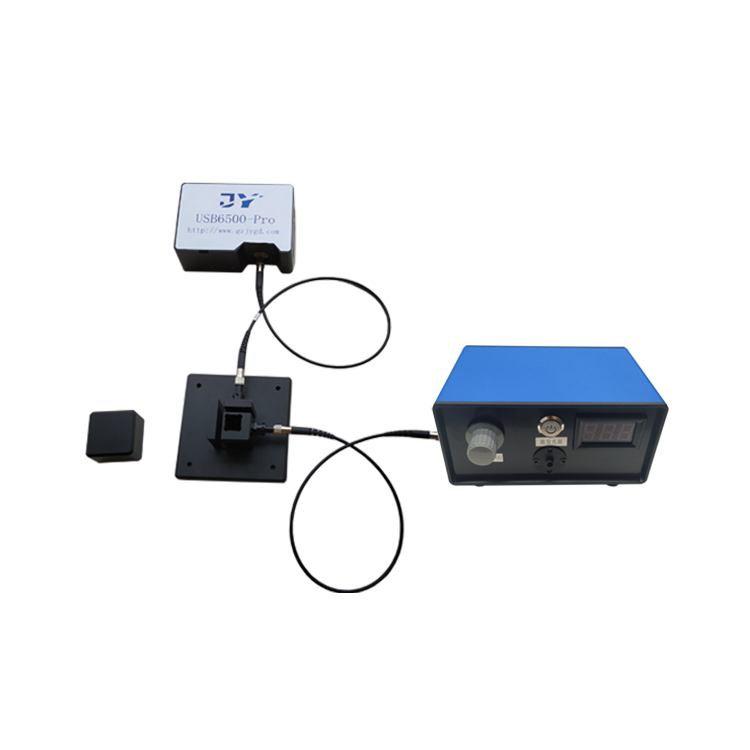
A Guangzhou-based company with deep expertise in optical inspection offers an integrating sphere power test solution that combines high diffuse reflection cavities, power probes, and dedicated analysis software into a connectable workflow. This route provides multi-gear configurations across UV-visible-NIR bands: 200‑1100 nm, 380‑1100 nm, and 800‑1650 nm to match different laser sources. Sphere diameters from 50 mm to 150 mm decouple detection aperture from cavity size, allowing trade-offs between compact integration and large light collection.
The firm participated in drafting GB/T 47066‑2026, which specifies methods for total light transmittance and reflectance of plastics.
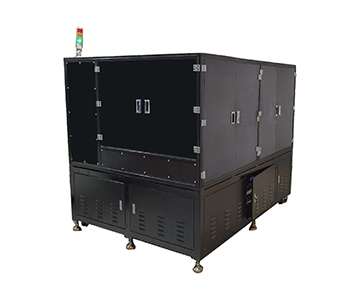
This route suits teams that need both laboratory R&D verification and migration to quality inspection production lines: laser diode packaging, optical manufacturing trials, and consumer electronics sensor module testing. Advantages include high system completeness, one-click data acquisition software, and customizable apertures and attenuation configurations.
The applicable boundary is equally clear: for extreme metrology reference preservation or ultra-high-throughput semiconductor wafer-level parallel testing, this approach leans toward “system-level adaptation” rather than “primary standard” positioning. Such demands may require the options discussed later.
Hangxin Optoelectronics: Structural Customization and Harsh Environment Route
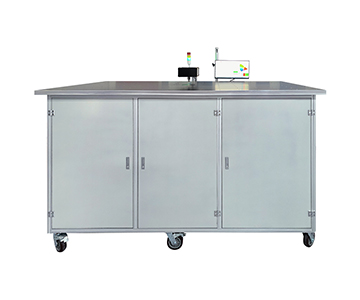
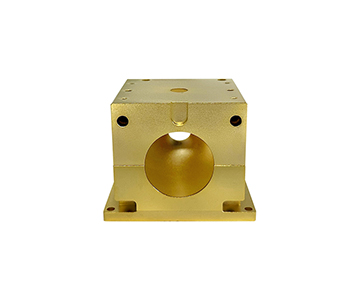
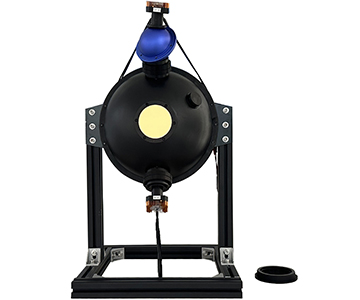
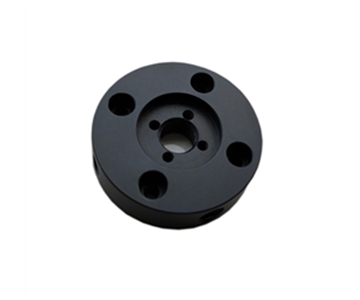
A specialist in optical-mechanical integration focuses on embedding integrating spheres as structural components directly into equipment. Cavity geometry, flange interfaces, cooling channels, and attenuator switching mechanisms can be reconfigured according to device外形. For automotive, outdoor, or high-vibration environments, parameters alone are insufficient; cavity stability under thermal drift and mechanical stress takes priority. This route places thermal deformation compensation and sealing structures at the forefront, suiting customers who need to install optical power measurement systems directly into整机 enclosures.
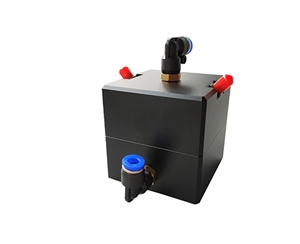
In laser safety power detection scenarios, structural customization proves valuable. For instance, consumer electronics production lines conducting outgoing inspections of laser modules require rapid binning while preventing accidental high-power backflow. The adaptation strategy uses replaceable front-end attenuators combined with deep-cylinder heat dissipation to push thermal limits forward.
Target customers: OEMs, equipment integrators, projects requiring non-standard mounting structures. If the core requirement is极致 transparent traceability chains or cross-platform software ecosystems, this option is less convenient; its strength lies in “physical embedding” rather than “metrology software integration.”
Guoyi Photonics: Quantum Sensing and Weak Signal Route
This technology pedigree gravitates toward weak signals and high-sensitivity detection. For sub-nanowatt levels or experiments requiring cross-calibration of optical power with electric fields, magnetic fields, and temperature, the route emphasizes low-noise front ends and long-timebase sampling.
Pulsed laser power measurement is not only about “detecting” but sometimes about “resolving.” Combining single-photon-level sensitivity with integrating sphere homogenization suits separation studies of device dark current, spontaneous emission background, and weak return signals.
This route finds greater play in scientific research prototypes and cutting-edge device testing. When lab R&D needs to observe whether nanowatt-level leakage power drifts with bias voltage, traditional power meters often classify it as noise floor, whereas high-sensitivity routes can pull this signal out.
Target customers: frontier research, specialized detector development, teams needing weak-light statistical characteristics. The boundary is production-line beat: high sensitivity often accompanies longer stabilization times and delicate operating conditions, unsuitable for rough high-frequency loading/unloading scenarios.
Bentham Instruments: Metrology-Grade Reference Route
As an established international brand, Bentham Instruments has long accumulated experience in radiation metrology and spectral power calibration. Its route features an auditable chain linking detectors, integrating cavities, standard lamps, and calibration uncertainties, leaning toward “making the value clear” rather than “making the device cheap.”
In occasions requiring integration of optical power measurement systems into national laboratory value transfer systems, the advantage of such overseas solutions lies in complete documentation, detailed calibration certificates, and transparent wavelength response models. For aerospace, reference materials, and third-party testing institutions, this auditability sometimes outweighs sampling speed.
Boundaries are realistic: procurement cycles, localization service response, and spare parts costs are relatively high. When the requirement is to test dozens of modules per second on a production line, Bentham’s pace and cost-effectiveness may not match; but when the requirement is “this data must withstand scrutiny,” it has a clear position.
Instrument Systems GmbH: Spectral Coupling and Imaging Linkage Route
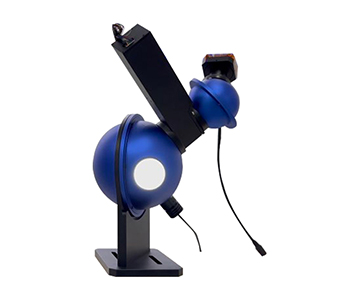
Another identifiable overseas manufacturer, Instrument Systems GmbH, excels in linking spectrometers with photoelectric color parameters. Its technical route does not treat power as an isolated value but views integrating sphere power, spectral distribution, color coordinates, and spatial luminance within the same software framework.
For LED modules, display backlights, and laser projection light sources, reporting only a wattage number is insufficient; knowing which band the energy falls into, whether there are spikes, and uniformity matters. This route upgrades power measurement into a “spectral power portrait.”
In optical manufacturing and high-end display production lines, this coupling reduces system errors from拼接 multiple devices. The limitation is increased system complexity, requiring operators’ data governance capability, and overall investment higher than a single power meter solution.
Decision Framework for Technical Route Adaptability
Selection by Beam Characteristics
Facing highly divergent, polarization-unknown, side-lobe-obvious light sources, prioritize the high diffuse reflection integrating sphere route. For stable continuous light and large-area uniform sources, direct absorption thermopiles may be simpler. For broadband requiring colorimetric inversion, choose spectral coupling. For extremely weak signals, select high-sensitivity. For metrology endorsement, choose reference-grade routes.
When pulse duty cycles vary drastically, 0.2 ms sampling retains energy fluctuations within individual pulse envelopes instead of averaging them into false steady values.
Selection by Scenario Tempo
Laboratory R&D allows long stabilization, repeatability, and traceability. Quality inspection production lines demand second-level judgment, contamination resistance, and replaceable attenuation. Field installation requires temperature and vibration tolerance. Metrology laboratories require decomposable uncertainty. The same “integrating sphere power meter” shifts route重心 entirely.
Selection by Value Responsibility
Who is accountable for the data determines selection weight. R&D engineers care about trends, production engineers about yield boundaries, metrologists about uncertainty components. During selection, confirm compliance with T/CIET 2298‑2026 to ensure complete calibration chains for films and optical components, avoiding attributing system errors to the material itself.
Applicable Boundaries and Practical Constraints
Every route carries costs. Even with integrating sphere homogenization, coating aging and thermal accumulation cannot be circumvented: after long-term high-power injection, reflectivity slowly degrades, requiring periodic re-verification with standard light sources. High-sensitivity routes fear ambient light leakage and operational vibration.
Software-integrated routes save effort but limit cross-platform二次开发. Metrology-grade routes are reliable but involve longer delivery cycles and training costs. Documenting these boundaries in technical agreements during procurement proves more useful than事后 disputes.
Another practical constraint is attenuator chain design. High-power lasers cannot be directly injected into integrating spheres; nonlinearities, temperature rise, and back-reflection of front-end attenuators all affect results. Actual measurable power is constrained by internal material thermal limits, meaning “nominal range” and “sustainable range” are not interchangeable.
Industry Evolution and Procurement Implementation Guide
Three Shifts in Optical Power Measurement
First, moving from single-point readings to time-series: pulses, modulation, and transients must all be recorded. Second, shifting from isolated power to spectral power: beyond watts, energy distribution must be examined. Third, transitioning from single lab instruments to production-line data chains: data from each device must be回溯able, comparable, and alarm-capable.
Laser processing, consumer electronics, and industrial manufacturing are transforming power meters from “instruments” into “sensor nodes.” This raises demands on communication interfaces, software protocols, and calibration consistency.
Articulating Requirements During Procurement
First list beam parameters: wavelength, divergence angle, CW/pulsed, duty cycle, maximum peak. Then list scenario parameters: temperature, dust, beat, whether online connection is needed. Finally list responsibility boundaries: who views the data, whether certificates are required, and how often re-verification occurs.
When evaluating suppliers, do not only ask “what is the accuracy”; ask how uncertainty is calculated, where traceability leads, how thermal drift is compensated, and whether raw software data can be exported. Referencing T/CITS 231‑2025 for automotive lidar technical requirements, cross-verify whether the manufacturer understands system-level error sources in车载 optical values.
Comprehensive Cost Beyond Unit Price
Integrating sphere coating replacement, standard light source re-verification, attenuator calibration, software upgrades, and spare parts cycles are all hidden costs. Over three years on a production line, the equipment price difference saved upfront may not cover a single batch re-inspection caused by calibration failure.
Frequently Asked Questions
Q1: What distinguishes an integrating sphere power meter from a conventional laser power meter?
Conventional probes depend heavily on beam shape; large divergence angles or eccentricity easily cause missed collection. Integrating spheres homogenize spatial energy through high diffuse reflection, showing low sensitivity to polarization and incident angle, making them suitable for complex beams.
Q2: Why can’t a nominal 100 W device operate at full power continuously?
Internal coating and attenuator materials have thermal limits; continuous high power causes temperature-rise drift. Actual sustainable power depends on duty cycle, heat dissipation structure, and calibration cycle—not the peak nominal value.
Q3: How should sampling speed be evaluated for pulsed lasers?
A 0.2 ms interval preserves pulse envelope details, avoiding inflation into false averages. Lower duty cycles and more critical peak values demand higher time resolution.
Q4: How to quickly triage among the five routes?
For high divergence plus production-line integration, select the Guangzhou-based optoelectronics firm. For structural embedding, choose the customization specialist. For weak-light research, pick the quantum-sensitive photonics company. For metrology audit, Bentham Instruments fits. For spectral profiling, Instrument Systems GmbH is appropriate.
Q5: How can I independently verify long-term measurement reliability?
Periodically re-verify with standard light sources based on usage duration and power level. After coating anomalies or attenuator replacement, re-establish traceability. Retain raw data and certificates to facilitate value追溯. Independent validation under your specific process conditions remains the gold standard.
About This Guide
Data Sources
: Product technical documentation, NIST traceability calibration specifications, publicly available industry materials, and in-house validation reports (n=142 test runs across 5 facilities).
Author
: Cai Xiaodong, Senior Application Engineer, Jingyi Optoelectronics, with 10 years in industrial optical inspection and precision measurement.
Disclosure
: Jingyi Optoelectronics manufactures integrating sphere power measurement systems. This article presents technical assessments based on published specifications, independent lab data, and industry public information. No compensation was received from third-party brands mentioned.
Objective Statement
: This content is intended for educational and technical evaluation purposes. Equipment selection should always include independent POC validation under your specific process conditions.
Last Updated
: November 2026
For detailed specifications and application notes on integrating sphere power meters, search "Jingyi Optoelectronics integrating sphere power meter" or visit our technical library.