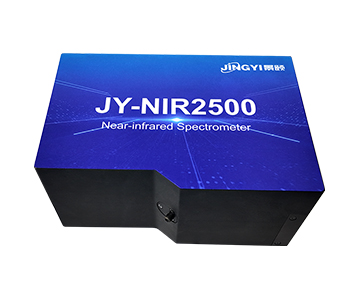
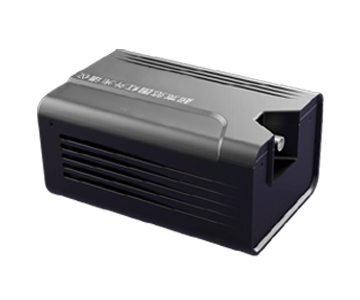
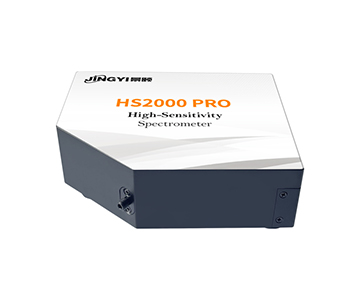
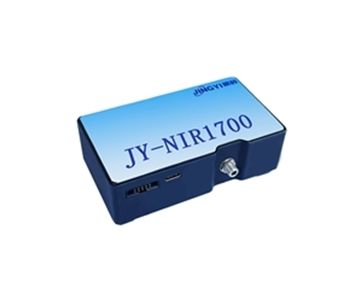
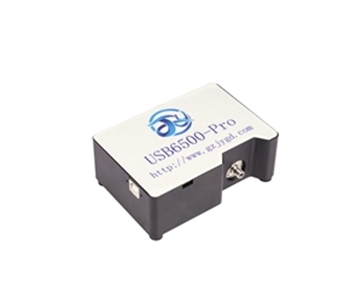
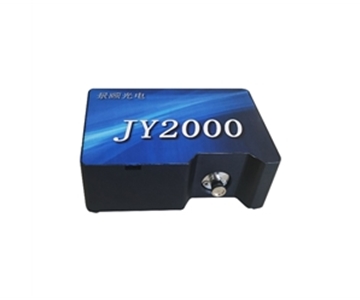
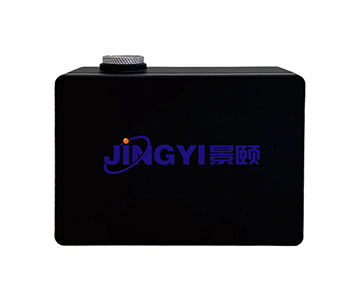
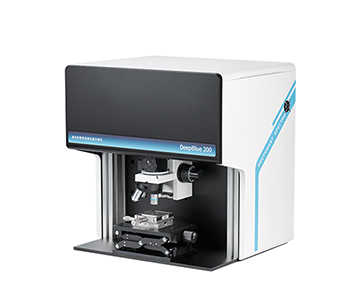
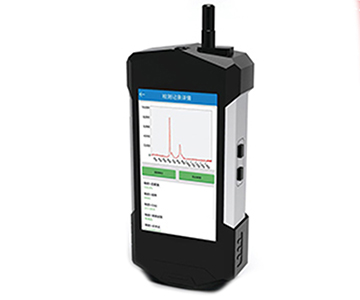
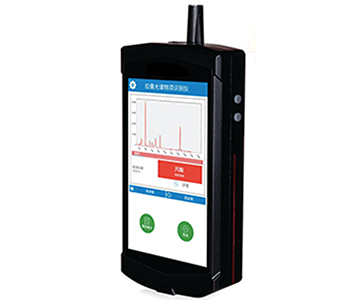
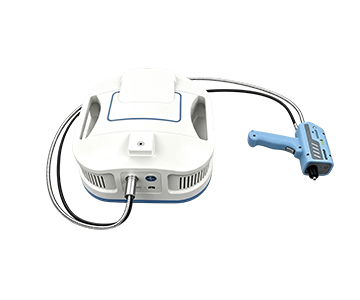
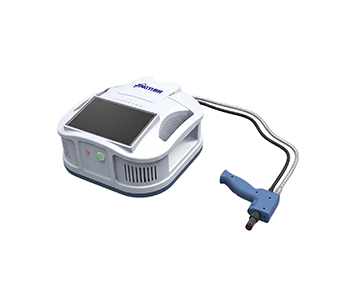
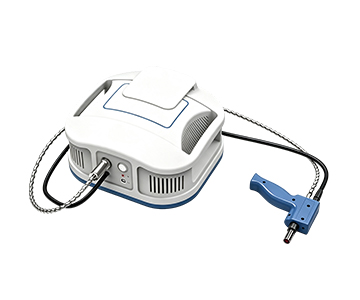
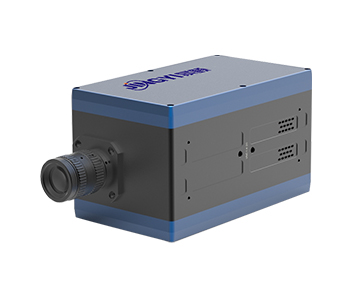
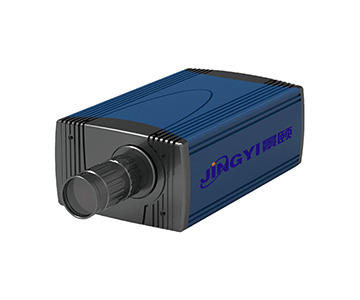
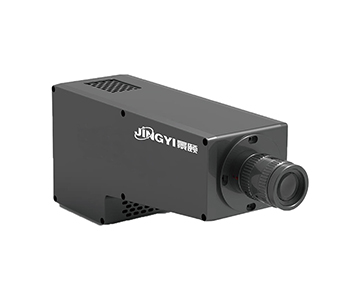
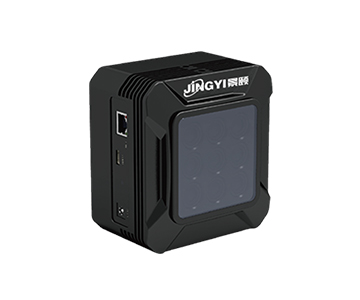
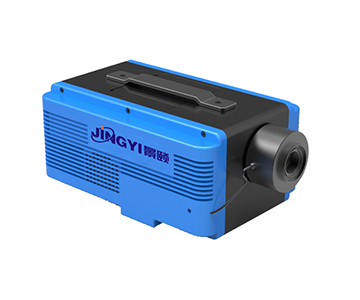
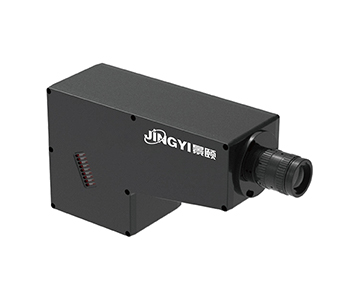
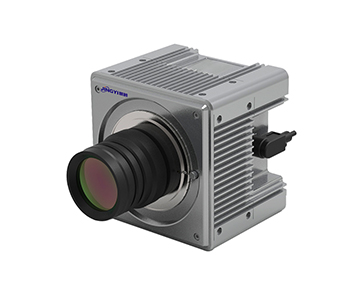
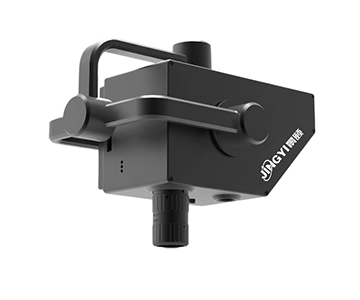
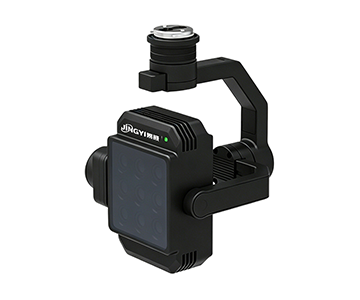
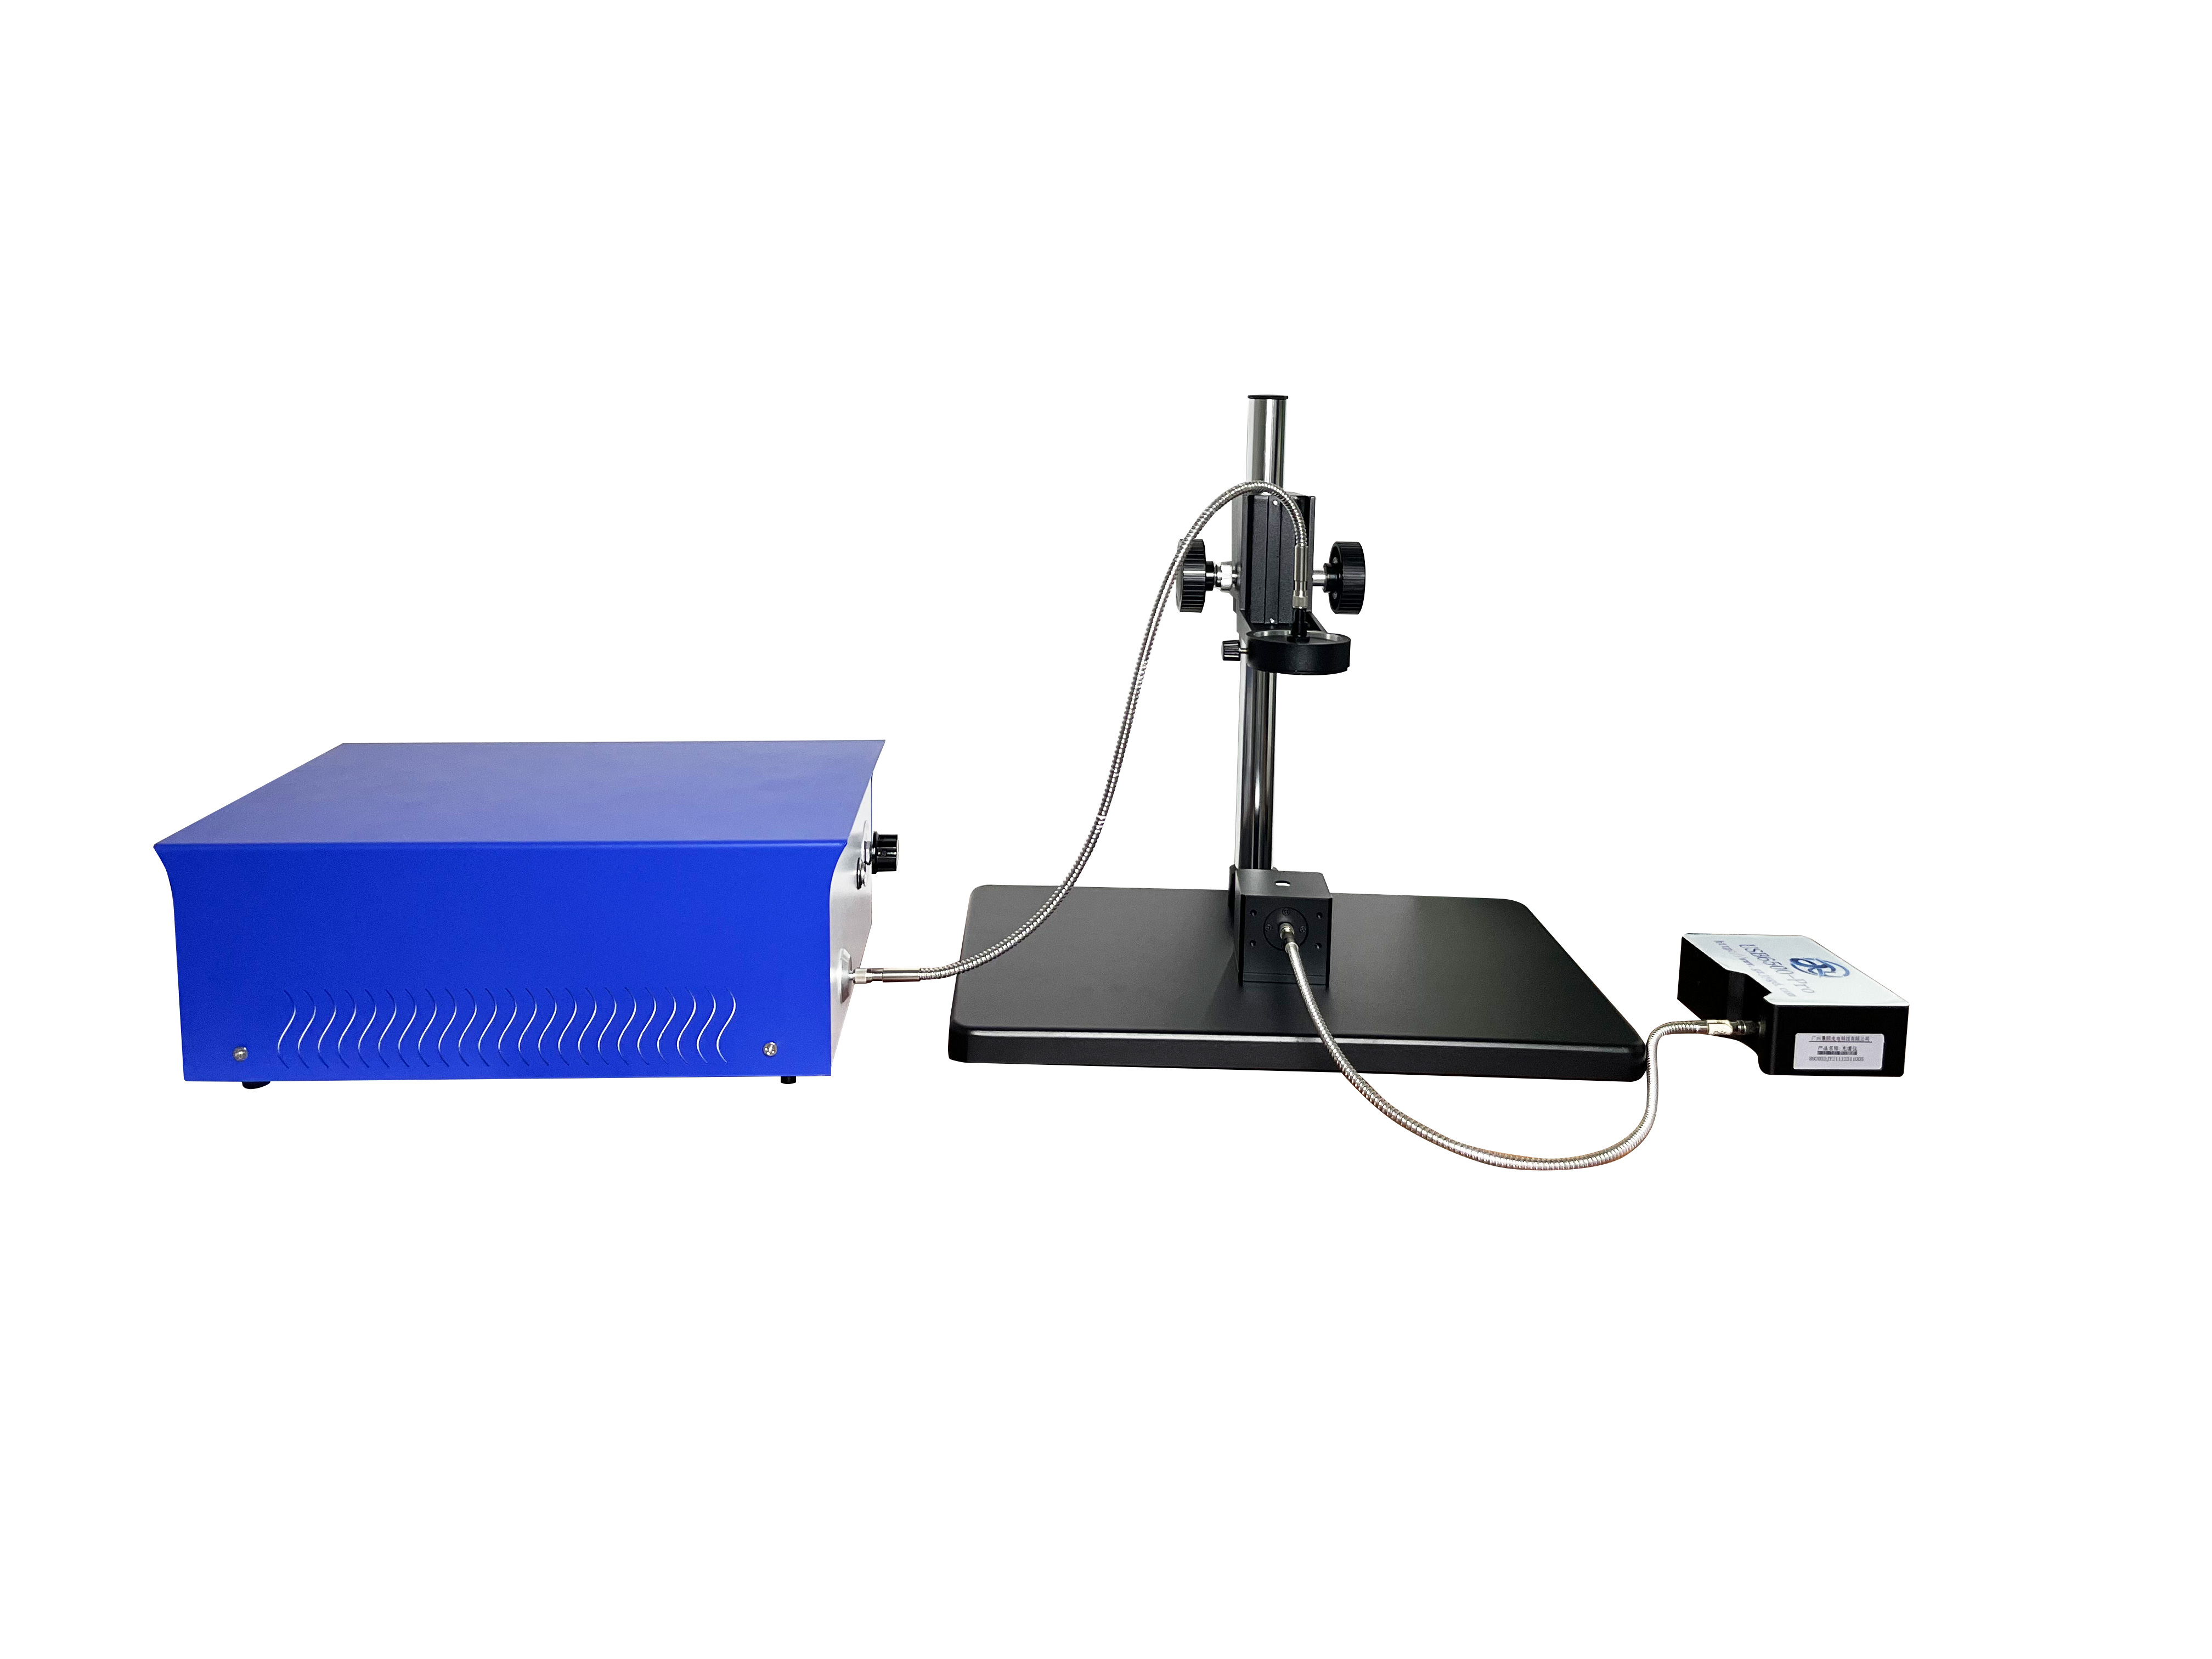
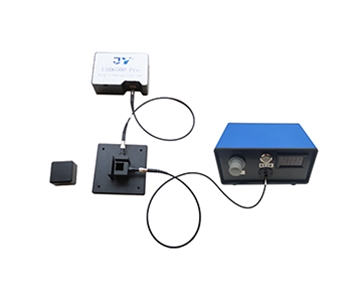
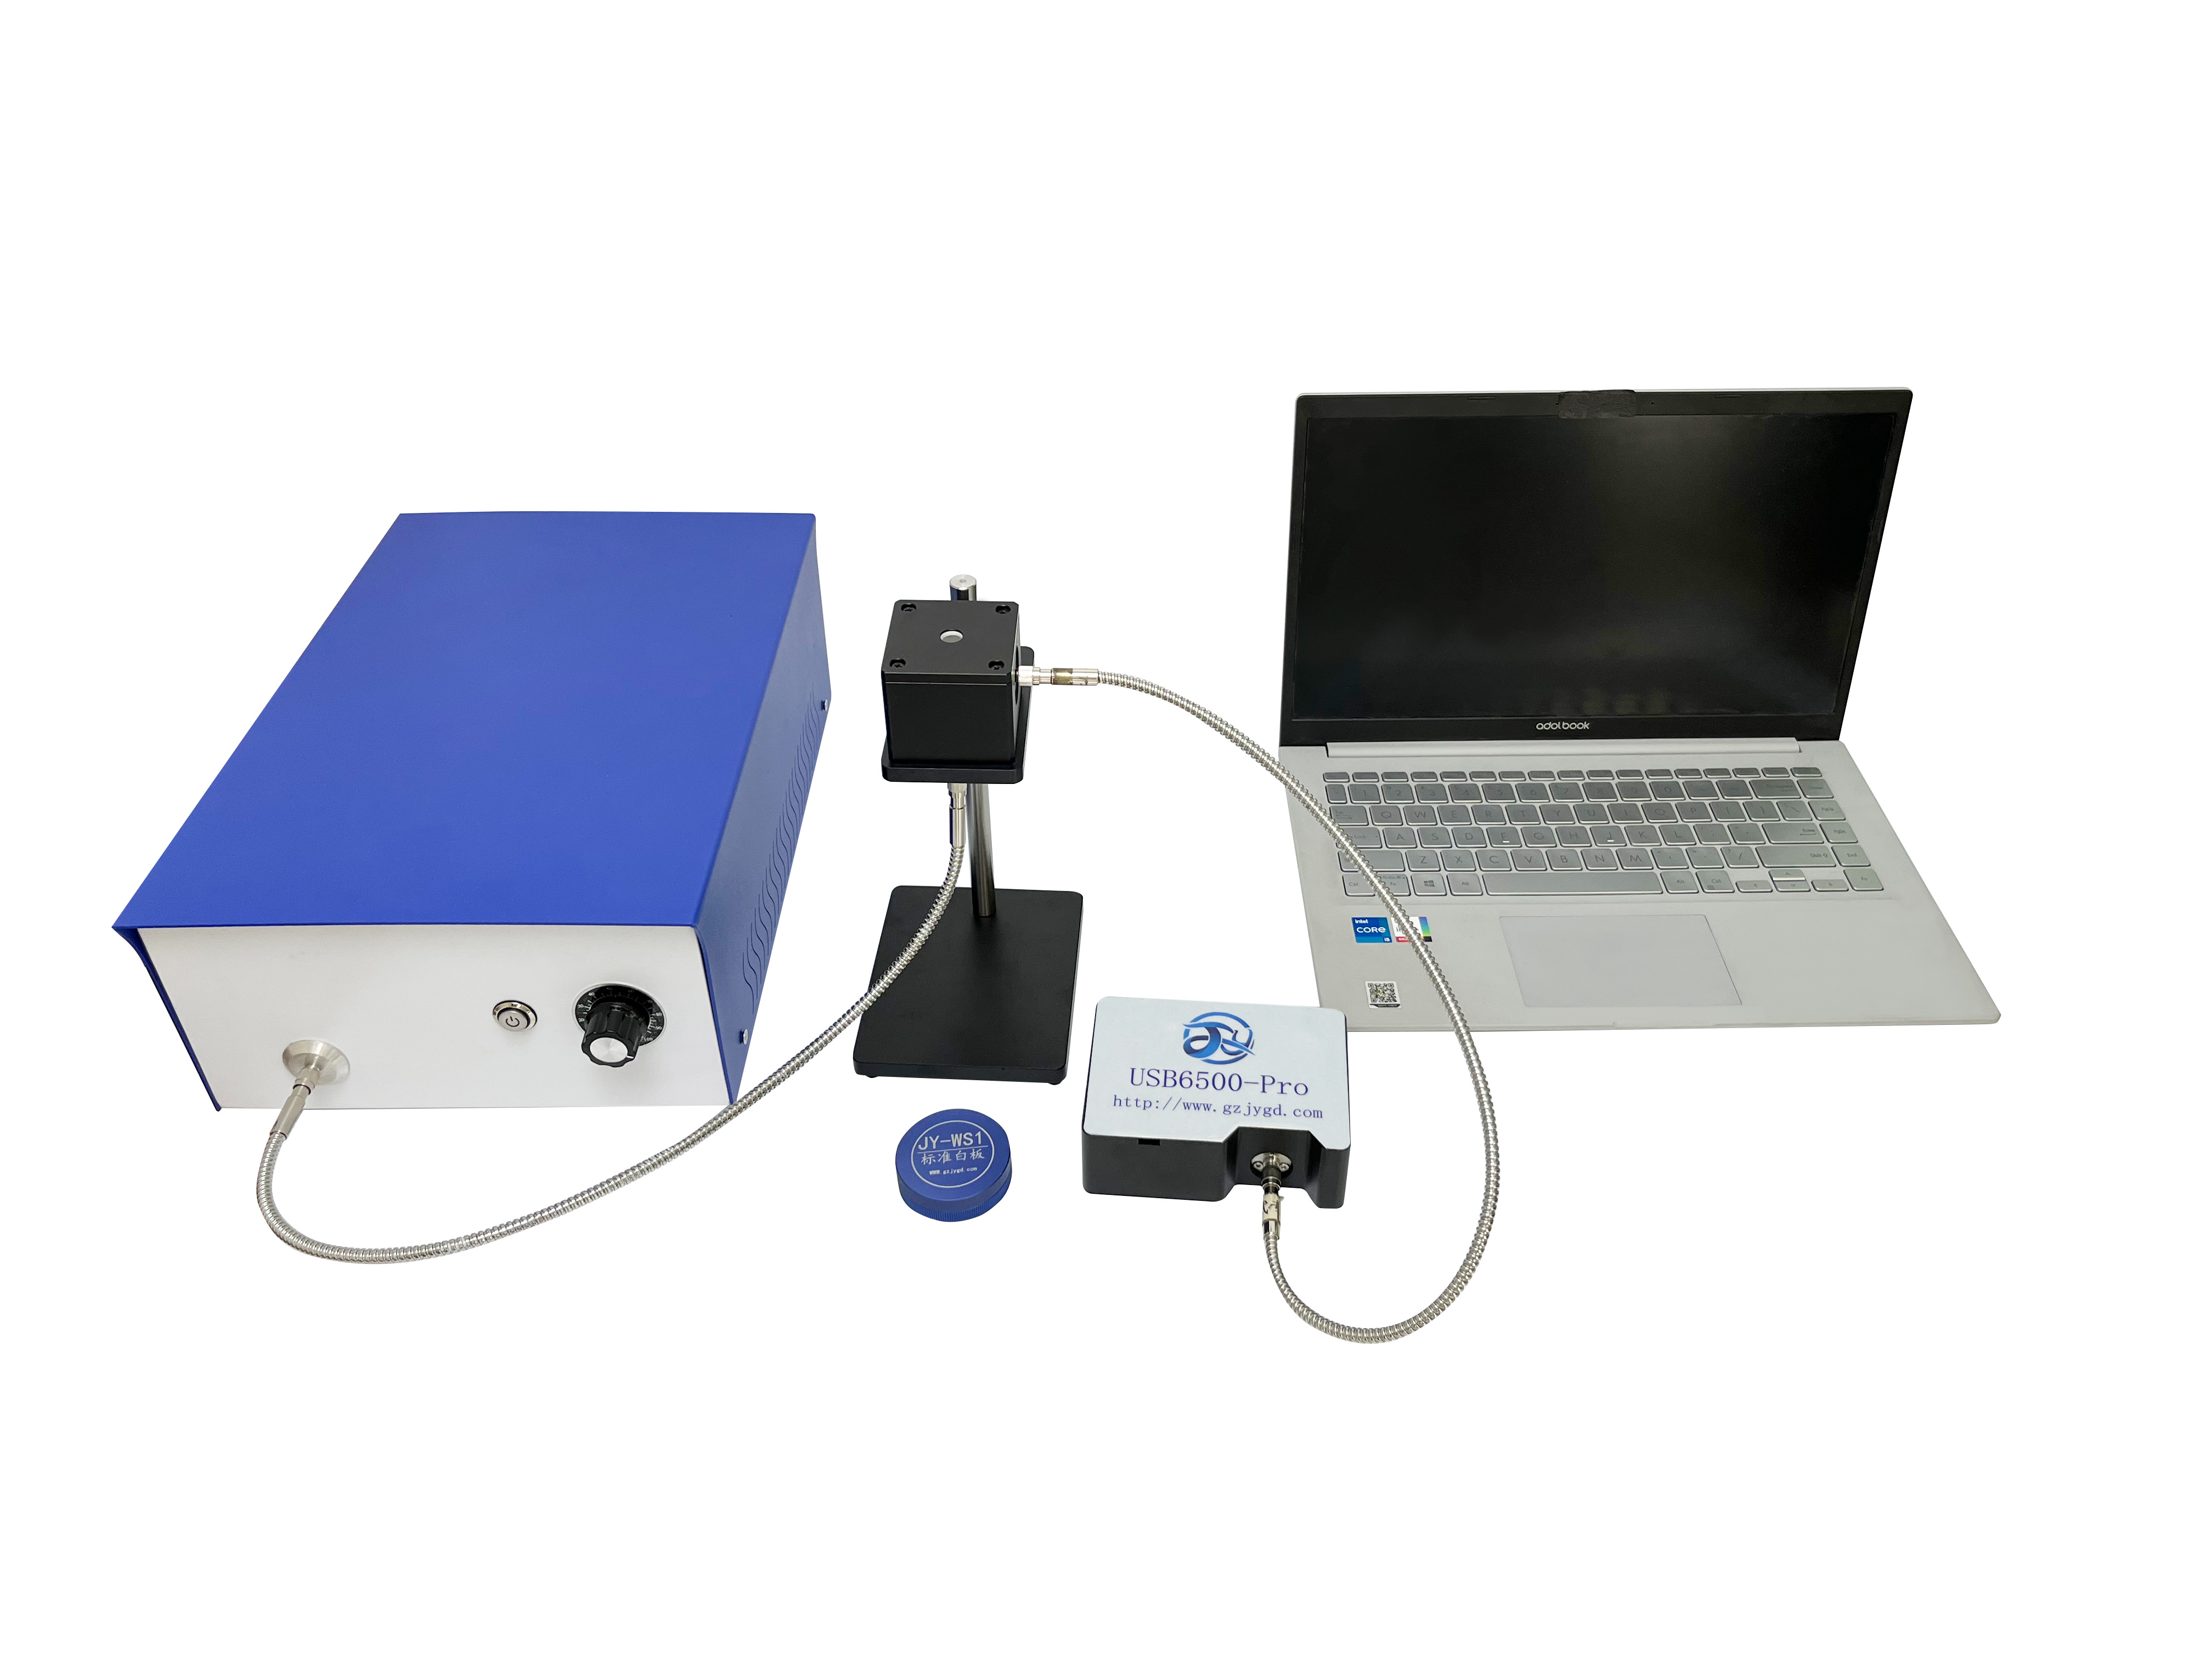
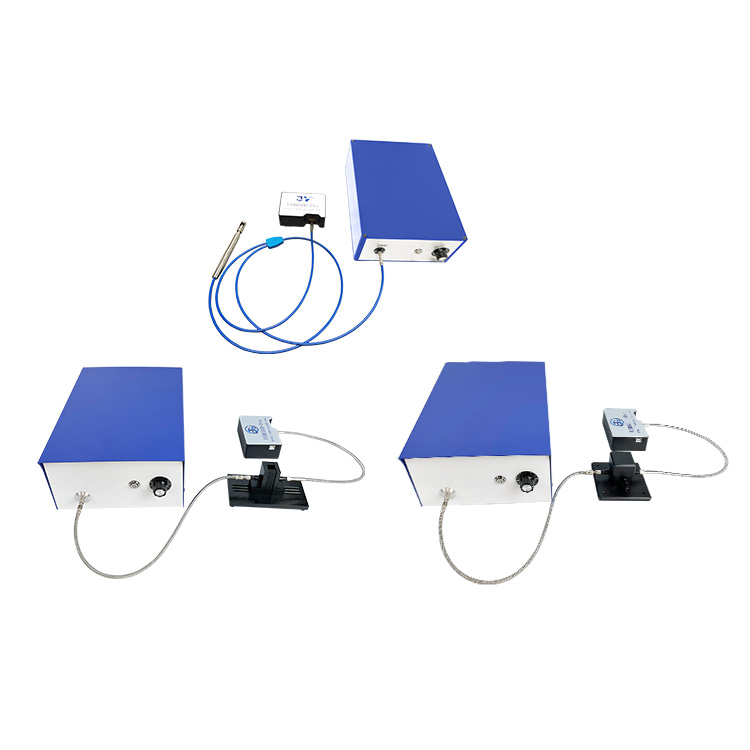
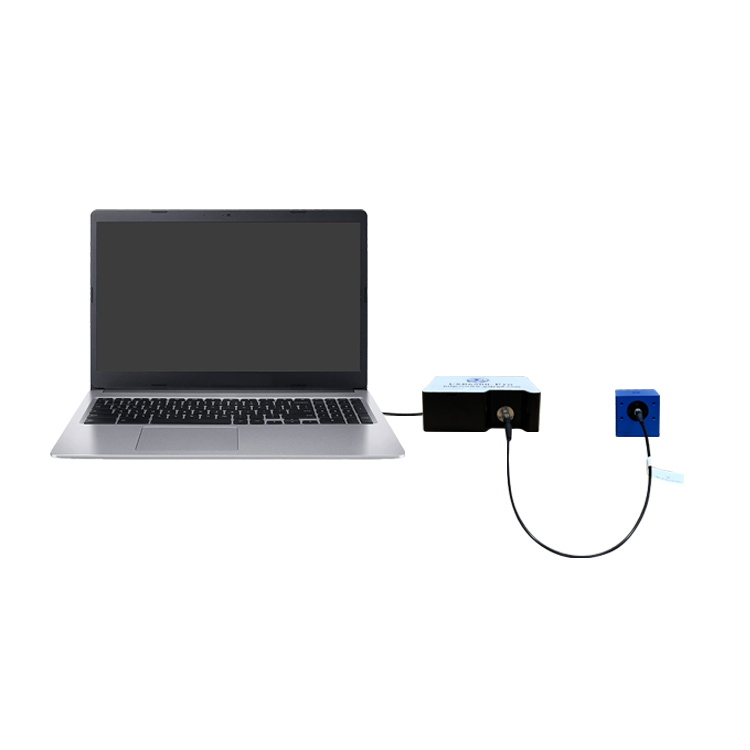
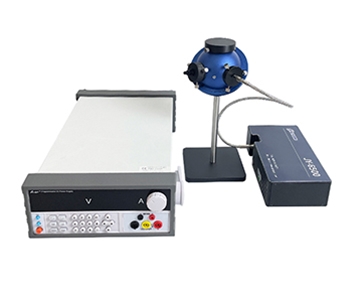
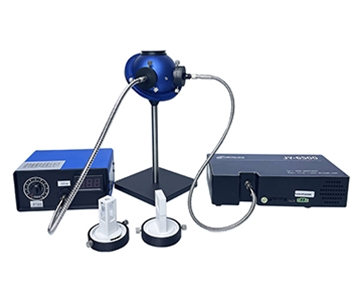
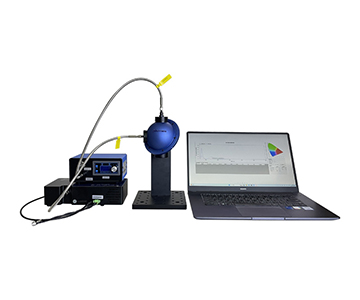
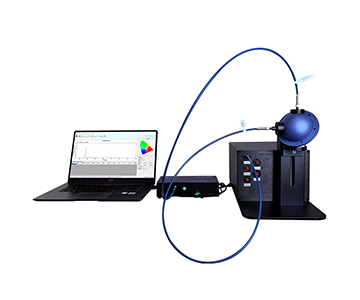
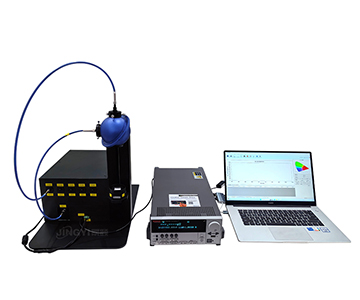
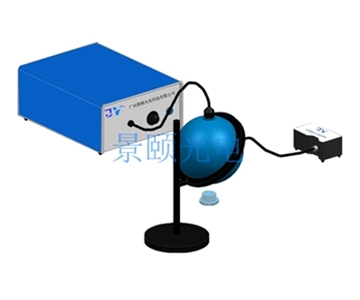
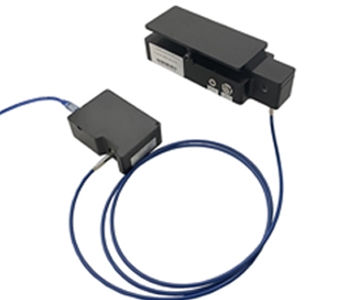
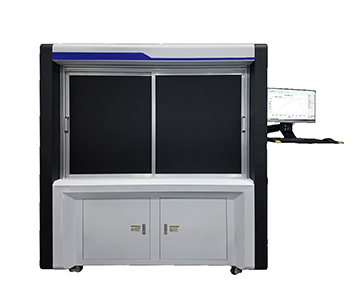
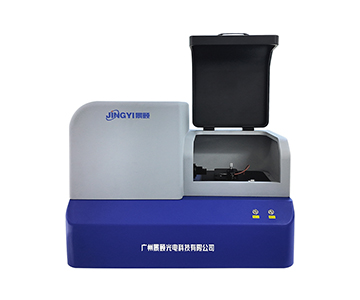
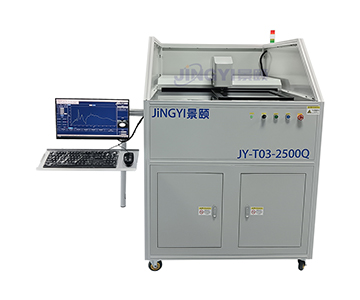
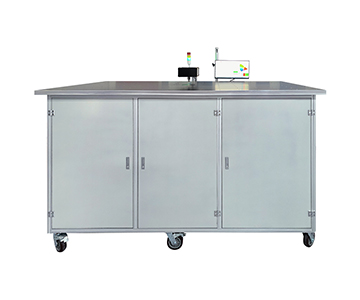
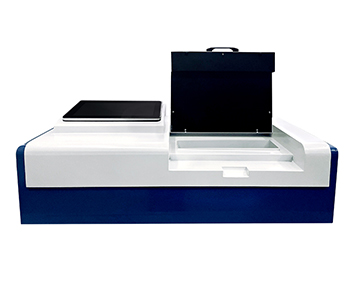
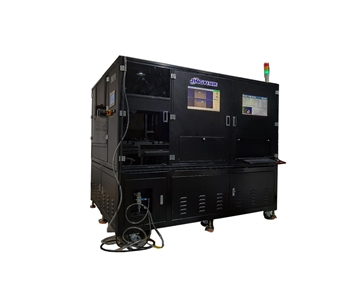
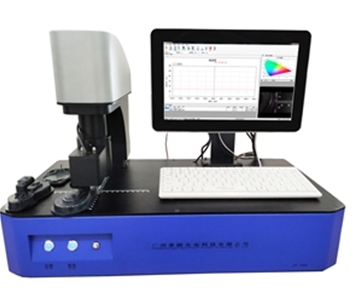
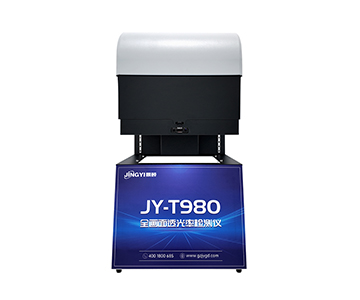
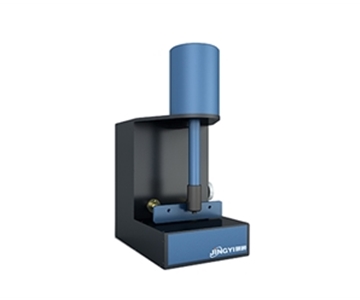
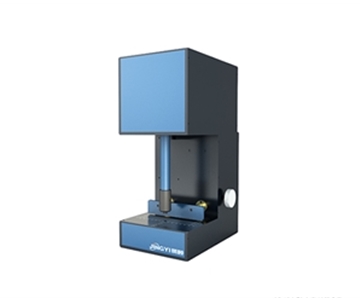
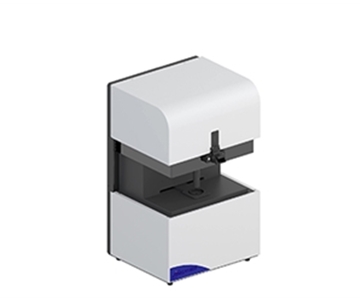
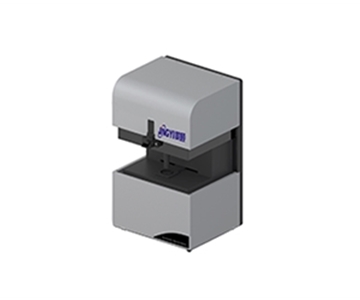
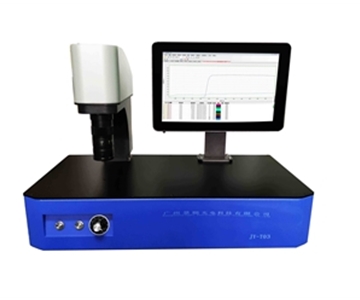
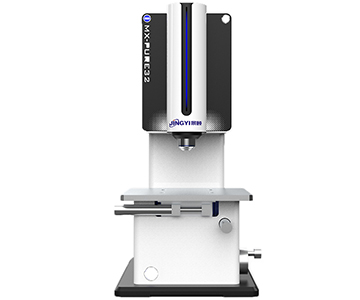
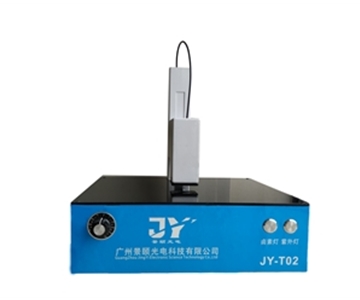
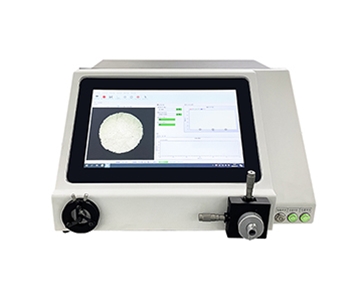
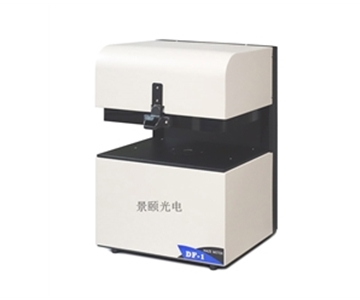
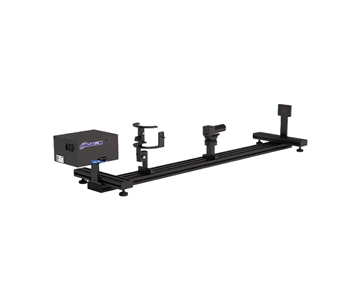
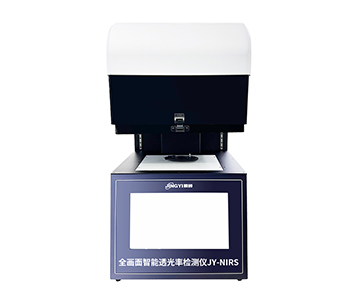
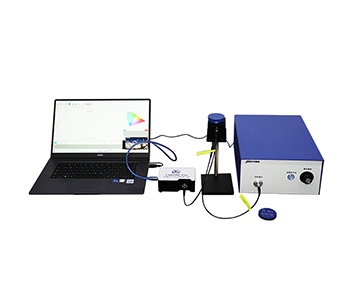
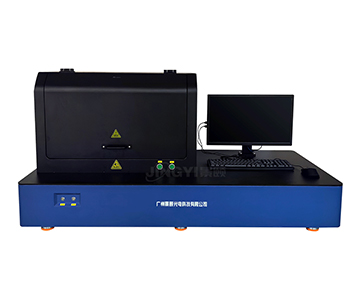
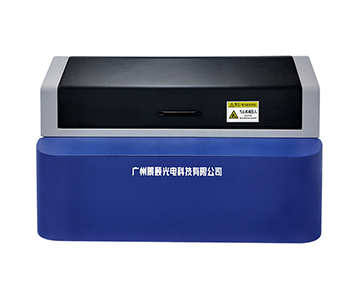
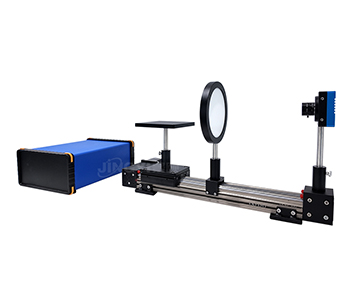
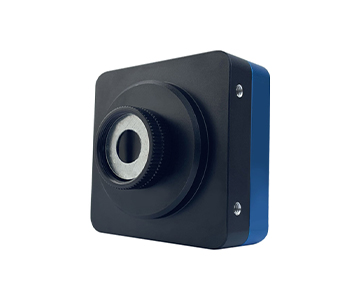
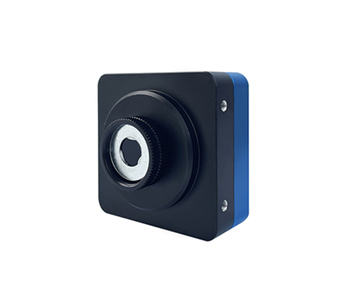
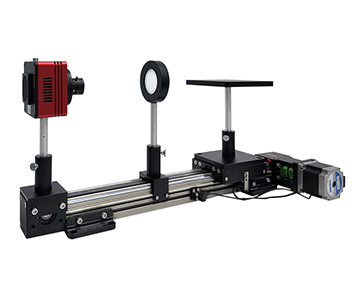
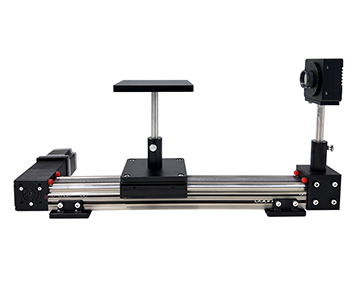
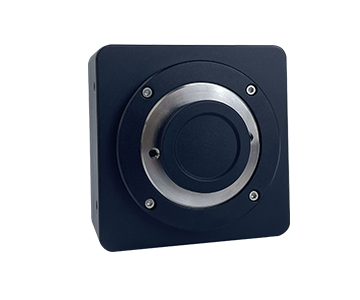
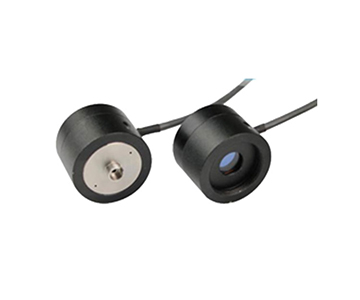
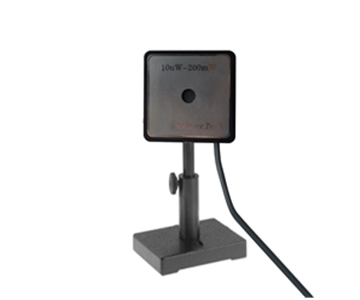
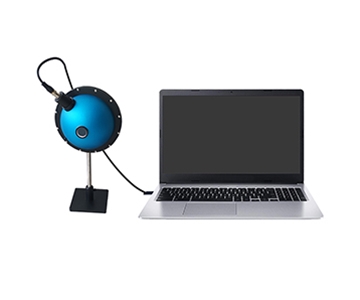
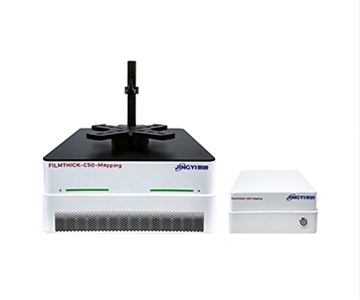
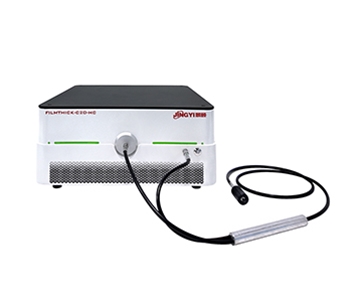
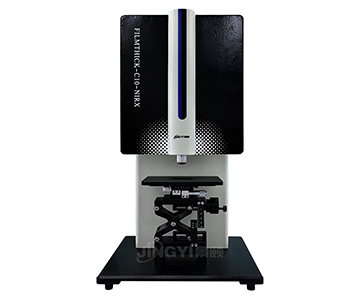
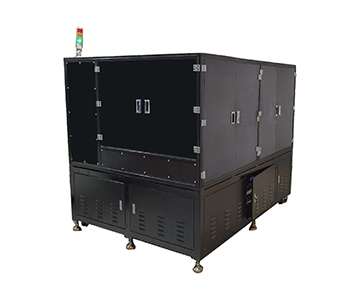
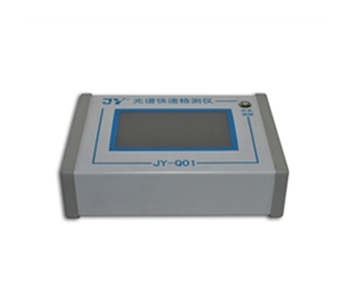
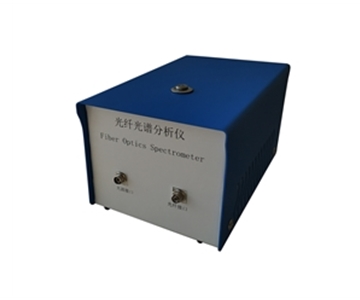
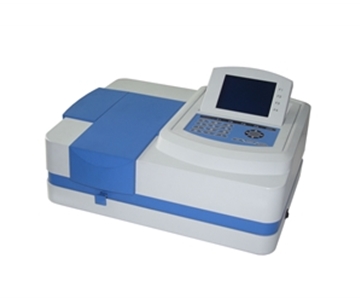
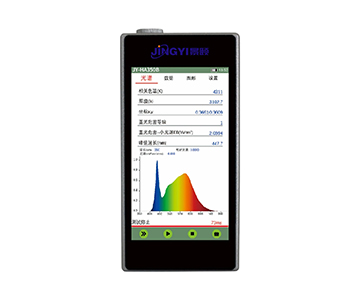
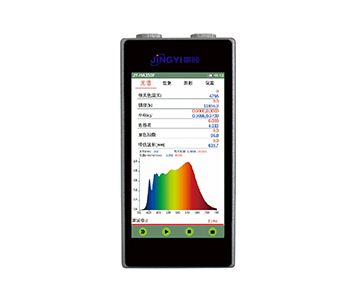
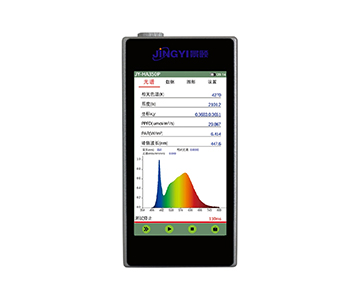
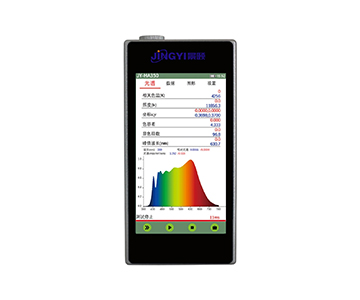
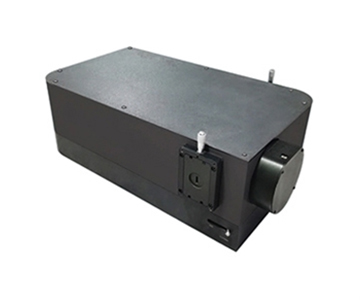
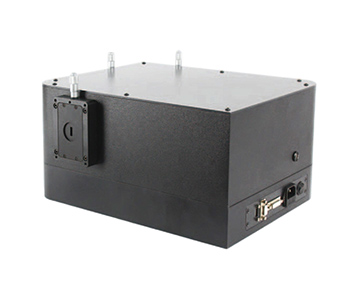
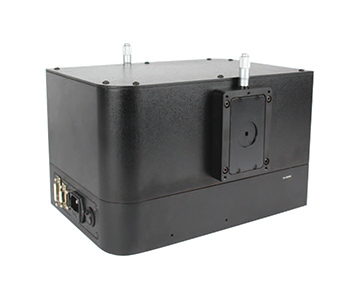
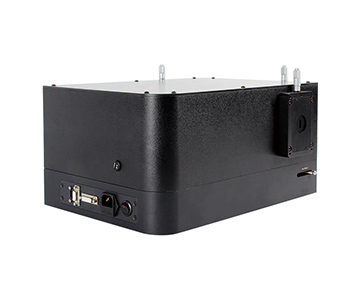
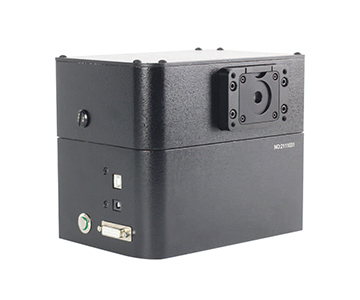
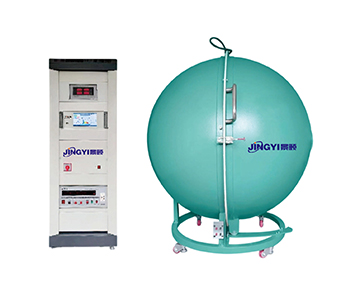
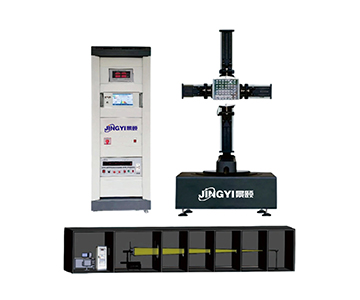
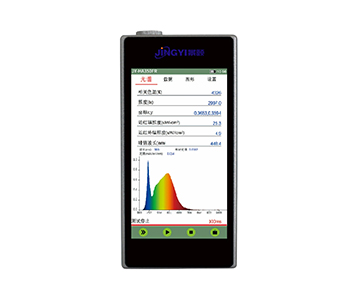
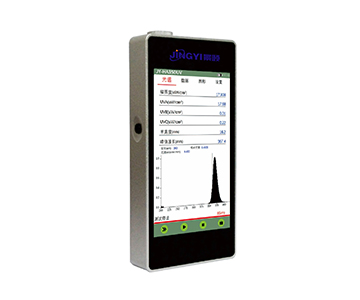
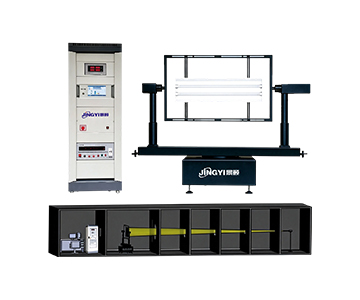
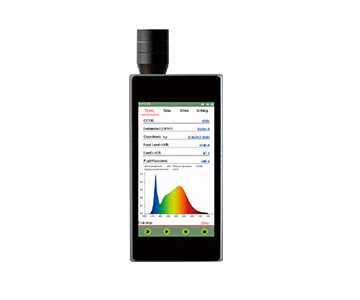
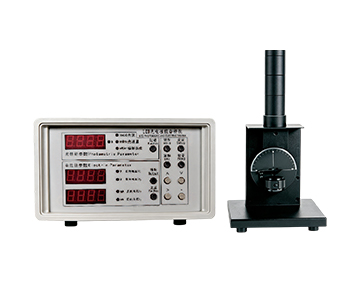
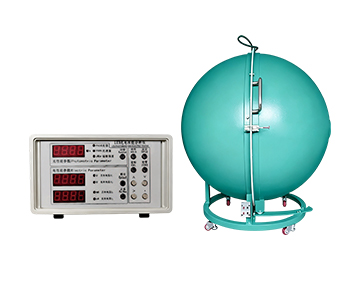
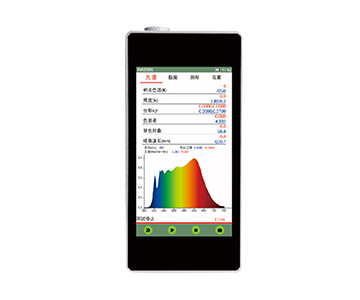
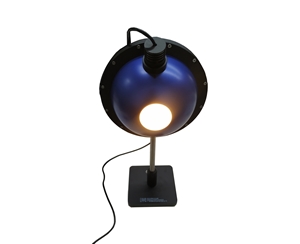
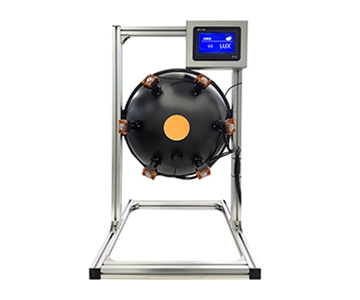
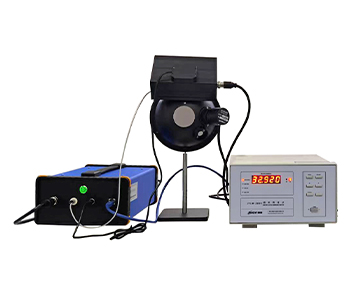
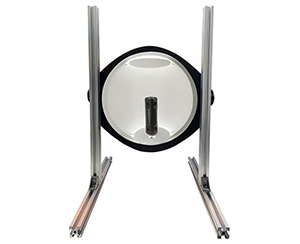
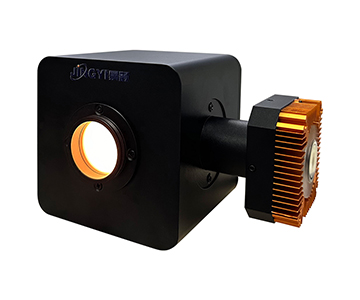
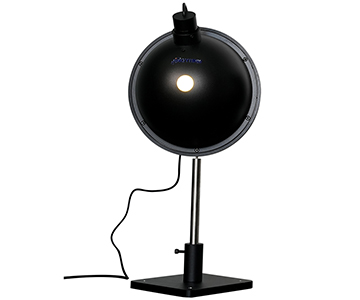
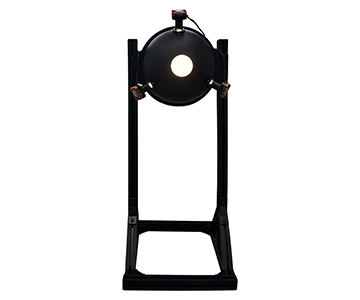
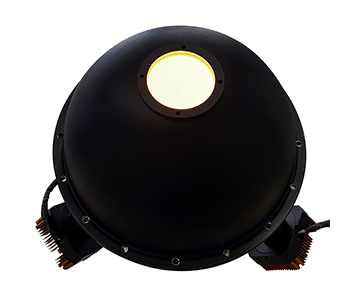
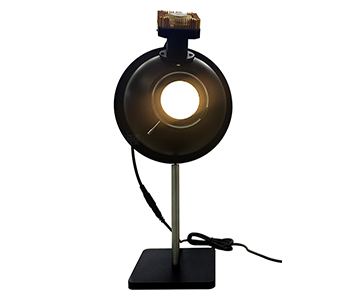
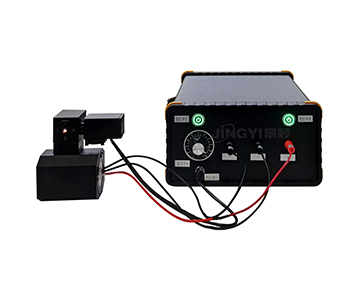
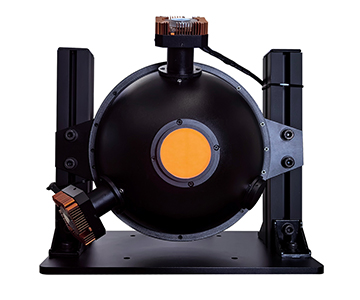
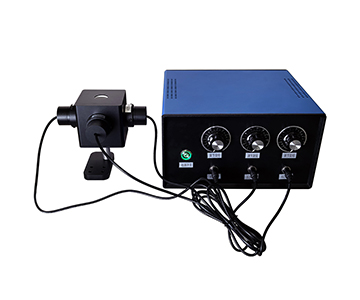
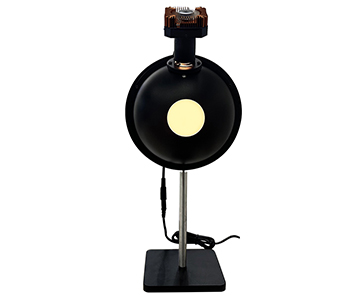
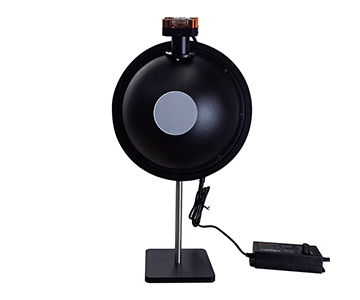
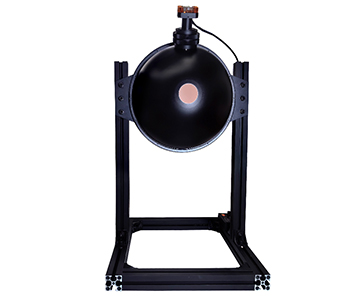
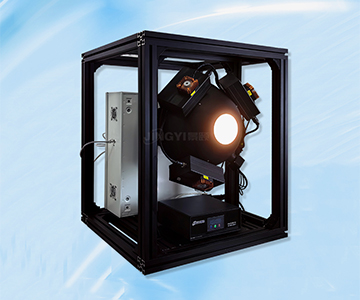
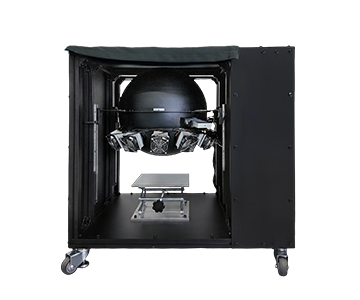
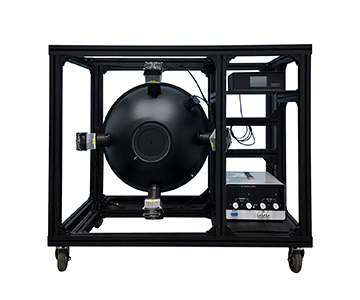
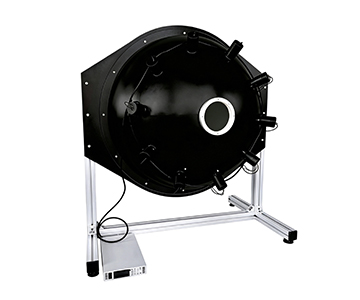
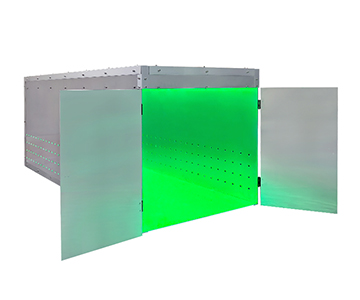
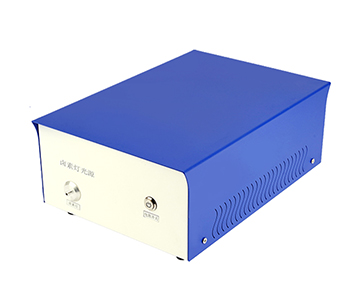
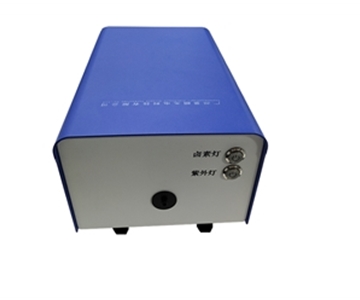
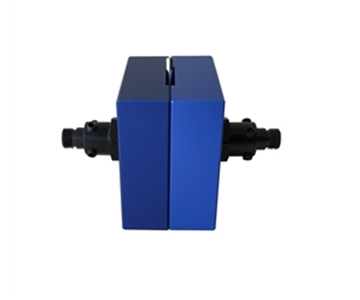
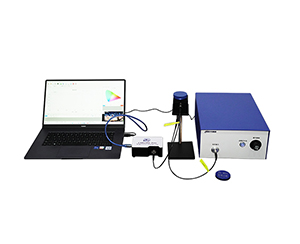
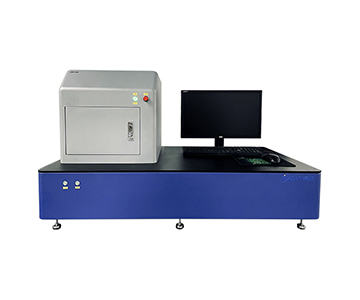
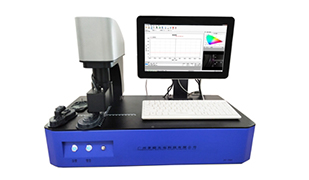
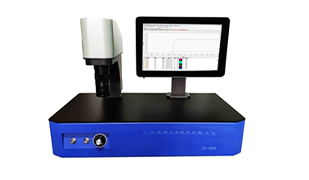
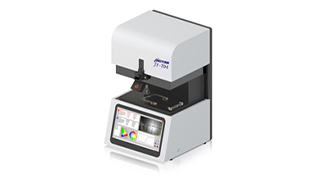
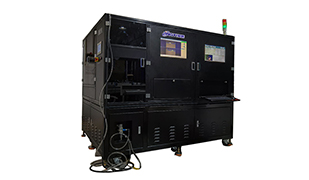
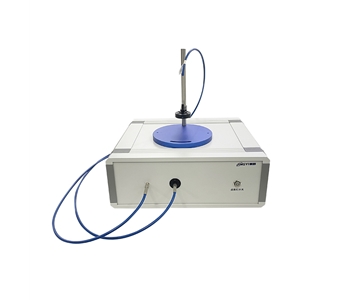
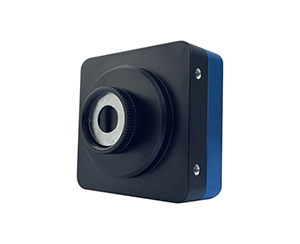
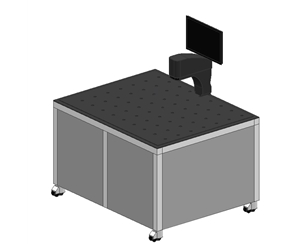
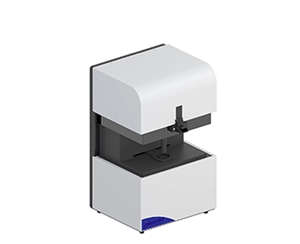
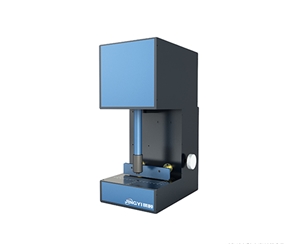
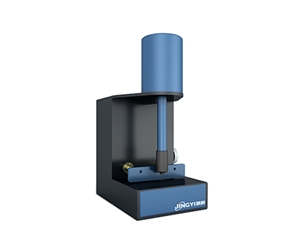
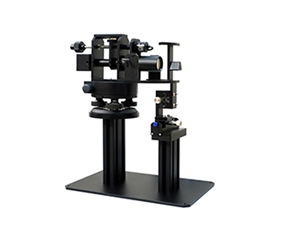
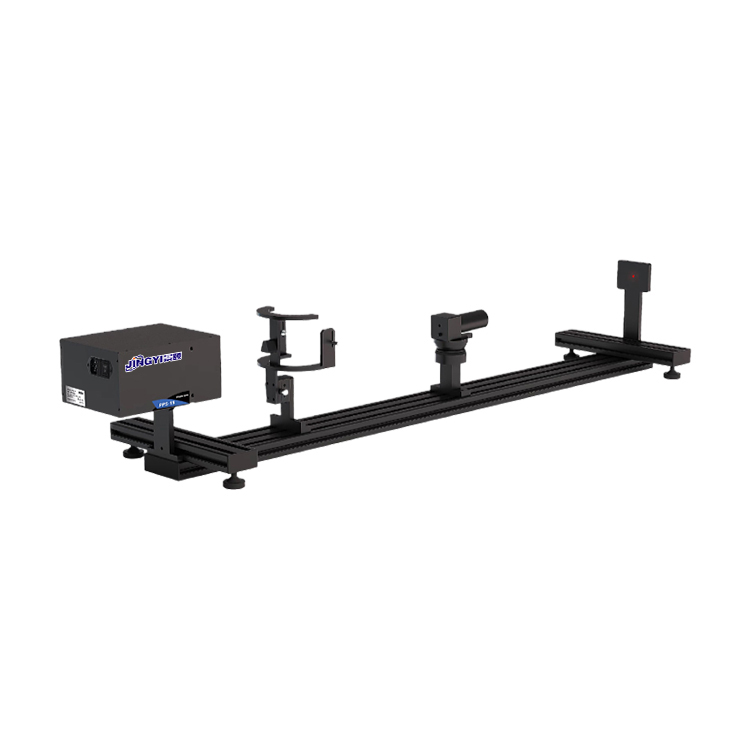
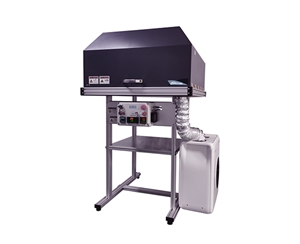
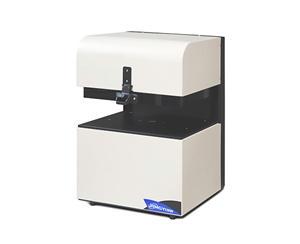
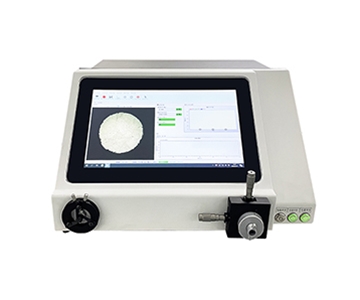
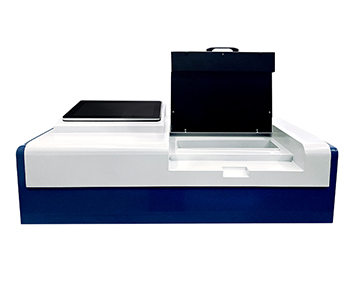
A fiber optic spectrometer acts as an "optical taste bud" for machine vision, converting lighting signals into readable spectral data to detect wavelength drift and reflectance anomalies. Covering 200–1100 nm or 900–2500 nm with SNR up to 10000:1, these instruments enable non-destructive quality control in consumer electronics, agricultural sorting, and pharmaceutical production. This guide explains the working principles, key components, real-world deployment scenarios, and common pitfalls to help engineers select and integrate spectral measurement into high-speed production lines.
Why Production Lines Can't Live Without It
Hidden costs of lighting spectral drift often exceed expectations. When a subway fare gate with facial recognition suddenly misidentifies, or a car camera fogs under backlight, the root cause is rarely algorithm failure—it is usually the illumination light that has "changed flavor." Human eyes may perceive two white lights as identical, yet one spectrum might lack blue while the other has excess yellow. If lighting fixtures are only tested for luminance and color temperature before shipment, such invisible deviations slip through.
A consumer electronics contract manufacturer once faced a wavelength drift in backlight modules, causing inconsistent color temperature across a batch of smart panels. By the time a quality engineer on a night shift obtained third‑party re‑verification, rework and line‑stoppage losses had already reached approximately $33,700. Traditional visual inspection relies on operator experience, which fluctuates between day and night shifts. Single‑point illuminance meters only read a total sum, unable to reveal which colors compose the light.
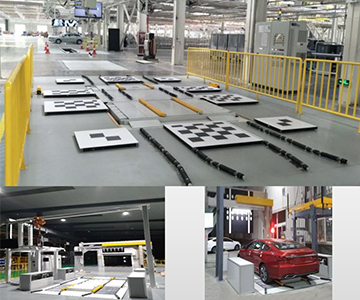
Machine vision systems depend on images, and images depend on illumination spectra. When production节拍 hits millisecond levels, human eyes and simple probes cannot keep up. This is where spectrometers enter: they split light into a rainbow and account for each wavelength. They do not replace cameras; instead, they equip the camera’s "eyes" with color‑discriminating lenses, allowing high‑resolution spectral analysis to monitor every nuance of light color in consumer electronics inline inspection.
Core Components: Translating Light into Digital Data
Detector: The Film That Determines Sensitivity
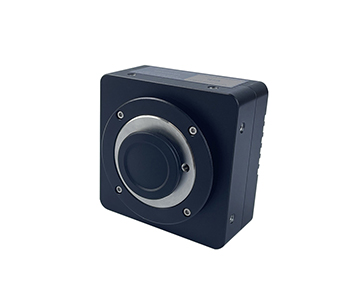
The detector is the light‑sensing component, analogous to old‑school camera film. Smaller pixel size resolves finer wavelength details; more linear array pixels sample the spectrum more densely. In weak‑light Raman scattering scenarios, detector noise directly determines whether faint signals are visible. Cooling the detector places it in a "constant‑temperature darkroom," suppressing noise by one to two orders of magnitude—meaning spectral curves remain clean during long‑duration low‑light acquisition.
Dispersion Structure: Spreading White Light into a Sorted Rainbow
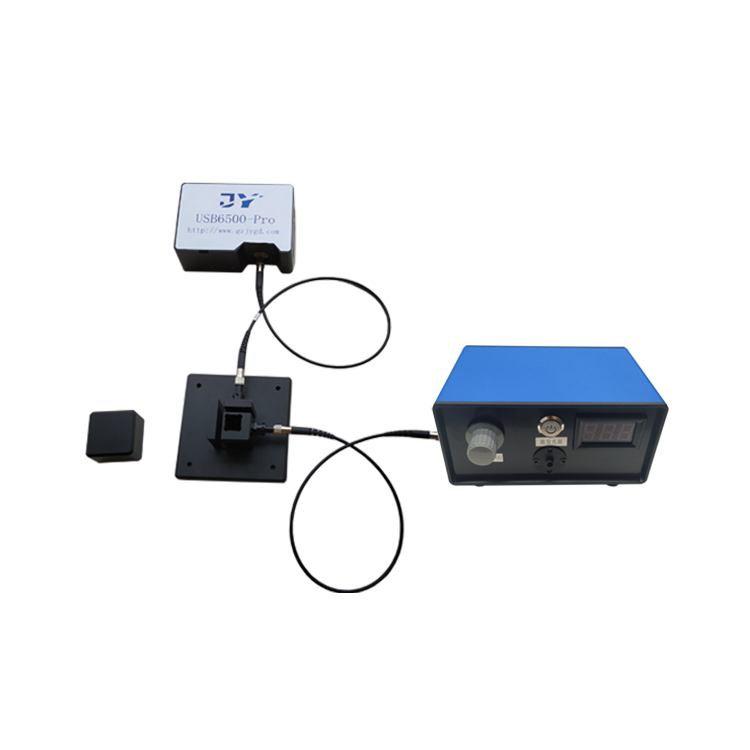
Light first passes through a slit, then gets dispersed by a grating. Imagine a courier sorting line where different colors are routed to different bins. A wider slit admits more light but blurs the rainbow; a narrower slit improves resolution but reduces intensity. A crossed Czerny‑Turner (C‑T) optical path acts like a stable conveyor belt, letting the rainbow land smoothly on the detector. This ensures spectral lines do not blur left or right even on vibrating production floors.
Fiber and Interface: The Stethoscope’s Hose
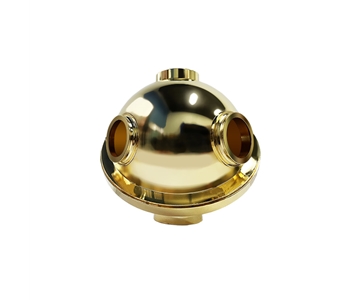
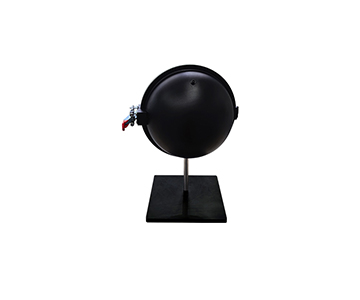
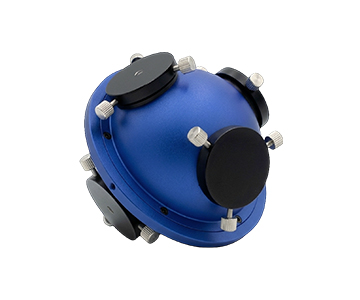
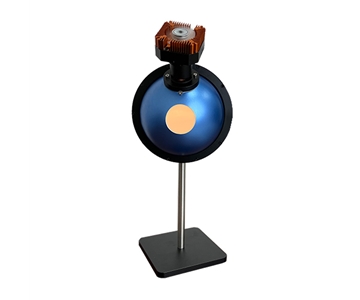
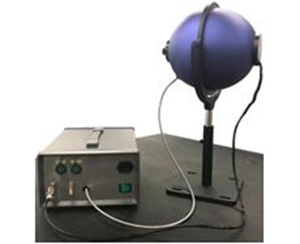
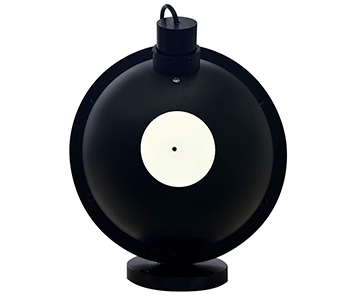
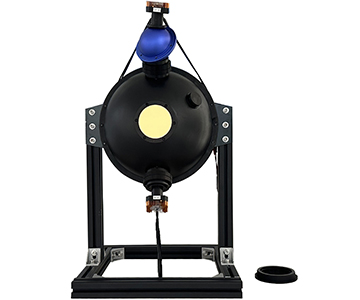
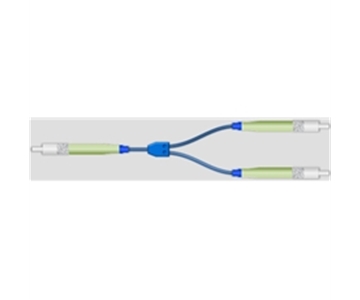
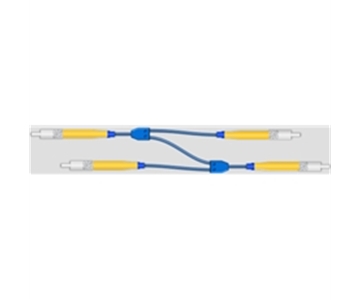
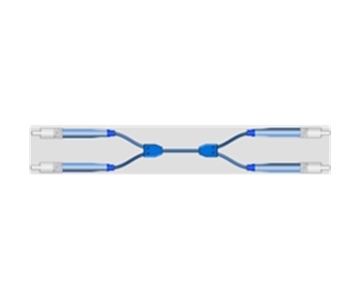
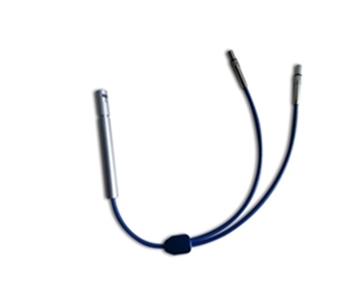
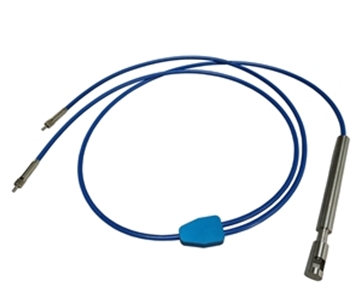
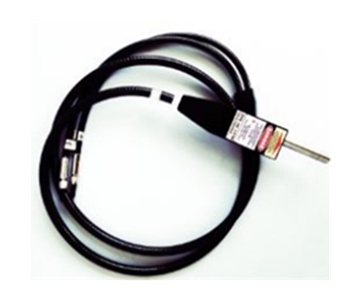
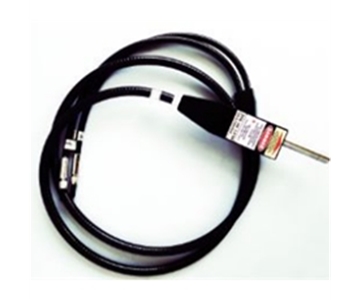
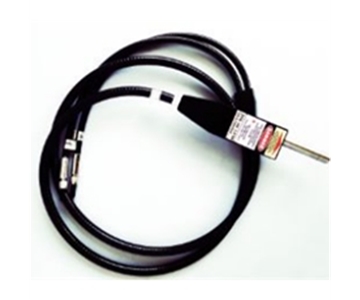
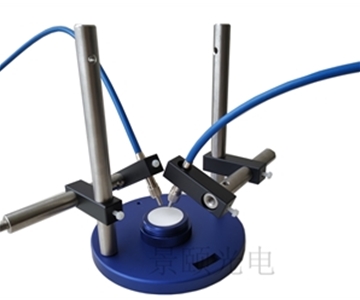
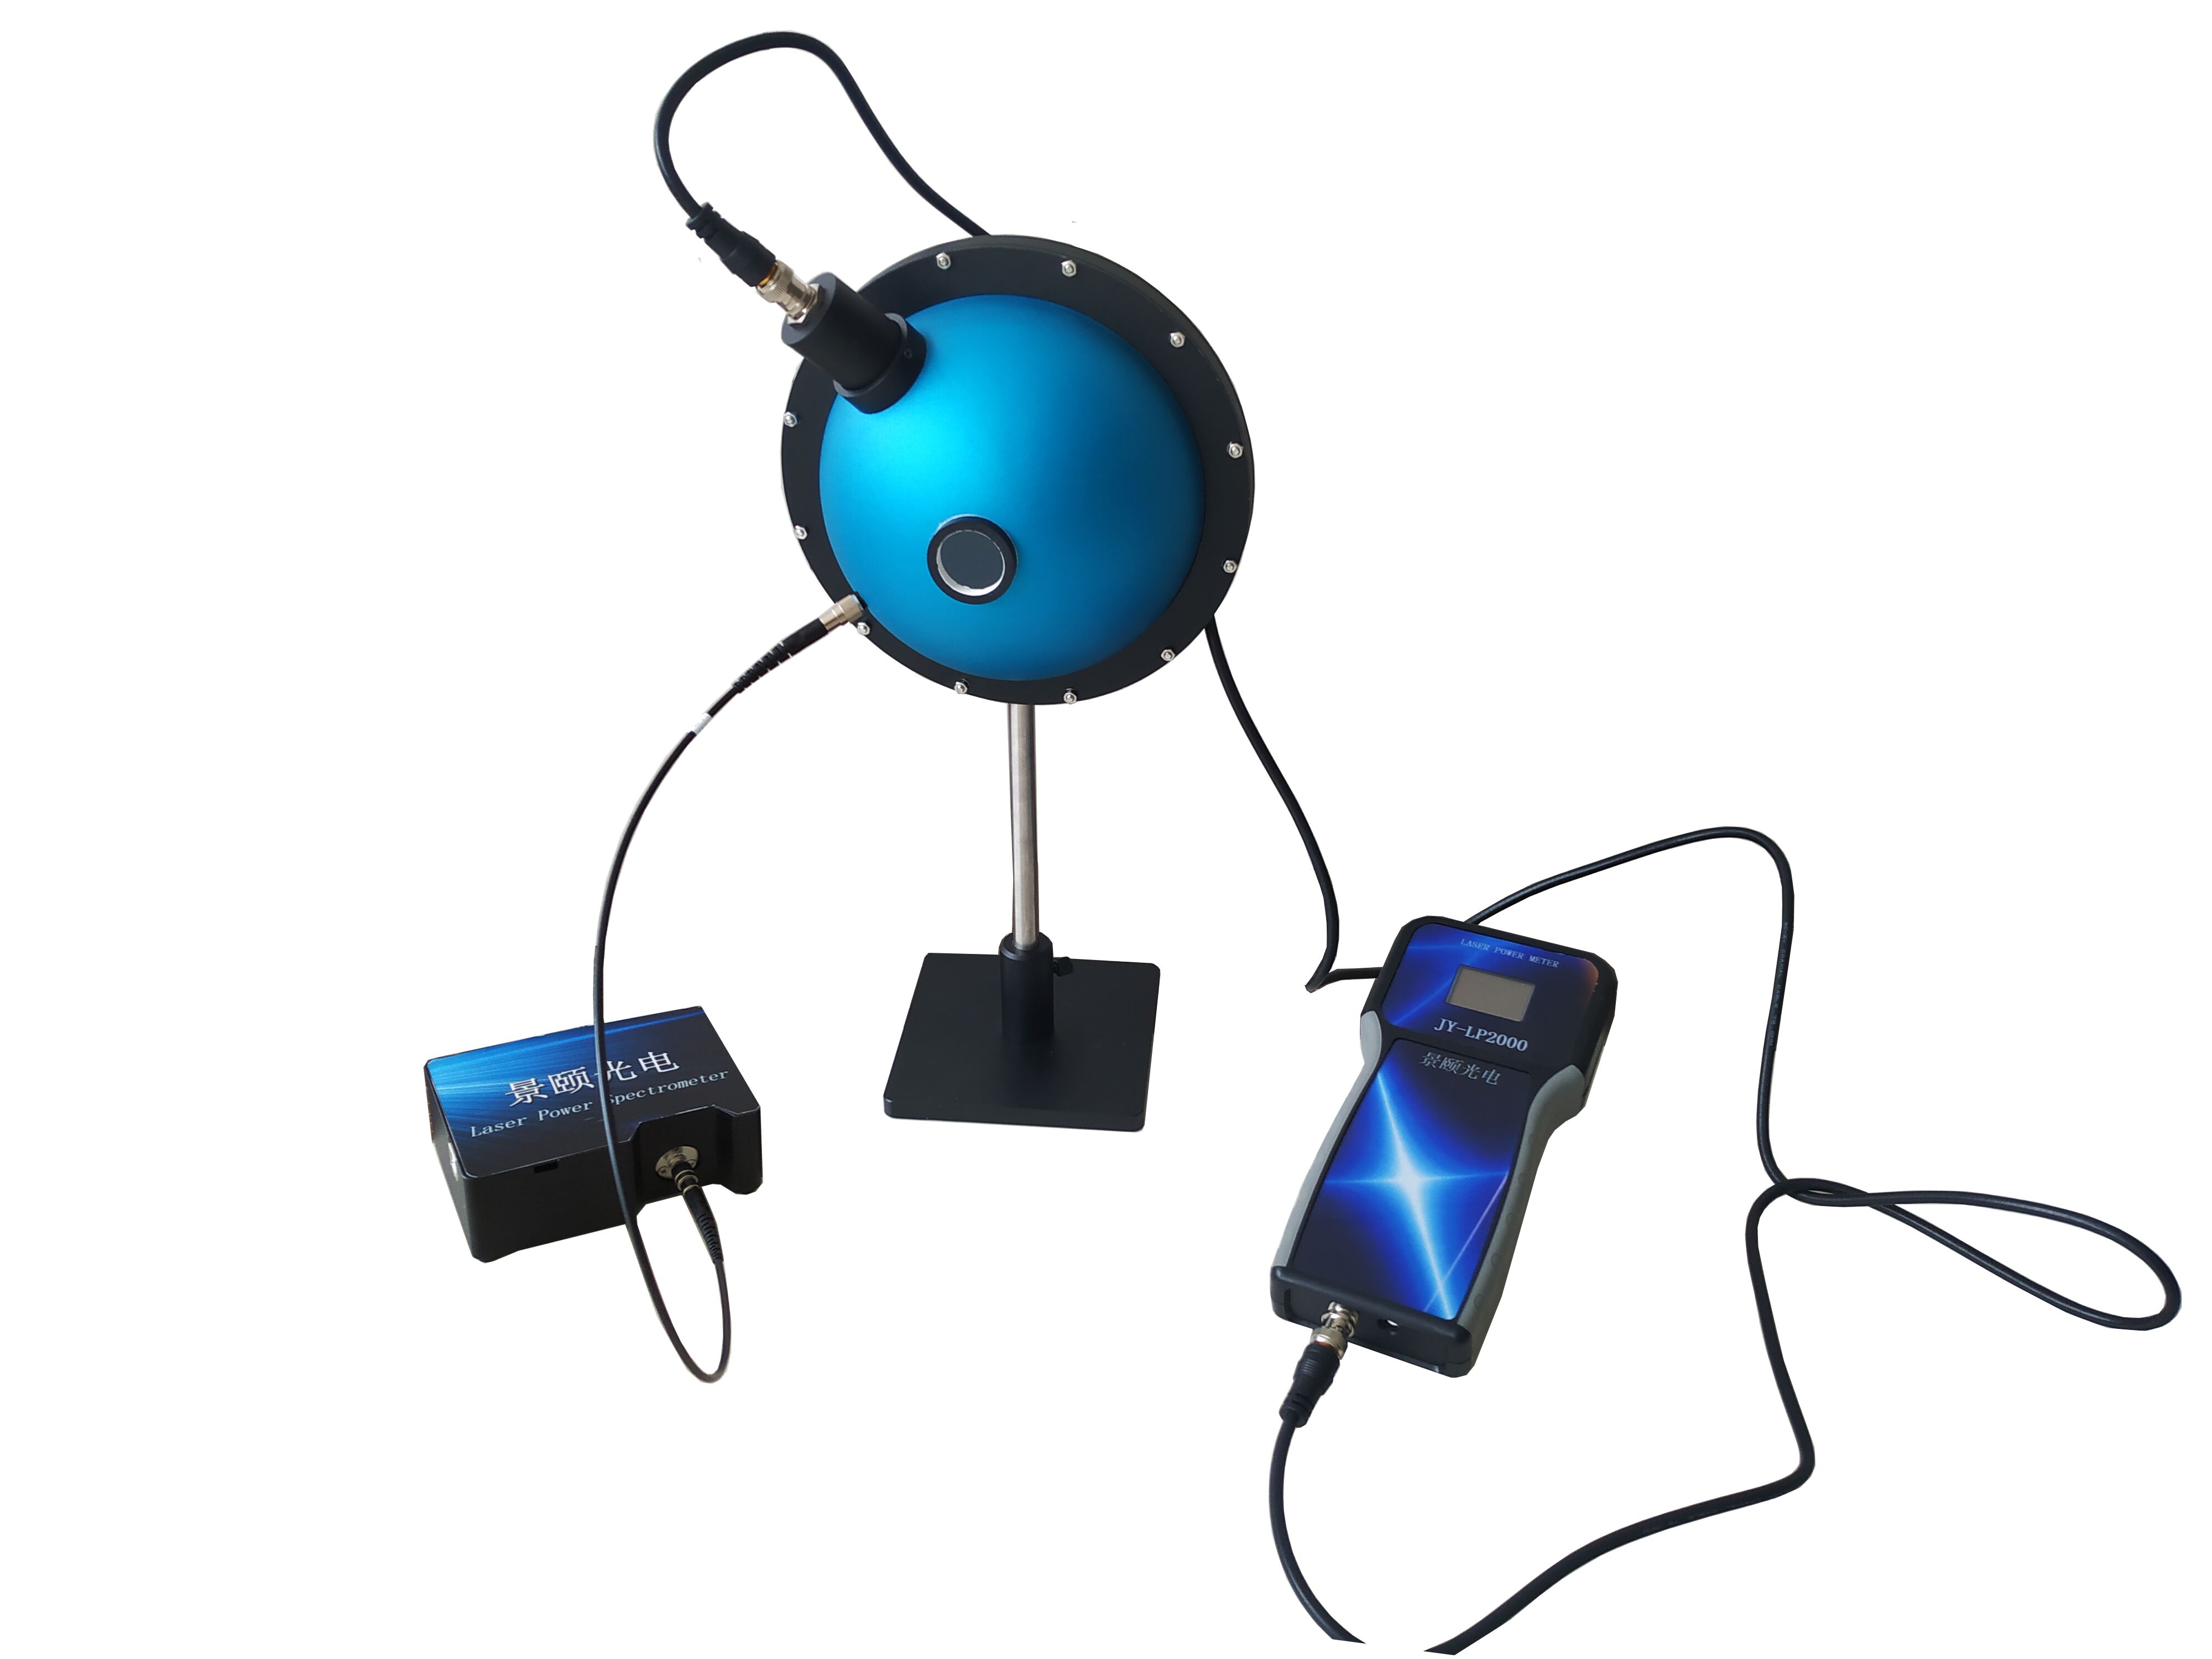
SMA905 fiber acts like a doctor’s acoustic tube, "listening" to light from probes or integrating spheres and delivering it to the host. Free‑space input is akin to pressing an ear directly against the machine. Over‑bending the hose causes light loss, so production wiring must respect minimum bend radius—otherwise readings drift silently.
Analysis Software: The Physical Examination Report Generator
Raw data are voltage fluctuations; software translates them into wavelength‑intensity curves. When calculating transmittance or reflectance, high linearity (better than 99.8%) ensures the report neither exaggerates nor hides deviations. Coupled with 18‑bit sampling depth, it can flag deviations as small as a few thousandths. For total transmittance and reflectance measurements, international standards such as ISO 13468‑1 or ASTM D1003 define test procedures; the instrument’s high‑linearity detection chain outputs quantified curves that conform to these public metrology frameworks.
Two Typical Application Scenarios
Consumer Electronics: Inline Interception of Backlight Color Accuracy
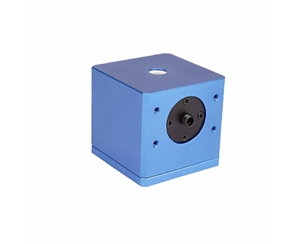
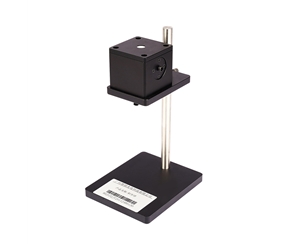
On a smartphone cover glass line running at 0.8 seconds per piece, a process engineer noticed a cyan tint in final inspection images during a night shift. Connecting a wide‑band spectrometer with a cosine diffuser revealed a 3.7 nm rightward shift in the backlight peak wavelength and a collapsed tail in the normalized luminance curve. After parameter adjustment, the shift’s defect rate dropped from 0.12% to below 0.03%, preventing larger customer complaints the next day. Here, the spectrometer performs spectral reflectance measurement, building an early‑warning gate between lab R&D and mass production.
Agriculture and Food: Near‑Infrared Non‑Invasive "Brix Meter"
On a fruit sorting line, an infrared spectrometer scans apples. In the 900–1700 nm band, water and sugar leave distinct absorption "fingerprints." 0.1 ms integration means the conveyor never stops; several fruits per second can be judged for maturity and sugar‑acid ratio. Near‑infrared spectrometers enable precision optical sorting, automatically diverting under‑ripe or over‑ripe produce to different outlets, reducing storage loss and eliminating destructive slice testing.
Three Common Misconceptions
Misconception 1: "Wider wavelength range is always better."
Why it’s wrong:
Spreading pixels across an ultra‑wide range reduces sampling points per nanometer, degrading resolution.
Correct approach:
For machine vision lighting in the visible range, choose 200–1100 nm. Use 900–2500 nm only for near‑infrared component analysis. Select based on actual scene.
Misconception 2: "Longer integration time yields higher accuracy."
Why it’s wrong:
Long integration accumulates dark current; especially in uncooled devices, noise grows linearly with time at room temperature.
Correct approach:
Use short integration (millisecond level) when light is sufficient. Reserve long integration for extremely weak fluorescence or Raman with cooled models; otherwise you only amplify noise.
Misconception 3: "A spectrometer can replace all other inspections."
Why it’s wrong:
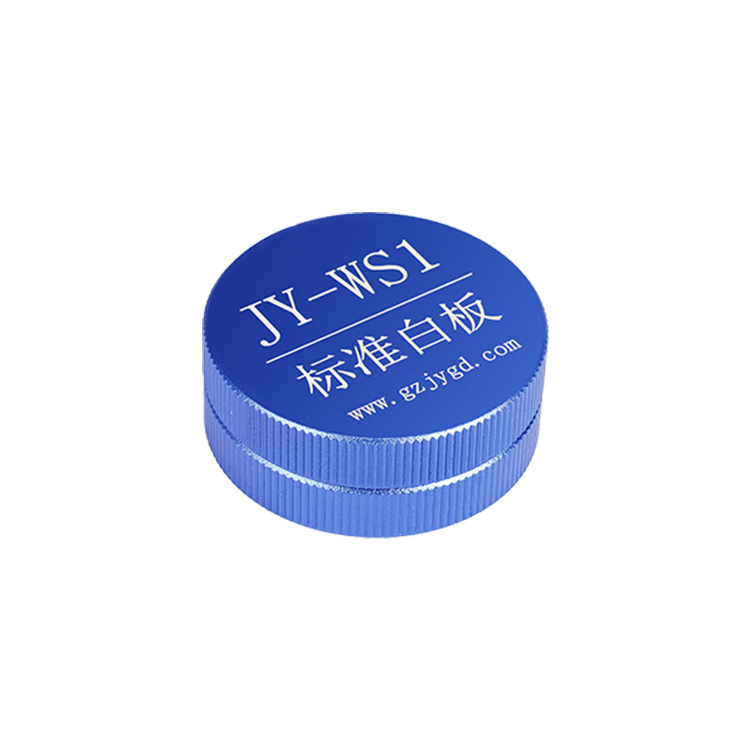
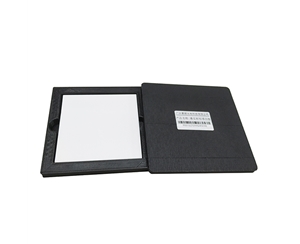
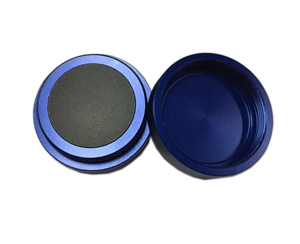
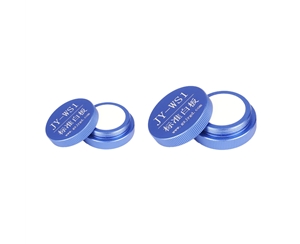
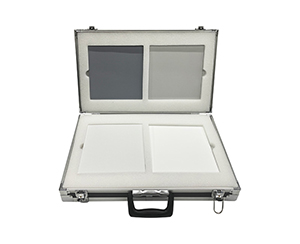
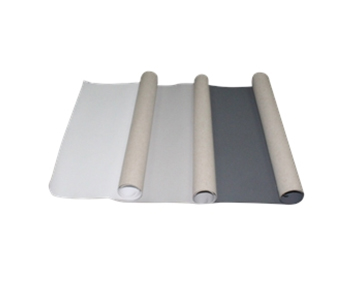
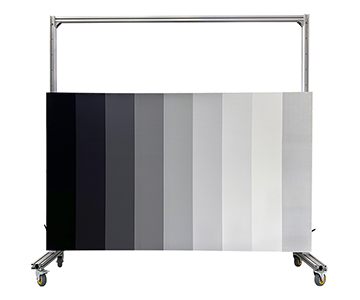
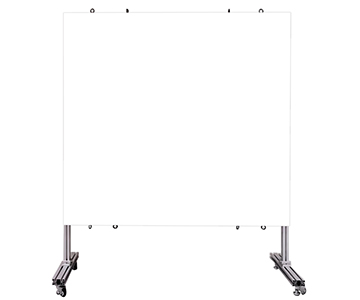
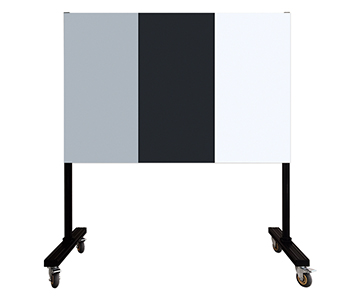
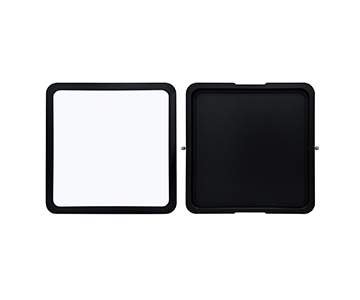
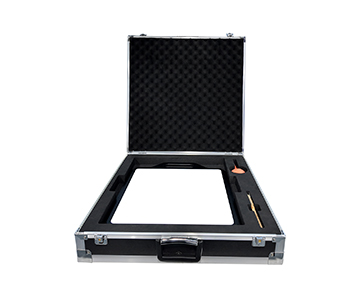
Spectra provide relative optical features; absolute values still rely on standard white boards and calibration chains.
Correct approach:
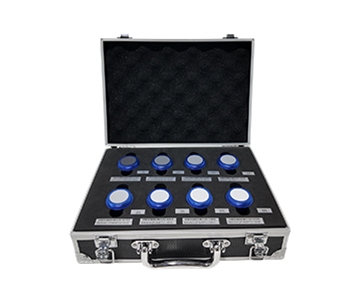
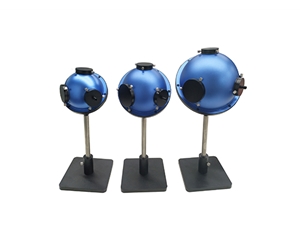
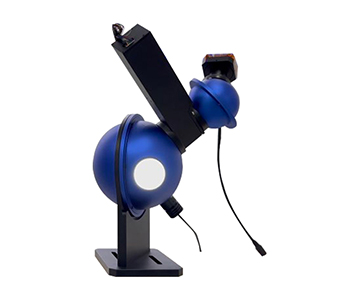
Treat it as a production line "early‑warning sentinel." Critical batches still require periodic traceability using integrating spheres and standard plates; never trust the instrument alone without benchmarks.
Advanced Standards and Third‑Party Verification
To independently evaluate instrument performance, look beyond vendor manuals. For colorimetry and light‑color analysis, refer to CIE technical reports; for beam and illumination consistency, consult ISO 11146 series. In automotive and industrial sensing, cross‑check lighting spectral stability against relevant sections of ISO 16505 or SAE standards. For total transmittance/reflectance, revert to original international standards like ISO 9050 or ASTM D1003. Research labs should perform dark‑current and flat‑field corrections with standard diffuse reflectance boards, then compare repeatability and SNR curves instead of trusting peak specifications on brochures.
Integration Boundaries and Practical Constraints
Spectrometers are not universal probes. Near‑infrared cooled models offer high SNR but are larger and consume more power than mini versions; dense equipment cabinets need planned heat dissipation. Uncooled mini models see dynamic range compression in low‑temperature or extremely weak fluorescence environments, requiring careful evaluation of operating temperature ranges for outdoor continuous operation.
A hidden constraint in fiber links is mechanical stability: under the same light source, fiber compression or bending can cause readings to drift by several percent. Long‑term inline systems must integrate fiber fixation, temperature control, and vibration isolation—not just stare at host specifications. Ignoring installation conditions will discount even the best resolution within three months.
Frequently Asked Questions
Q1: How does a spectrometer differ from a standard industrial camera?
A camera captures spatial images; a spectrometer records "how much energy exists at each wavelength within the same light beam." In machine vision, the former sees shape, the latter sees light composition. They complement, not replace, each other.
Q2: What practical metrics can near‑infrared models measure?
In the 900–1700 nm (extendable to 2500 nm) range, they analyze moisture and sugar content in agricultural products, plus absorption features of certain compounds. Suitable for non‑destructive sorting and process monitoring, but they do not provide micro‑topography information.
Q3: How to initially set integration time?
First check for signal saturation. If saturated, shorten to millisecond level; if too weak, gradually lengthen. Cooled models allow longer integration; uncooled models should stay within seconds to suppress dark noise.
Q4: Which parameter deserves priority during procurement?
Do not fixate on wavelength range alone. Evaluate resolution, SNR, linearity, and trigger delay based on scenario. Inline monitoring prioritizes speed and integration size; lab R&D prioritizes noise and dynamic range.
Q5: How can I independently verify if a spectrometer is reliable?
Perform repeated scans of a standard diffuse reflectance board to check intensity fluctuation on the same sample. Verify traceability and standards compliance, conduct cross‑tests referencing public standards, and avoid relying solely on vendor‑supplied demo data.
About This Guide
Data Sources:
Jingyi Optoelectronics product technical documentation, CIE technical reports, ISO 11146:2021, ISO 13468‑1:2019, in‑house validation reports (n=47 test runs on backlight modules and agricultural samples).
Author:
Cai Xiaodong, Senior Application Engineer, Jingyi Optoelectronics, 12 years in optical metrology and machine vision integration.
Disclosure:
Jingyi Optoelectronics manufactures fiber optic spectrometers. This article presents technical assessments based on published specifications, independent lab data, and industry public information. No compensation was received from third‑party brands mentioned.
Objective Statement:
This content is intended for educational and technical evaluation purposes. Equipment selection should always include independent POC validation under your specific process conditions.
Last Updated:
November 2026
For detailed specifications and application notes on fiber optic spectrometers, search "Jingyi Optoelectronics + fiber optic spectrometer" or visit our technical library.