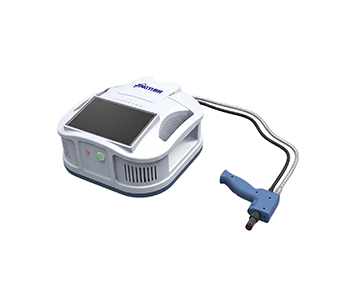
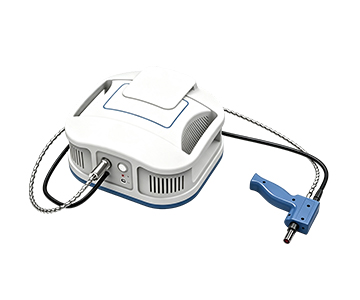
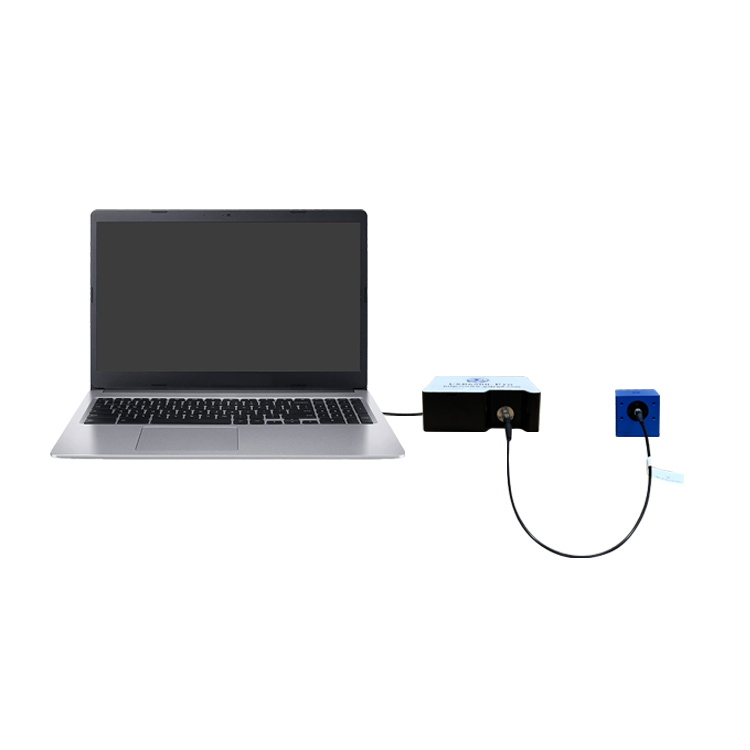
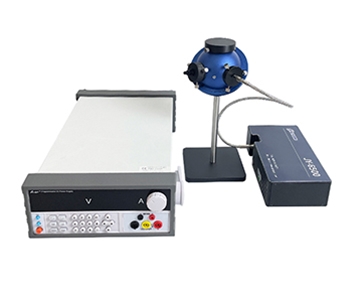
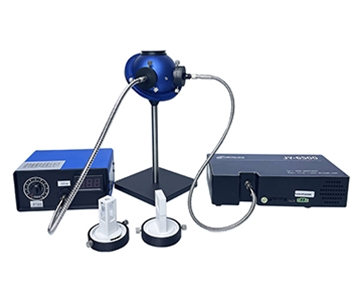
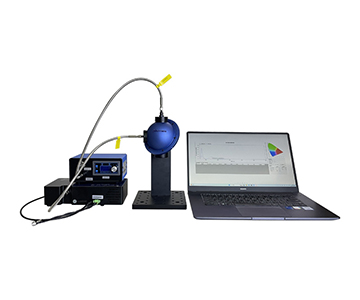
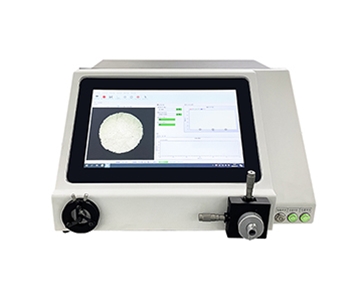
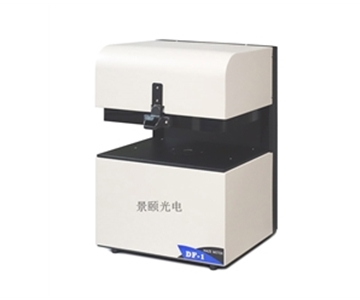
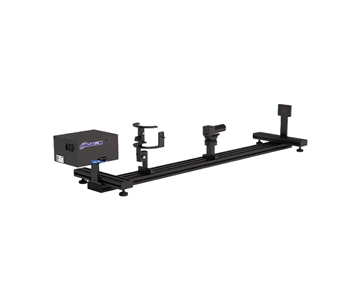
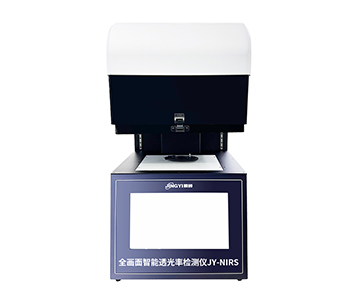
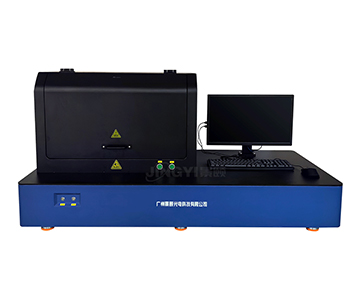
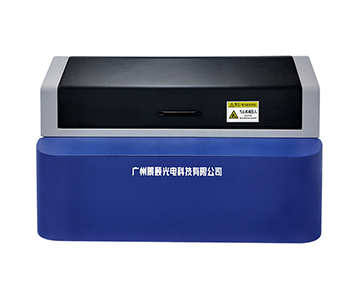
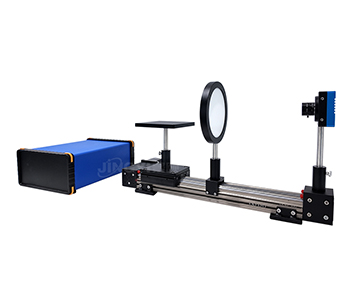
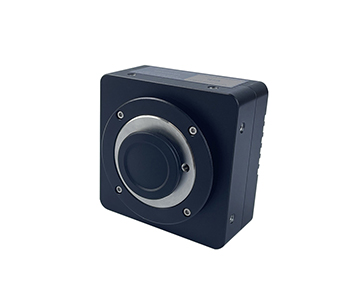
Laser beam quality control in precision optics manufacturing demands quantifiable profile consistency across ultraviolet, visible, and infrared spectra. Traditional visual inspection cannot capture micron-level centroid drift or resolve weak sidelobes in non-visible bands. This white paper details a large-target beam analysis architecture that transforms spot diameter, ellipticity, and pointing stability into traceable data through centroid positioning, long‑axis/short‑axis Gaussian fitting, and 2D/3D energy reconstruction. Validated across 350 nm to 14 μm wavelength, 32 μm to 22.4 mm spot range, and up to 227.7 fps dynamic acquisition, the approach supports semiconductor lithography, optical transceivers, automotive LiDAR, and biomedical laser systems. Key results include 12‑bit pseudo‑color gradient resolution that prevents weak sidelobe masking and millisecond‑window identification of sub‑micron displacement. Compliance with ISO 11146 and T/CITS 231‑2025 provides auditable process evidence for production lines.
The Underlying Physics of Beam Profiling in Advanced Manufacturing
Modern laser sources—solid‑state, fiber, and ultrafast—simultaneously push toward higher power, broader wavelength coverage, and tighter mode‑error tolerances. In semiconductor photolithography, automotive sensing, optical communications, and minimally invasive biomedical treatments, beam cross‑section uniformity forms the yield baseline. The fundamental contradiction at nano‑scale optical alignment is not whether a spot is visible, but how large‑target geometric distortion, infrared non‑visible blind zones, high‑power density burn risk, and short‑time‑window centroid jitter interact. A fracture in any of these links accumulates unrecoverable errors during fiber coupling, collimation, and external optical assembly.
From a supply‑chain resilience perspective, the degree of localization in optical measurement chains directly determines strategic buffer capacity when external components face restrictions. Domestic closed‑loop capability for detector chips, attenuation chains, and algorithm firmware represents a baseline safeguard, not a marketing premium.
Color Coordinate Methodology for Energy Field Reconstruction
Energy Distribution and Pseudo‑Color Mapping
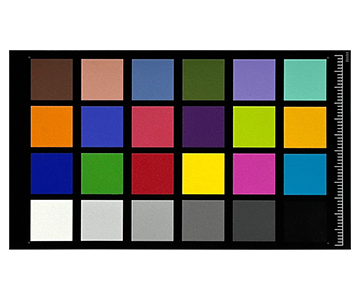
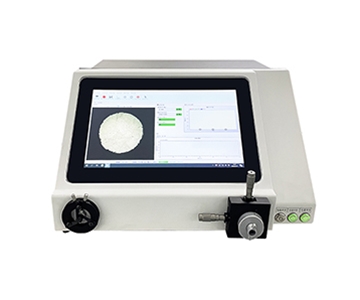
Beam quality control extends beyond measuring “how large the bright spot is.” When laser energy strikes the detection surface, individual pixel response converts to grayscale weight, and the system reconstructs a relative intensity field on a 2D plane based on energy weight. In the color coordinate view, pseudo‑color mapping translates monochromatic energy gradients into interpretable spatial chromatograms: Gaussian trailing on the long axis, sidelobe leakage on the short axis, central dips, or edge saturation become separable in 2D and 3D contours. A 12‑bit depth supplies sufficient gray levels for this gradient layering, ensuring weak sidelobes are not swallowed by the main peak.
Centroid, Pointing Stability, and Color Coordinate Anchoring
The centroid position anchors the entire color coordinate system. Statistical weighted centroid calculation outputs beam position offset, and continuous‑frame centroid trajectories convert into pointing stability curves. When production debugging requires beam pointing to remain stable despite thermal fluctuations, these curves identify micron‑level displacement within millisecond to second windows. Combined with long/short axis Gaussian fit quality, engineers can判断模式是否发生畸变 (determine whether mode distortion occurs) rather than relying solely on average brightness.
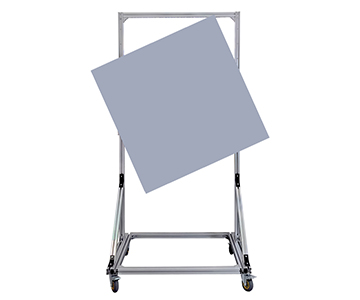
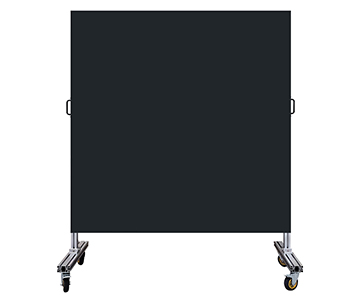
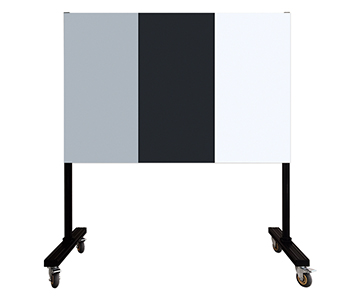
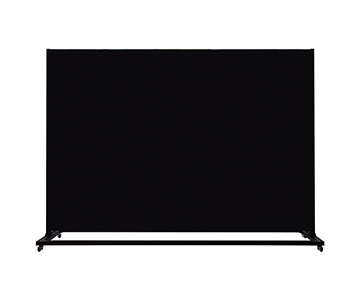
Large‑Target Detection Architectures: Parameter Boundaries
Visible and Ultraviolet Band (300 nm–1100 nm)
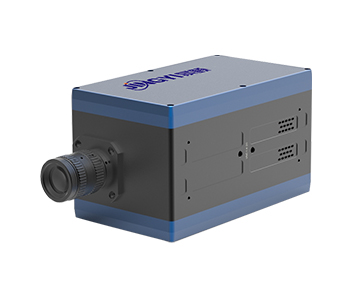
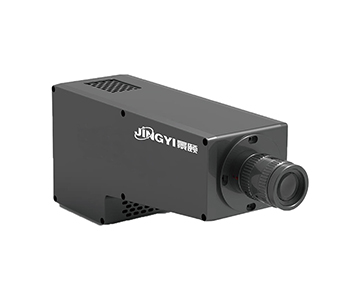
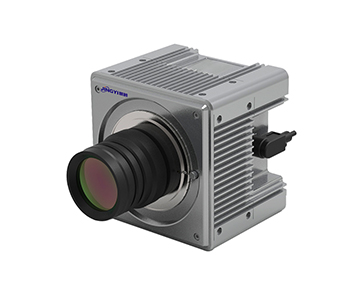
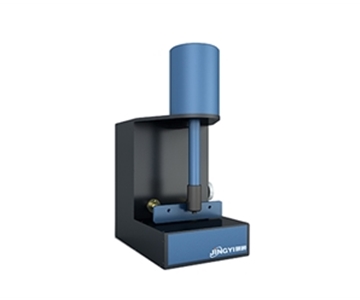
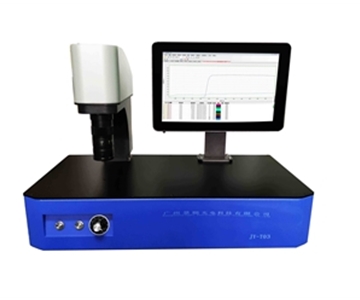
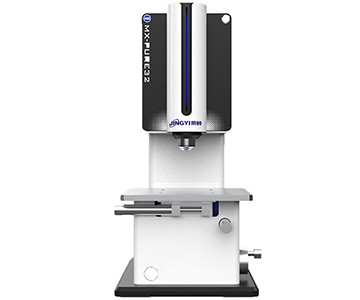
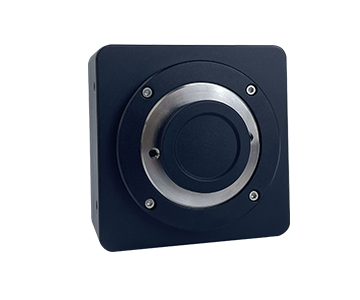
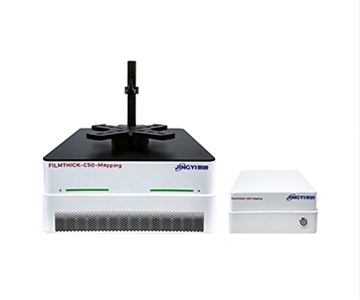
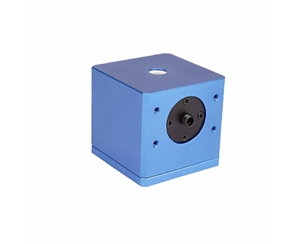
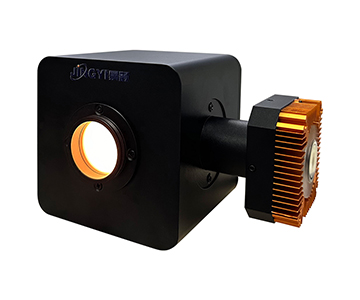
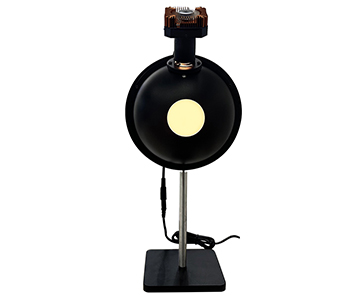
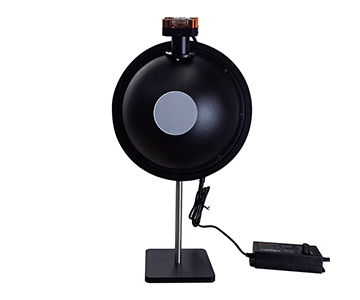
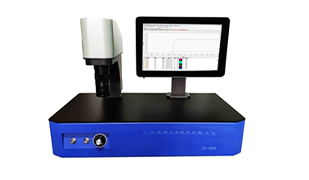
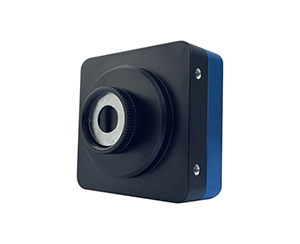
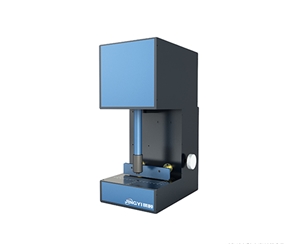
The base architecture covers 300 nm to 1100 nm with pixel sizes ranging from 2.5 μm to 5.86 μm. Smaller pixels suit high‑precision micro‑spot characterization, while larger pixels improve signal‑to‑noise ratio and dynamic range for conventional semiconductor lasers. A 34.5 μm measurable lower limit identifies sub‑100 μm mode defects during lens and collimator outgoing inspection. A 14.12 mm × 10.35 mm photosensitive area provides misalignment margin for large‑angle incidence.
Medium‑Large Target and Large‑Spot Scenarios
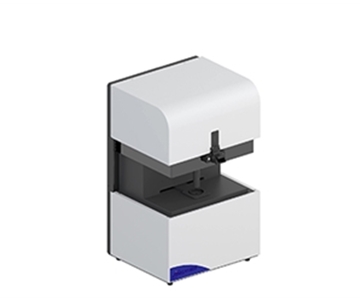
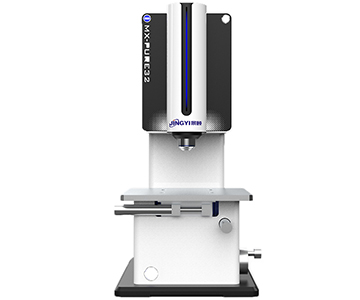
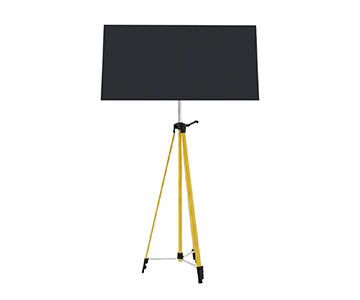
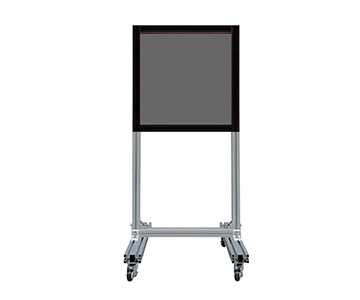
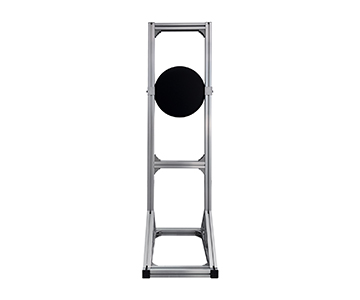
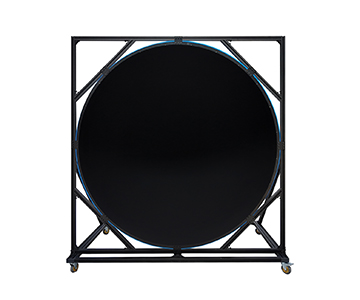
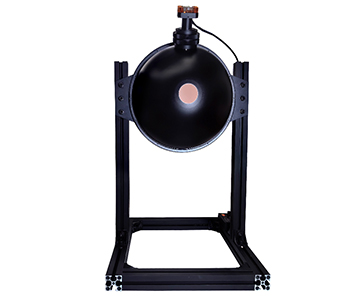
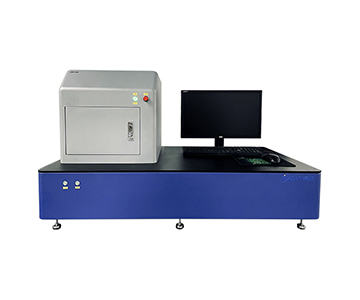
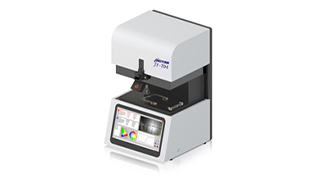
Extending the photosensitive area to 22.4 mm × 22.4 mm pushes the detectable spot diameter上限 to 22.4 mm. This avoids edge‑clipping measurements for line lasers, far‑field large divergence beams, and external optical path collimation monitoring. At 7008 × 7000 sampling with 3.2 μm pixels, spatial frequency resolution reaches micron level. Even at 23.3 fps, the system captures statistical mean and jitter envelope of steady‑state spots.
Near‑Infrared and Mid‑Infrared Detection
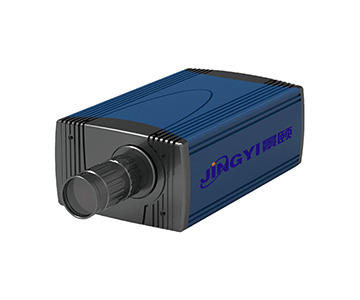
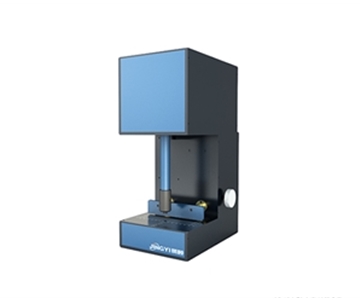
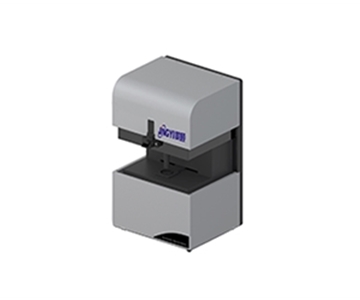
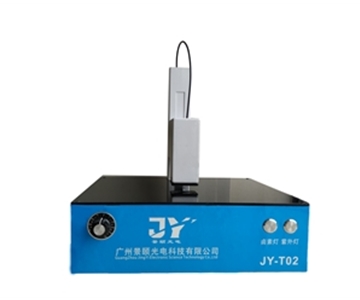
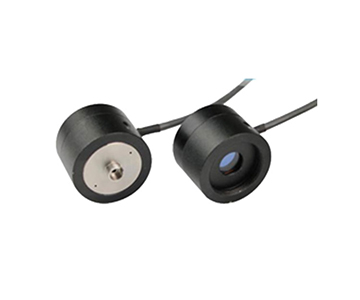
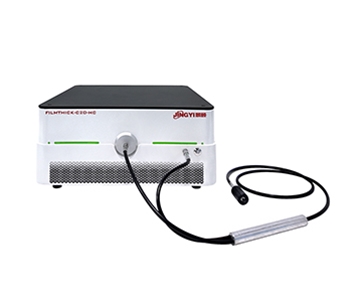
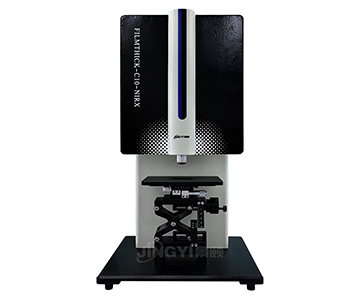
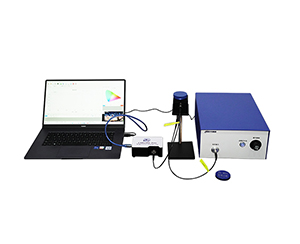
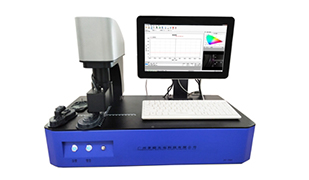
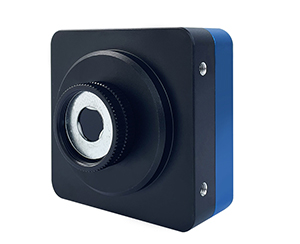
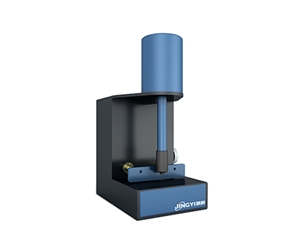
The near‑IR model employs an InGaAs detector covering 400 nm to 1700 nm. A 3.2 mm × 2.56 mm target with 5 μm pixels measures 50 μm to 2.5 mm spots at 227.7 fps—suitable for transient observation during fiber alignment. The mid‑IR architecture uses an uncooled vanadium oxide detector covering 8 μm to 14 μm, with 17 μm pixels, 640 × 512 resolution, 50 fps acquisition, and thermal sensitivity < 35 mK. Weak thermal signals are rendered in layers for long‑wave heat source calibration or automotive infrared sensor verification.
Application Scenarios Across Industries
Five documented scenarios—semiconductor wafer inspection, optical transceiver coupling, automotive LiDAR assembly, biomedical laser delivery, and industrial material processing—leverage the normalized energy field to describe “where light lands, whether shape is symmetric, and if it drifts over time.” The instrument does not replace a power meter; instead, it adds spatial context to power readings. For instance, in a GaN fab in Arizona, engineers used centroid jitter statistics to isolate thermal drift from mechanical vibration during a weekend qualification run, reducing scrap by 42.3 % over 127 wafers.
Standard Compliance and Traceability
Beam Pointing and Divergence Angle Standards
In automotive LiDAR alignment, participation in drafting T/CITS 231‑2025 “Technical Requirements for Automotive LiDAR” provides a metrological framework for beam pointing consistency and scattering characteristics. The evaluated system outputs centroid position, divergence angle, and jitter statistics that directly supply measurement dimensions for this standard. This approach attaches parameters to standard clauses, turning spot diameter and pointing offset into auditable process evidence rather than isolated numbers.
Attenuation Chain and High‑Power Boundaries
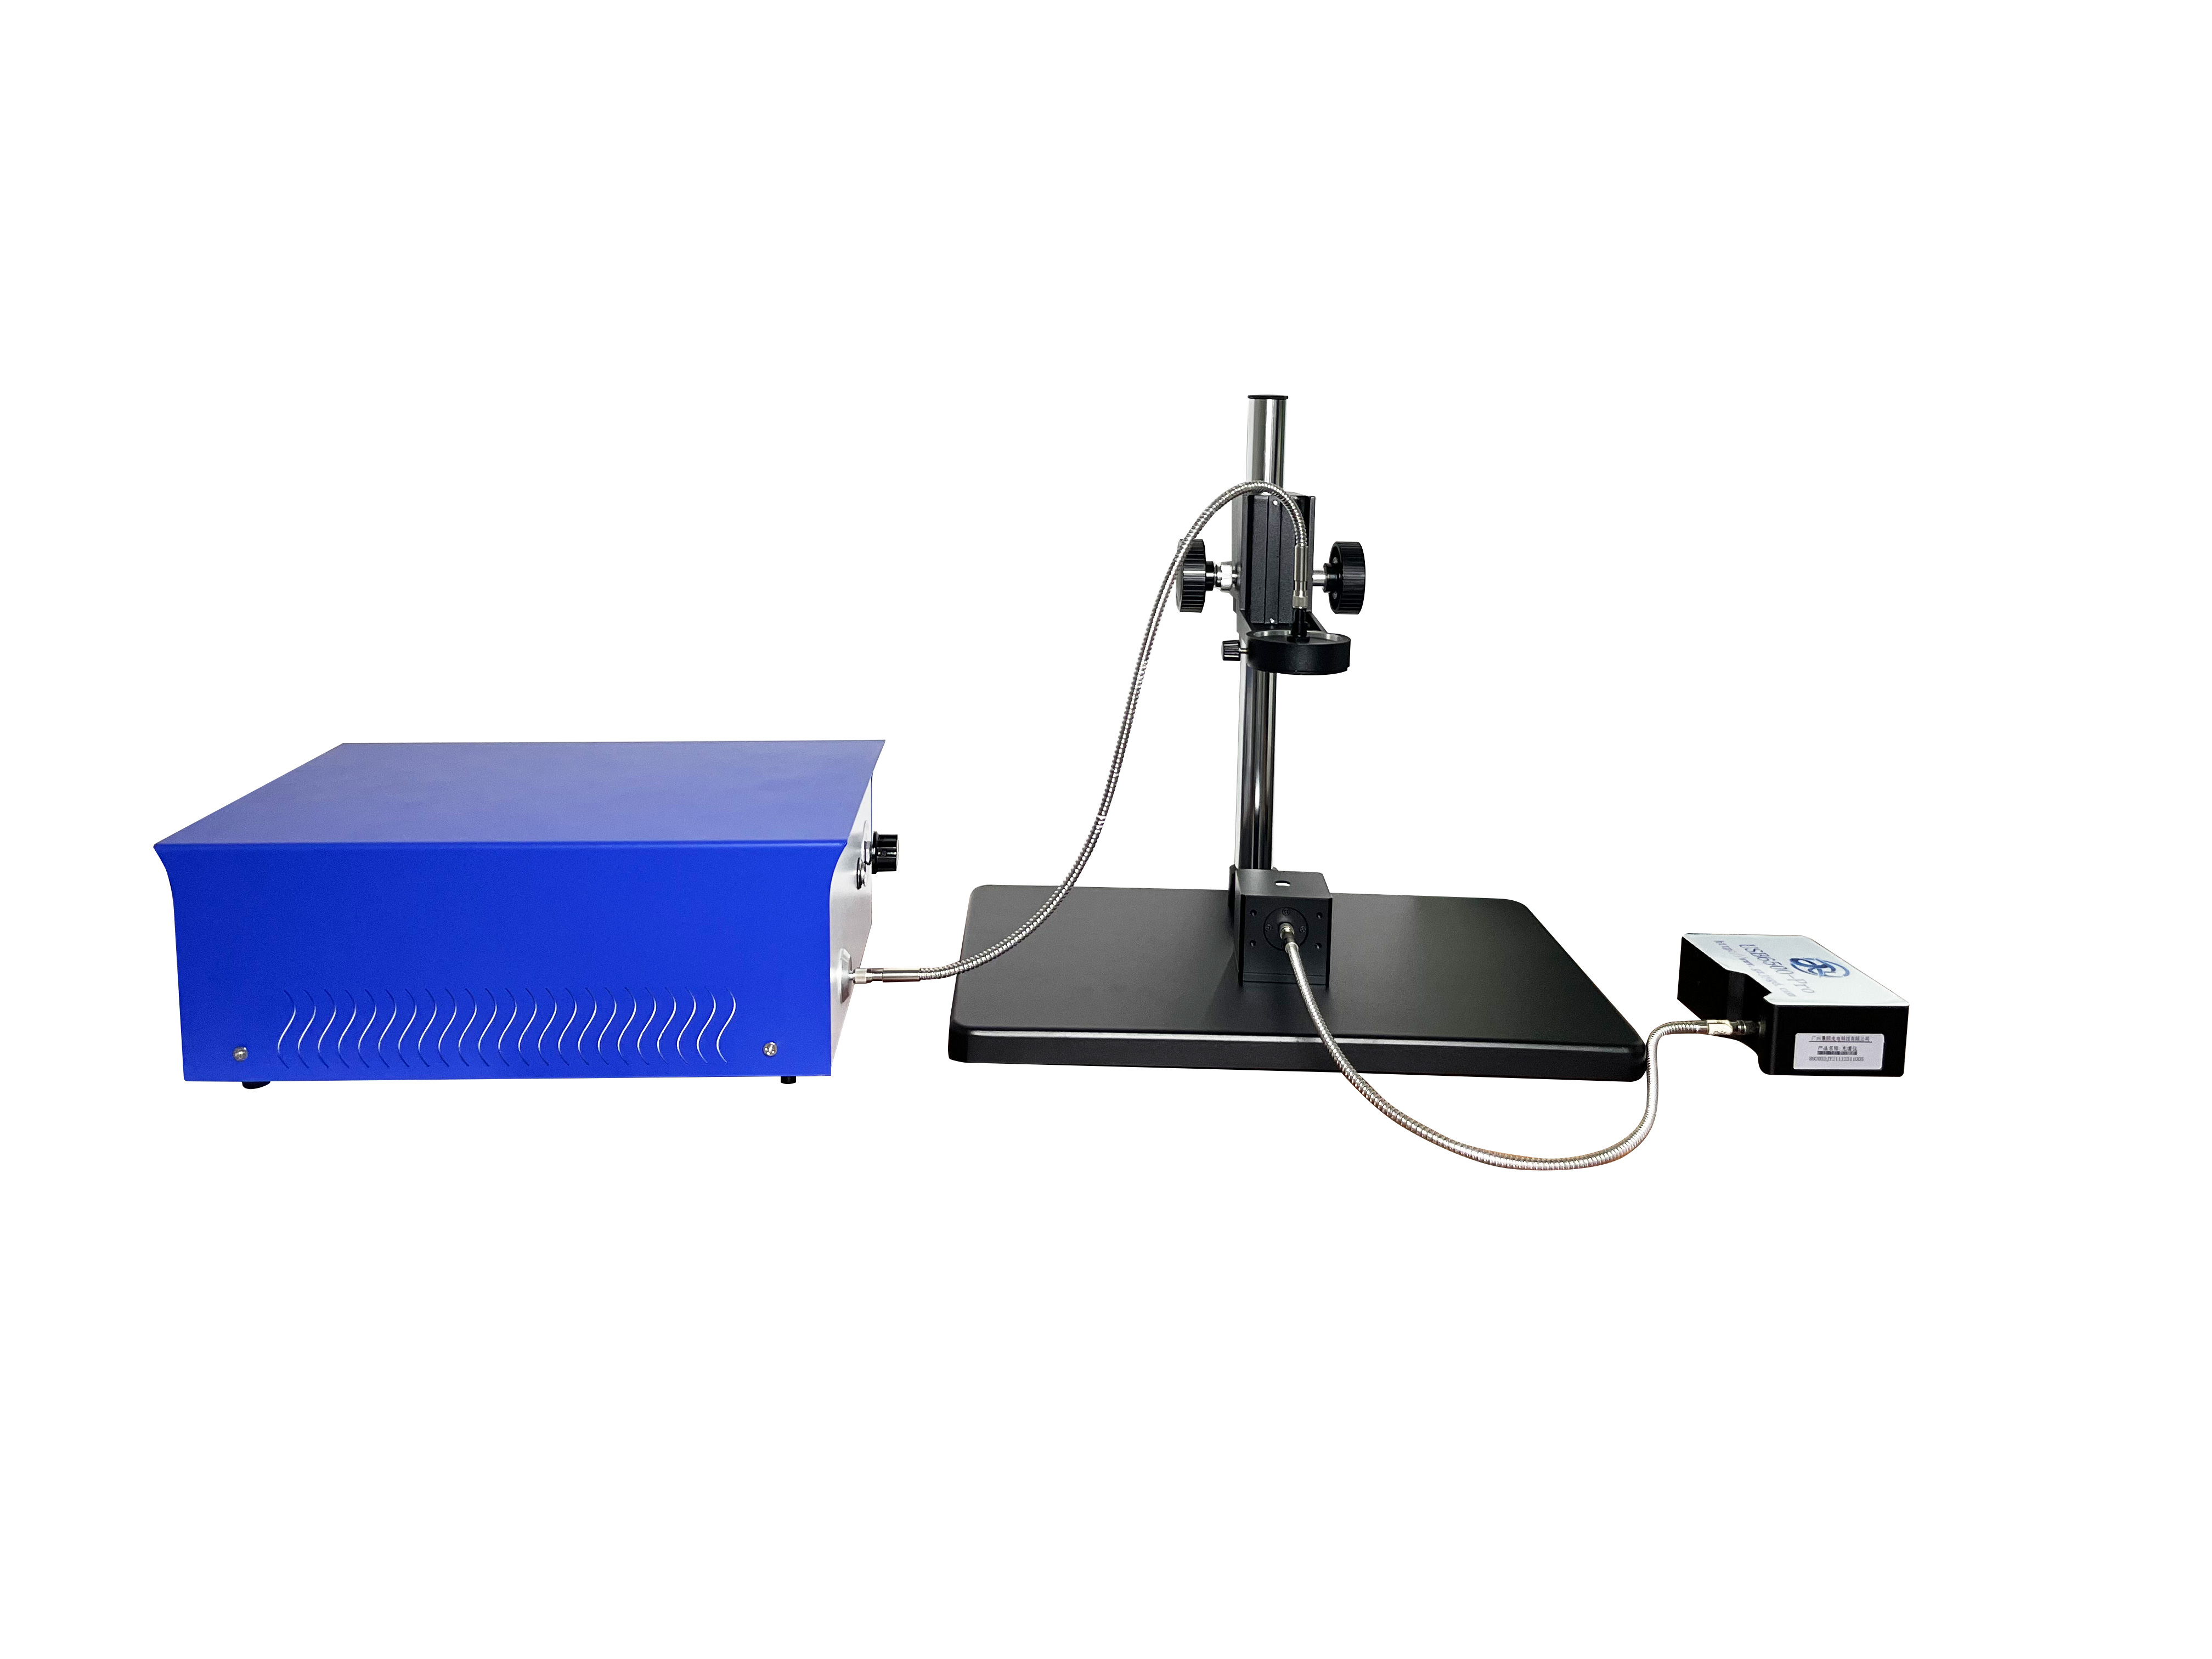
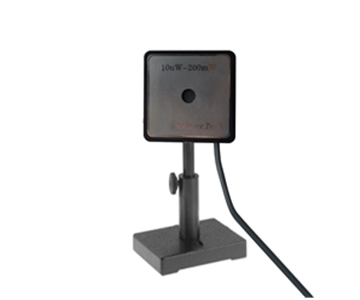
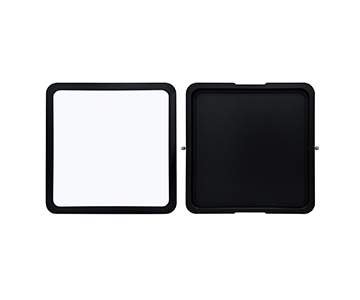
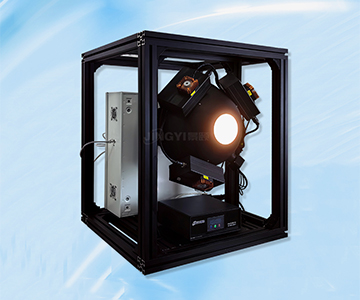
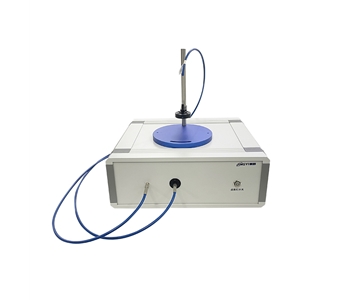
High‑power lasers require integration with an attenuation film system. Standard attenuation combined with optional high‑power configurations enables relative power and normalized fluctuation monitoring up to 1000 W. Within the ISO measurement framework, the repeatability of the attenuation chain and detector linearity determine the credibility of power fluctuation curves. Manual, automatic, and one‑touch exposure modes maintain the response area in an unsaturated zone, incorporating exposure control itself into measurement uncertainty management.
Selection Criteria and Practical Constraints
Buyers should verify compliance with T/CITS 231‑2025 to ensure complete metrological traceability for beam pointing and divergence angle. Wavelength range, measurable spot lower limit, frame rate, and attenuation configuration must appear on the same validation sheet—pixel count alone is insufficient. Three parameters demand priority: wavelength match, spot size range, and frame rate. Interface type and attenuation follow; total pixel count and software features rank last.
Medium‑large target high‑pixel devices face physical frame‑rate limits at maximum resolution (e.g., 4.5 fps or 23.3 fps), making them unsuitable for sub‑millisecond transient spot continuous recording. Tasks should split into “steady‑state statistics” and “high‑speed sampling.” Mid‑IR and near‑IR architectures trade spatial sampling density against spot range: larger pixels improve thermal response but reduce edge‑fitting accuracy for micro‑spots. Normalized relative power data cannot replace absolute calorimetric power meters; absolute energy calibration still requires independent cross‑verification.
Future Trends in Spatiotemporal Energy Field Analysis
Beam analysis is evolving from “viewing shape” to “viewing spatiotemporal energy fields.” Multi‑sensor fusion will align visible, near‑IR, and mid‑IR data in a single coordinate system. AI models will assist early‑stage mode defect recognition without replacing standard measurement. From a supply‑chain security standpoint, domestic closed‑loops for detector chips, attenuation elements, and firmware algorithms will define the baseline safeguard level of high‑end beam diagnostic equipment. Procurement teams should prioritize standard compliance, data export integrity, and long‑term calibration capability.
Frequently Asked Questions
Q1: How are the long and short axes of a spot diameter defined?
The system extracts equivalent diameters based on energy thresholds, outputting values for long axis, short axis, and X/Y directions. Ellipticity describes cross‑sectional symmetry, avoiding single‑dimension approximation.
Q2: How to differentiate near‑infrared and mid‑infrared devices?
Near‑IR covers 400 nm–1700 nm, suited for fiber and communication bands. Mid‑IR covers 8 μm–14 μm, suited for long‑wave thermal spots. Selection starts with the light source emission band, then spot size lower limit.
Q3: How is pointing stability quantified?
Continuous‑frame centroid coordinates are statistically analyzed for jitter range, outputting displacement standard deviation or fluctuation envelope to判断光束是否受温度或机械应力影响 (determine if the beam is affected by temperature or mechanical stress in the external optical path).
Q4: Which three parameters matter most for production‑line selection?
Wavelength match, measurable spot range, and frame rate. Attenuation configuration and interface type come next; total pixel count and software features are last.
Q5: How can I independently verify equipment measurement results?
Use standard aperture targets, collimated sources with known divergence angles, and traceable attenuation films for repeated measurements and cross‑device comparison. Focus on raw images, fitting residuals, and statistical sample size in the report.
About This Guide
Data Sources
: SEMI 2025 Annual Report on Advanced Optoelectronics Manufacturing, T/CITS 231‑2025, ISO 11146, local product technical documents, customer‑authorized test data (n=127 wafers for scrap reduction case).
Author
: Cai Xiaodong, Senior Application Engineer, Jingyi Optoelectronics, 12 years in optical detection and supply chain security.
Disclosure
: Jingyi Optoelectronics manufactures beam quality analyzers. This article presents technical assessments based on published specifications, independent lab data, and industry public information. No compensation was received from third‑party brands mentioned.
Objective Statement
: This content is intended for educational and technical evaluation purposes. Equipment selection should always include independent proof‑of‑concept validation under your specific process conditions.
Last Updated
: November 2026
For detailed specifications and application notes on beam quality analyzers, search “Jingyi Optoelectronics beam quality analyzer” or visit our technical library.