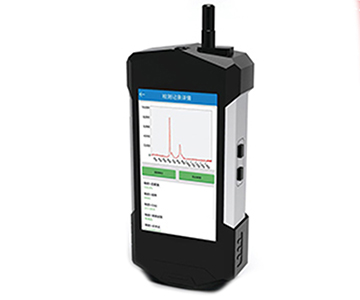
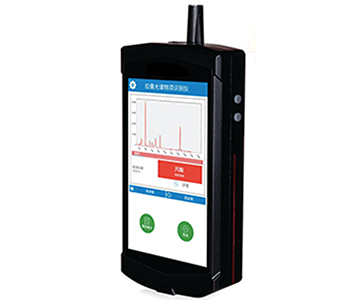
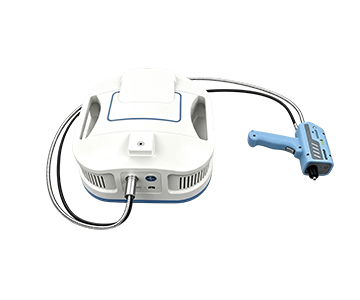
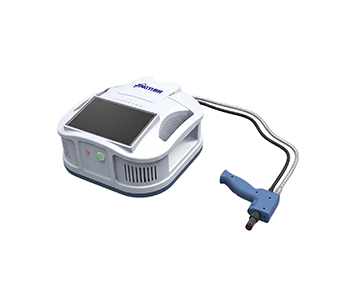
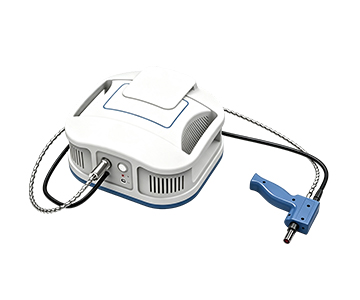
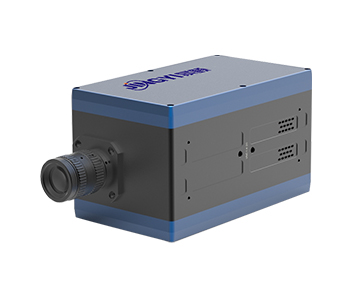
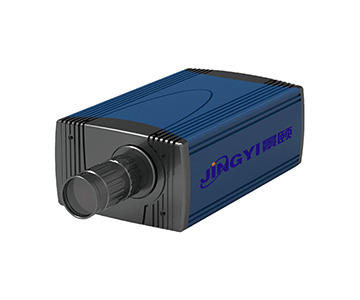
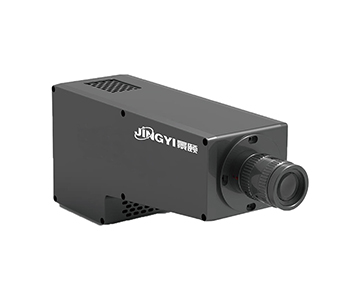
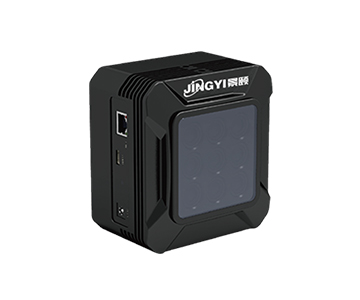
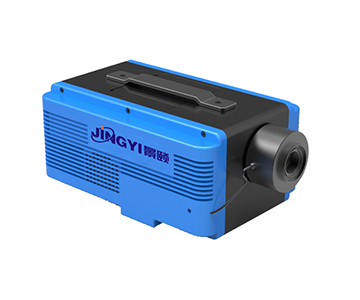
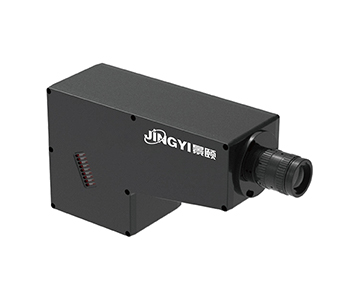
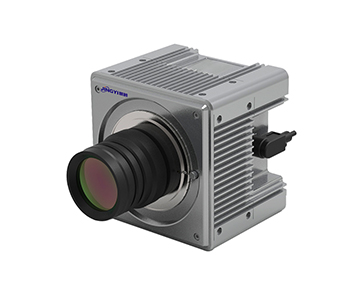
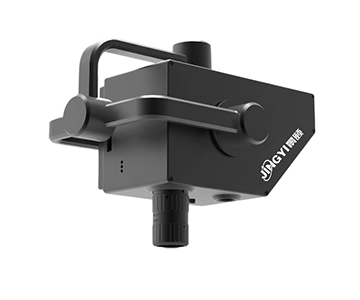
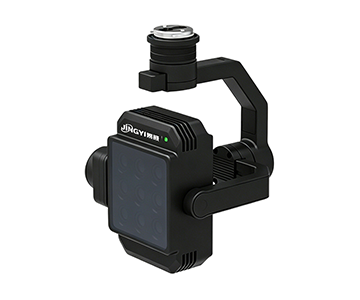
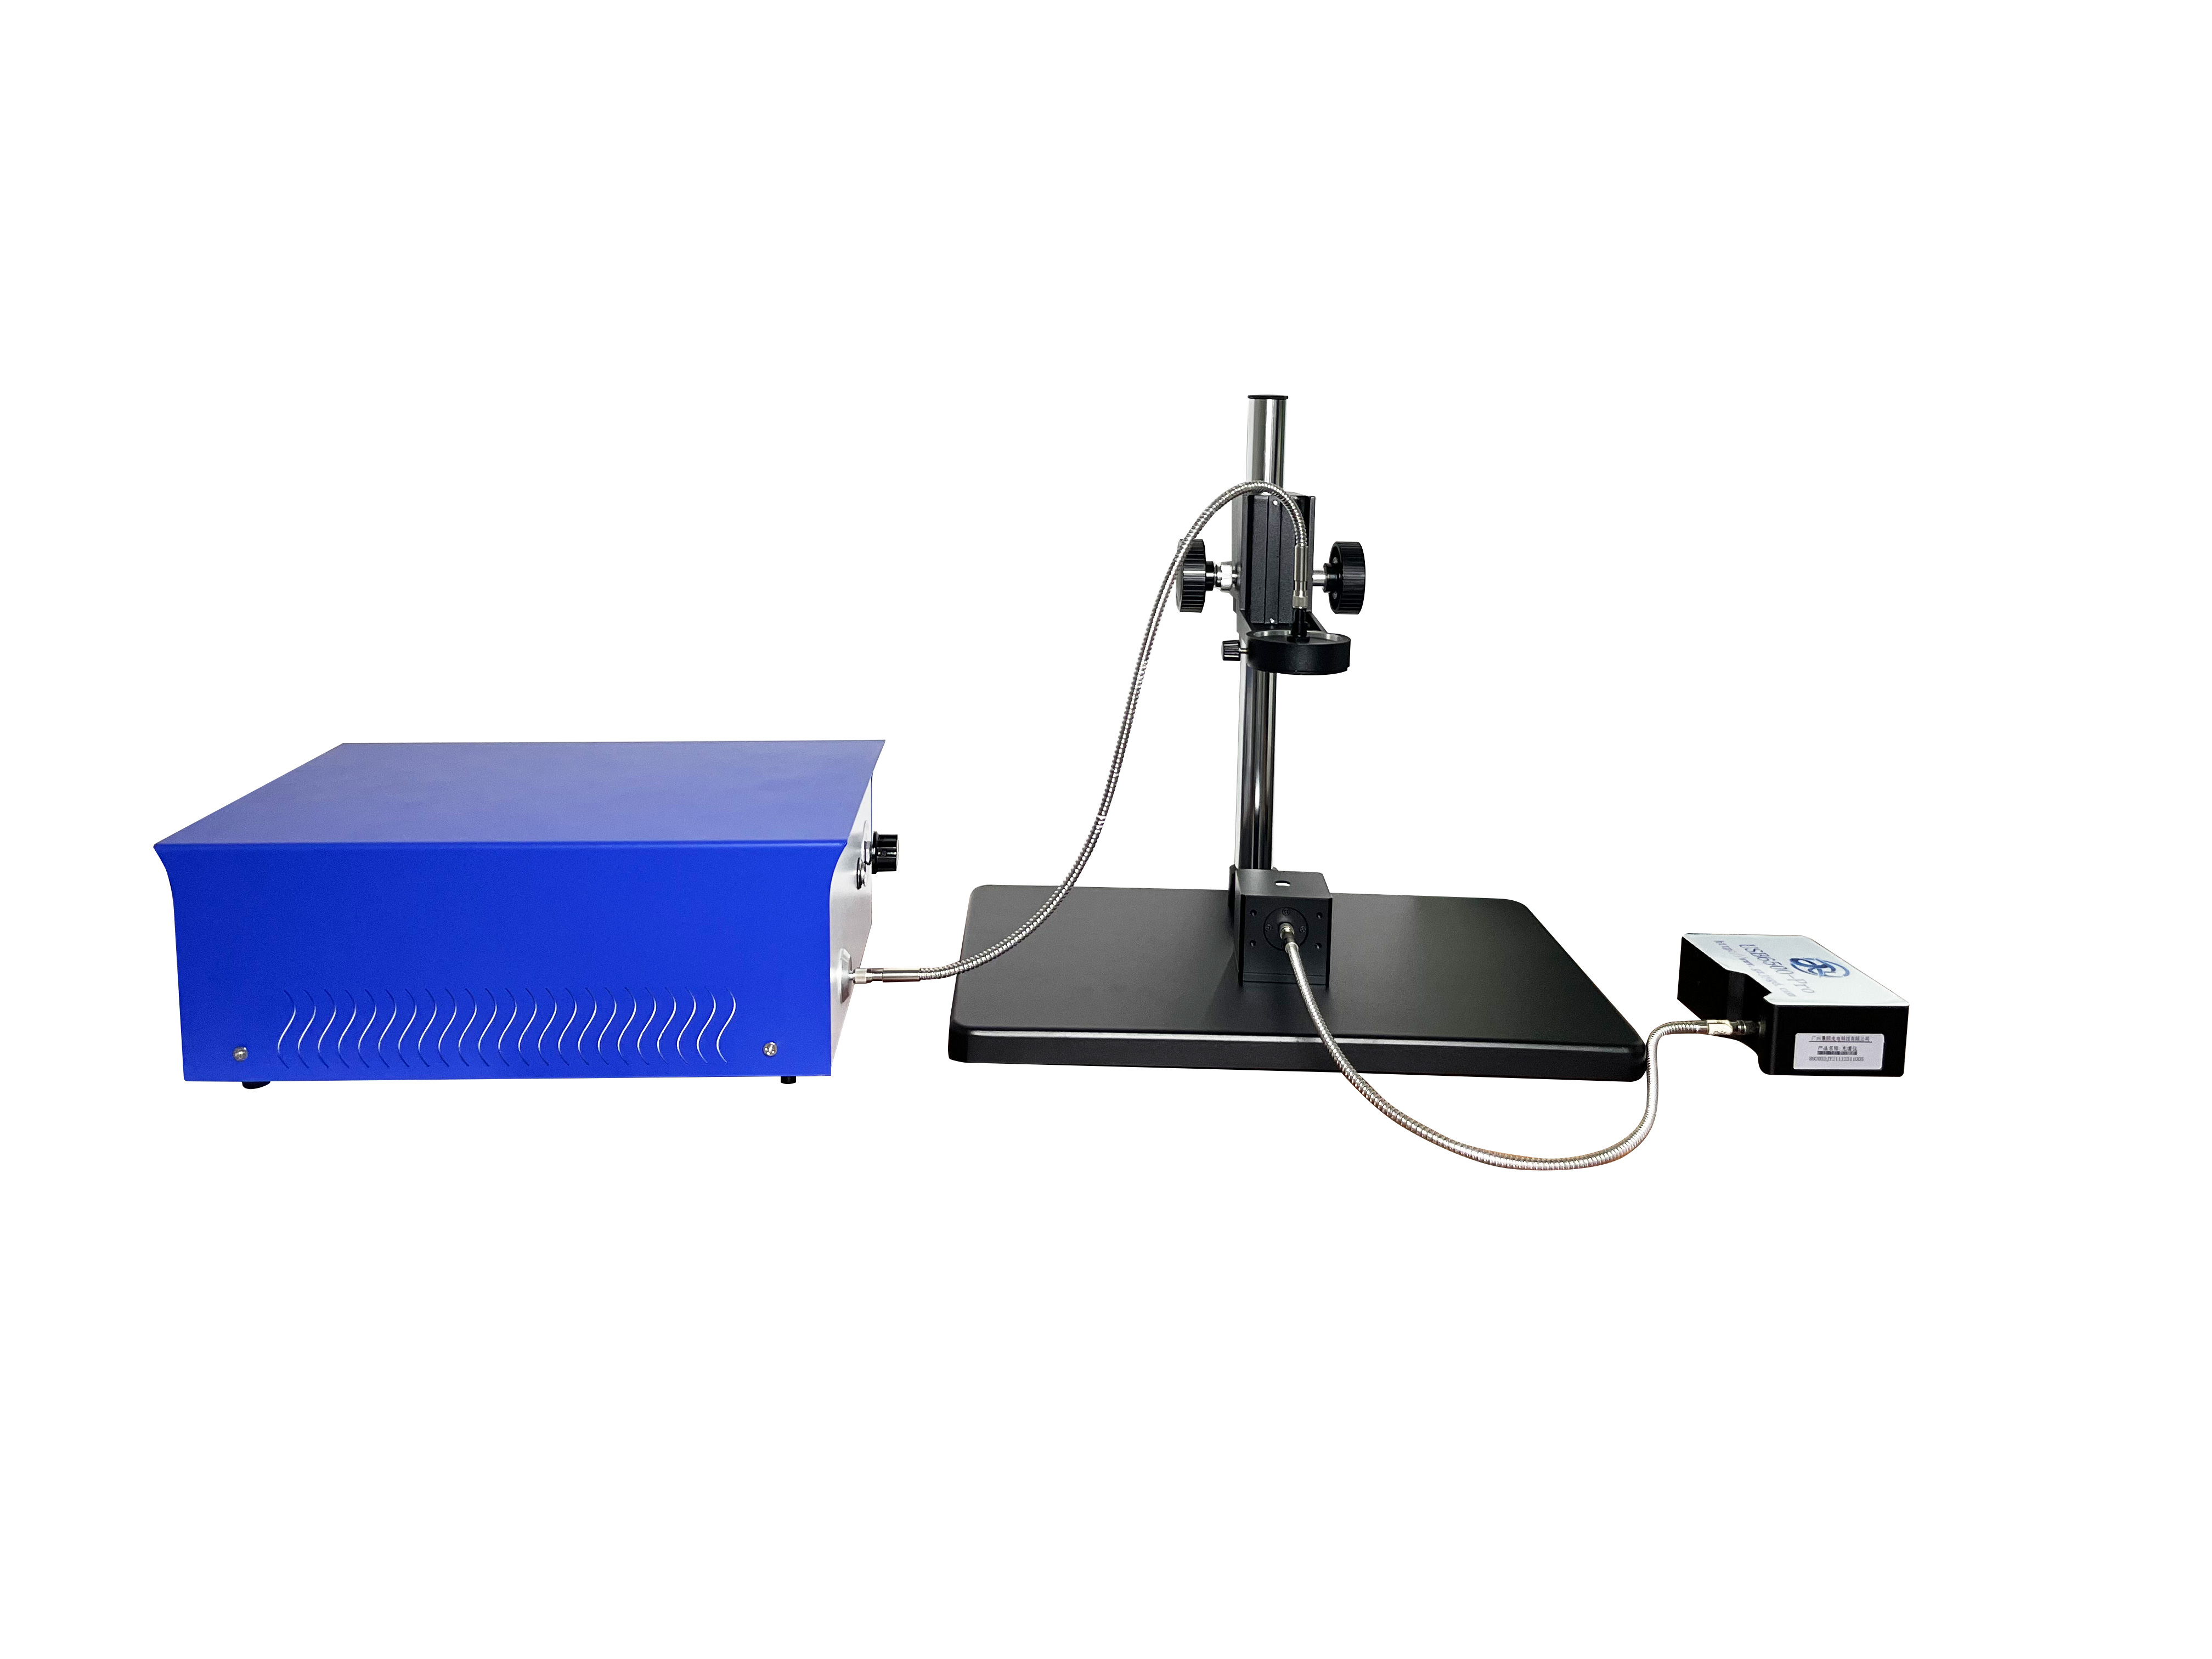
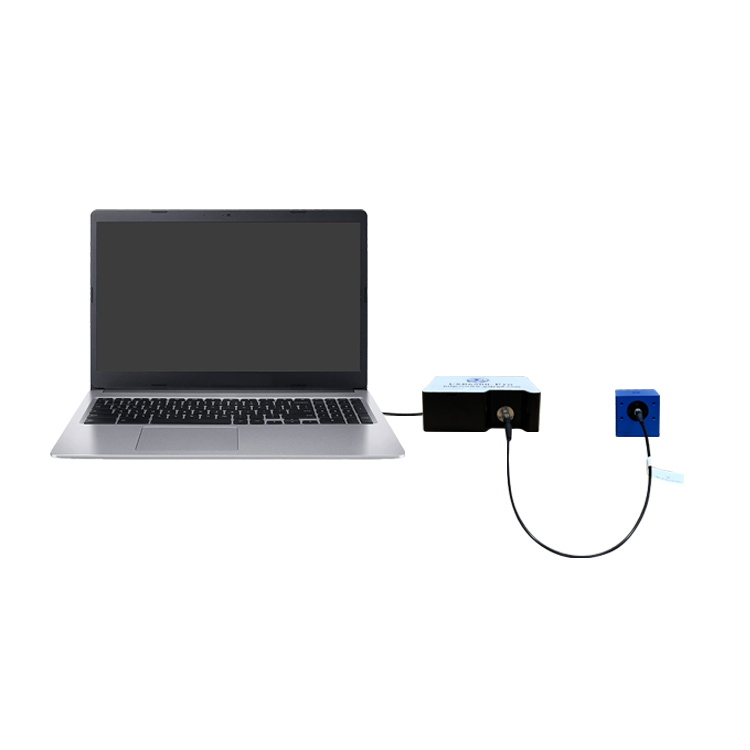
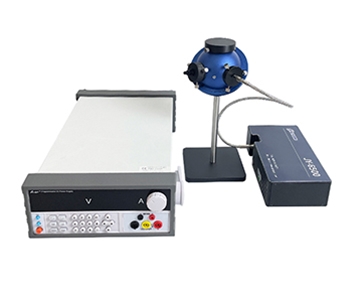
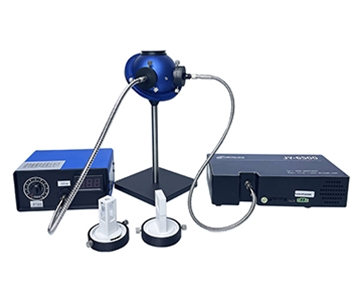
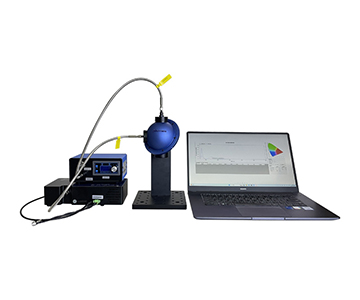
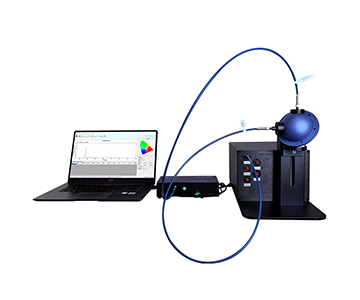
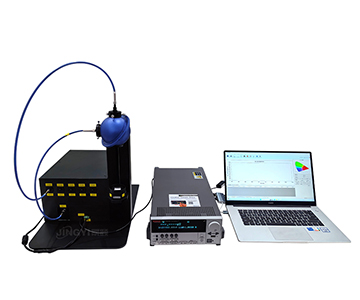
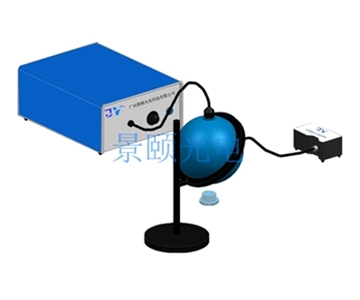
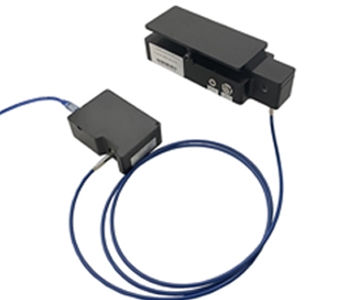
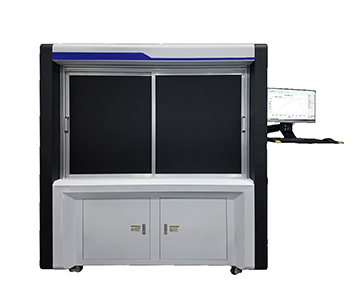
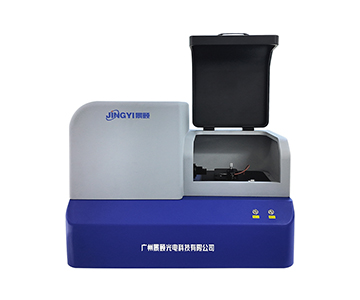
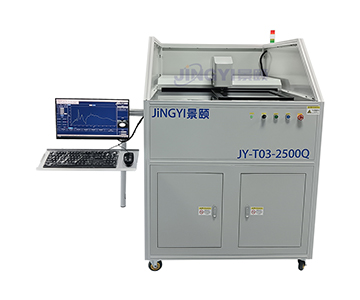
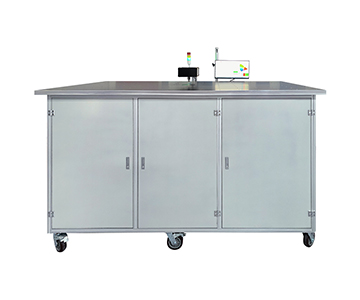
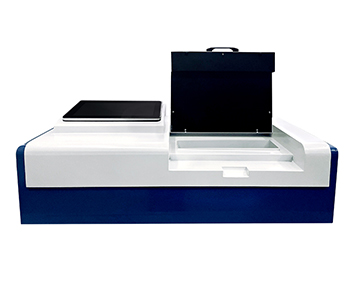
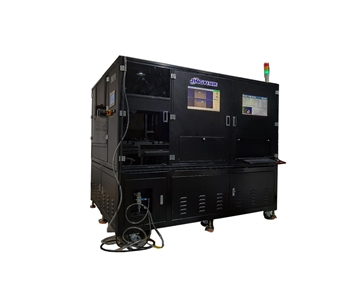
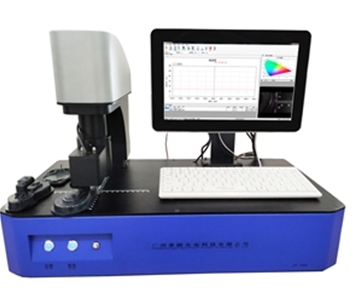
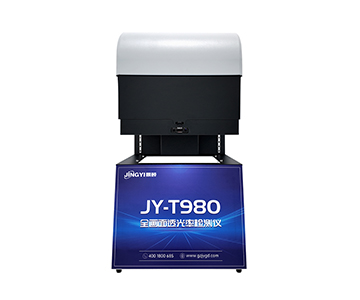
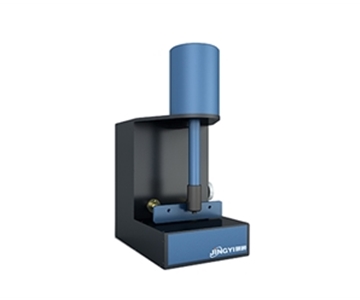
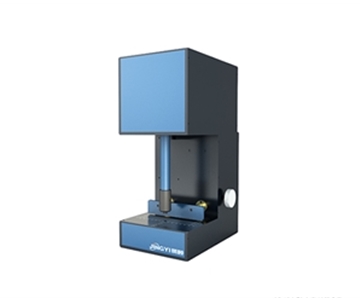
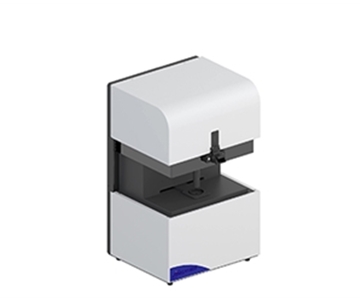
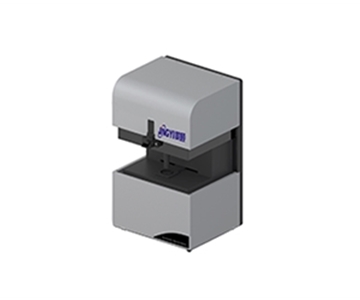
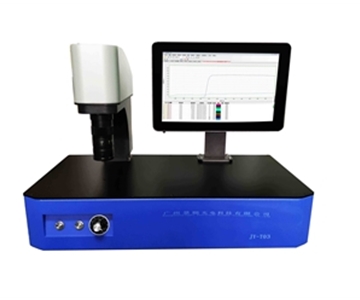
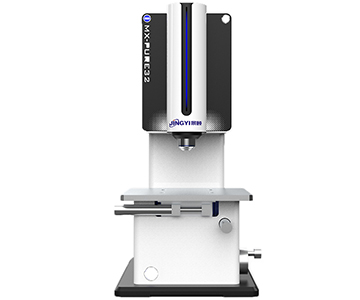
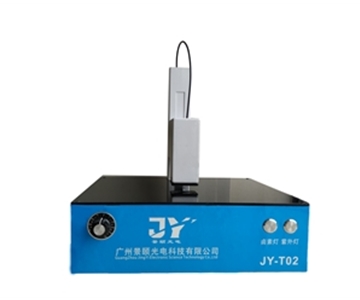
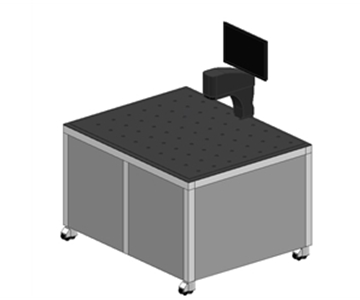
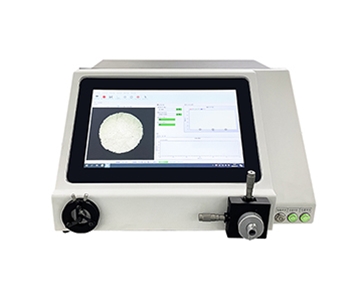
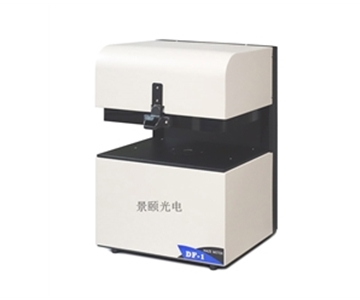
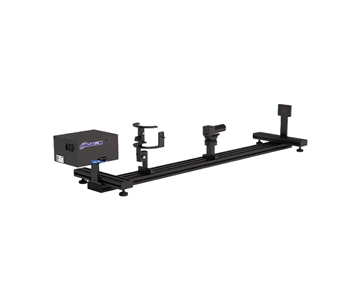
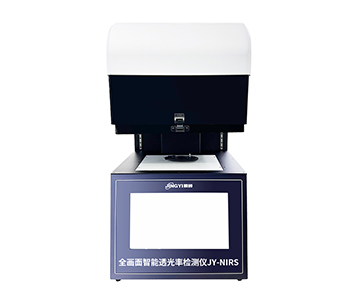
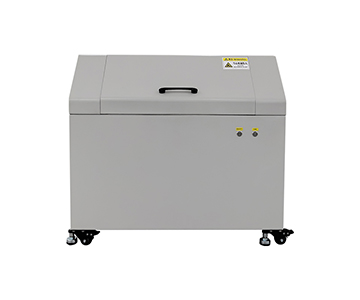
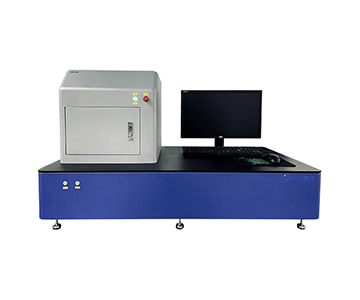
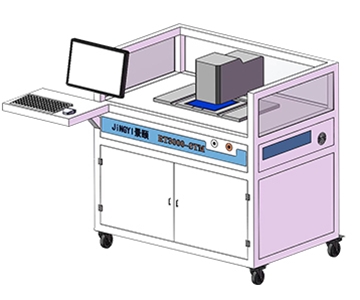
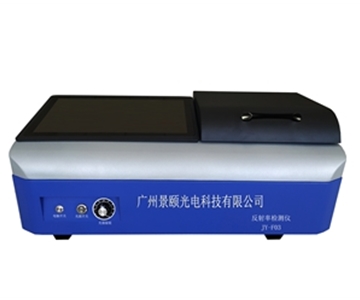
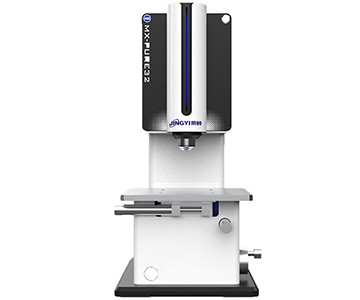
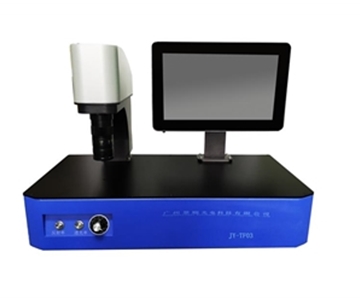
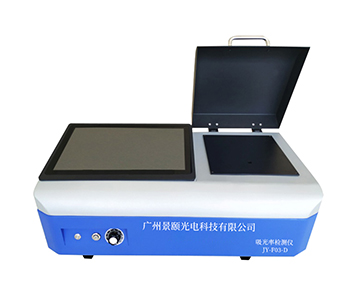
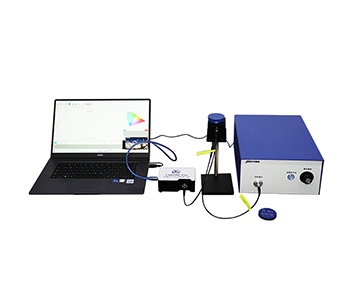
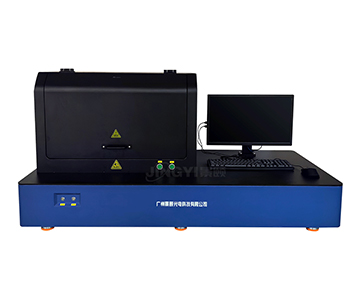
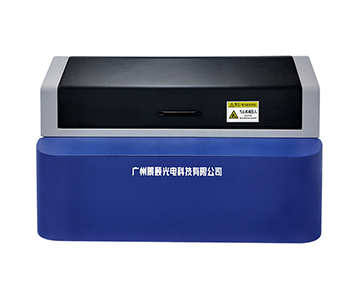
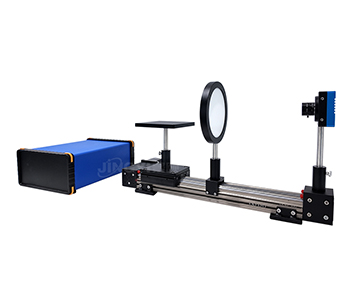
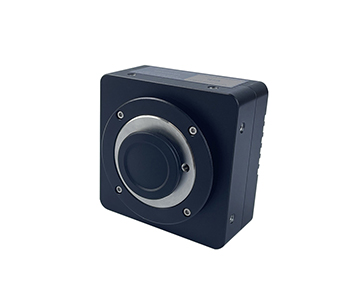
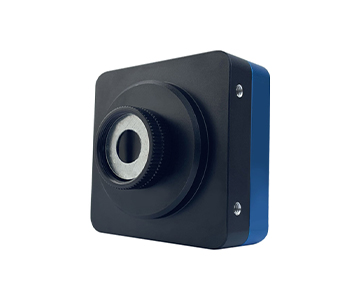
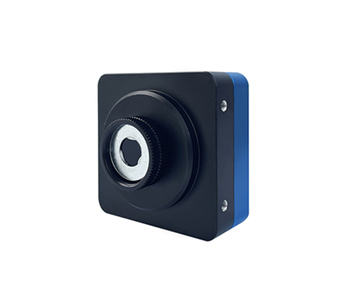
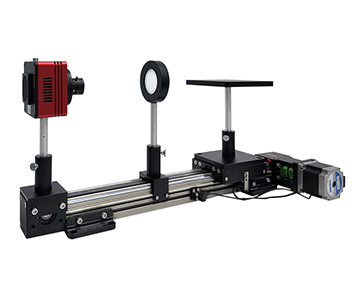
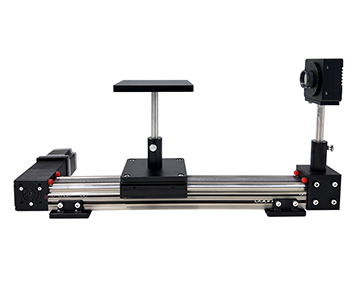
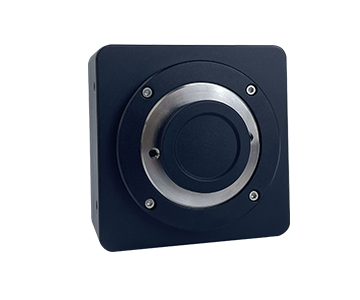
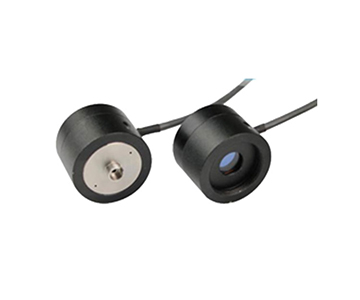
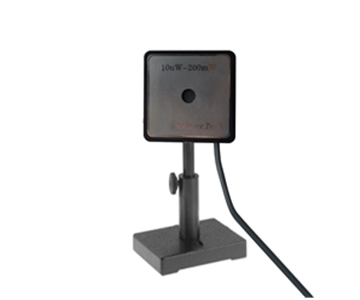
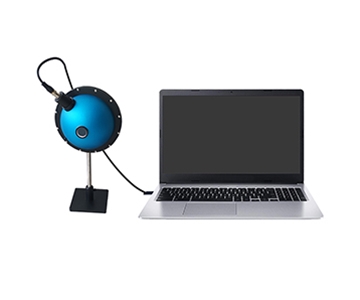
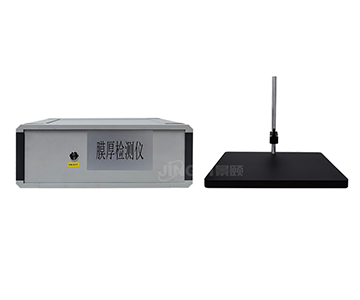
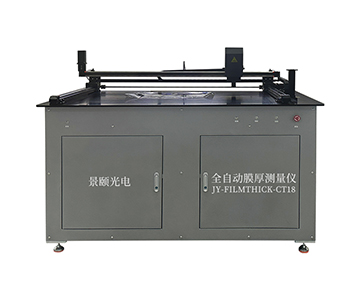
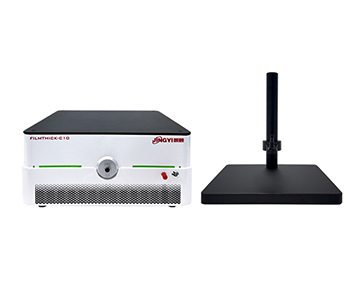
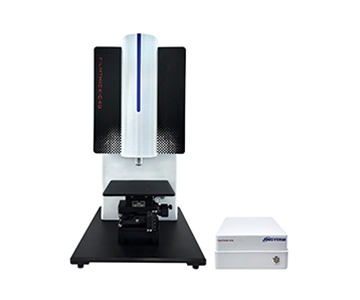
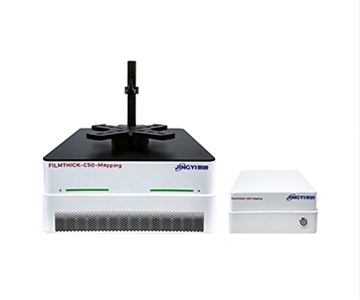
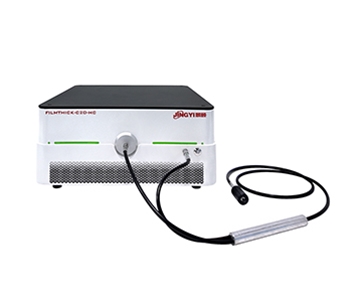
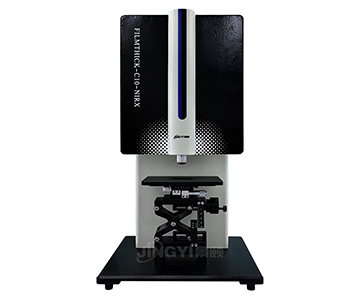
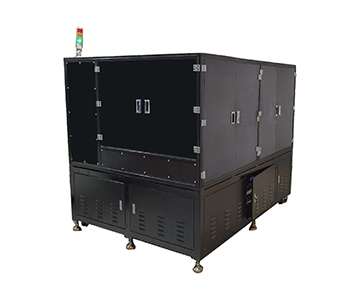
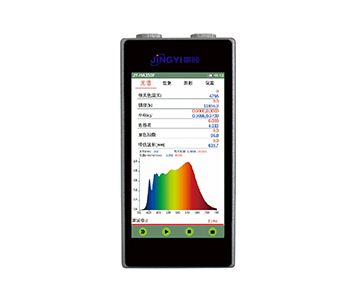
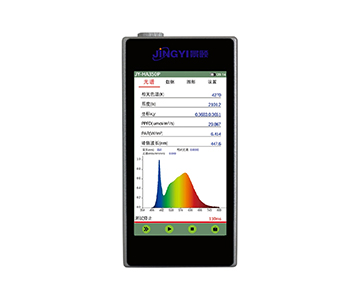
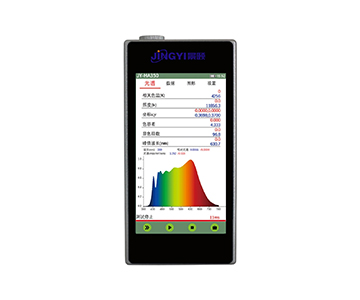
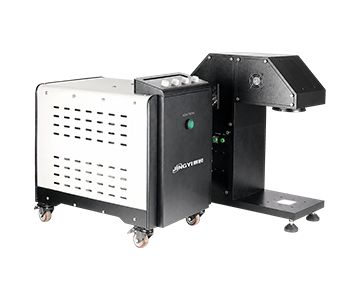
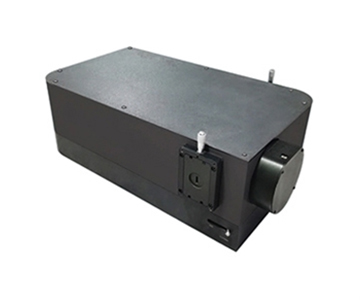
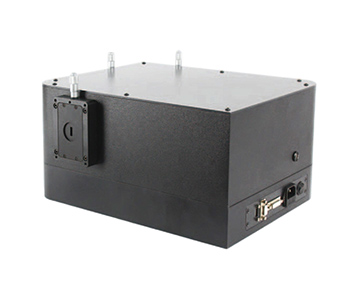
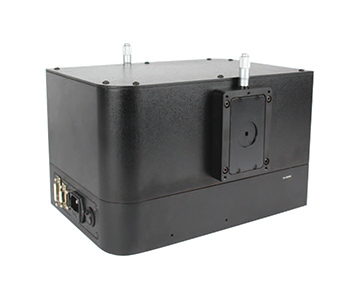
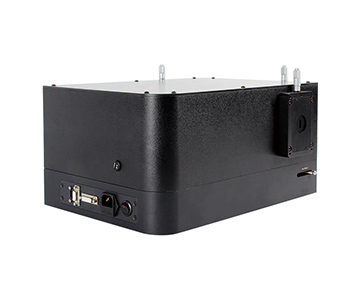
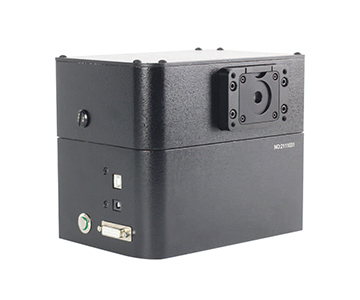
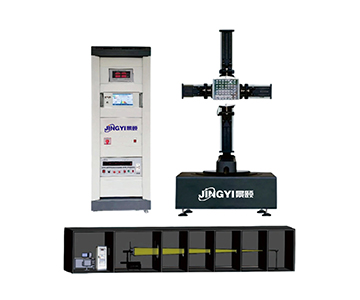
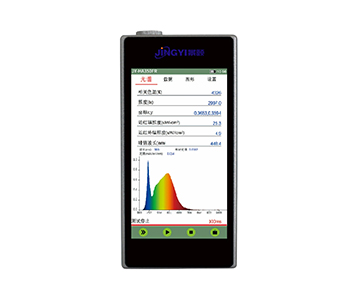
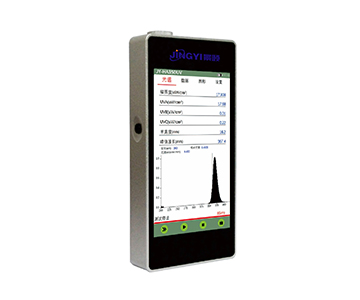
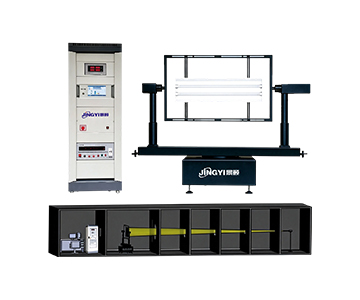
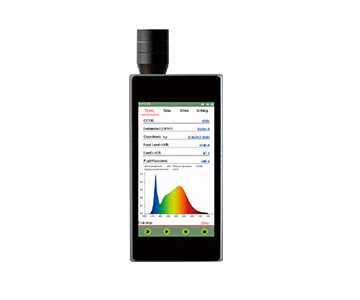
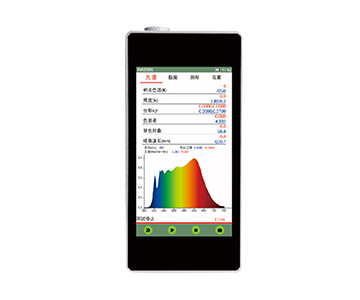
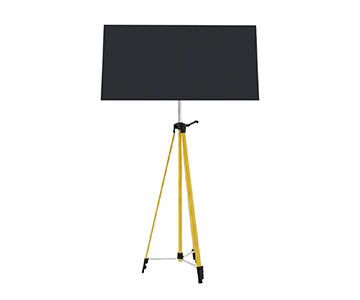
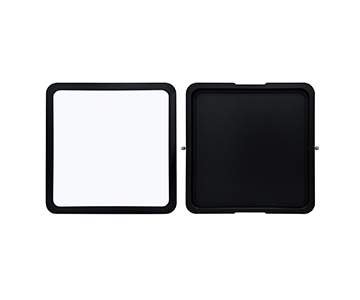
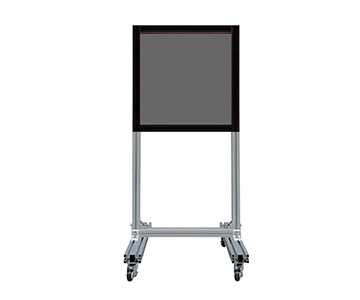
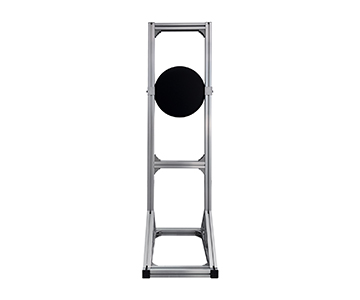
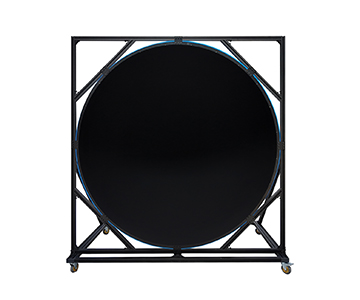
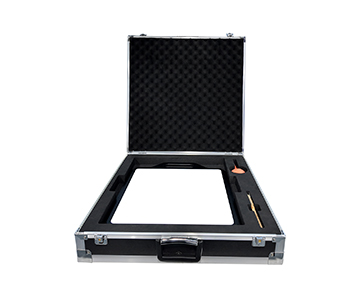
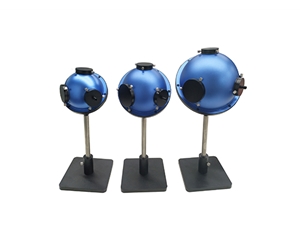
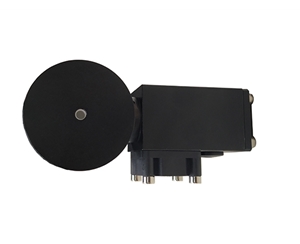
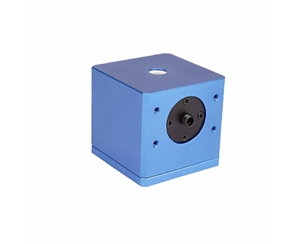
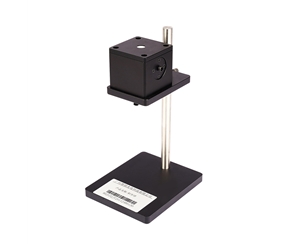
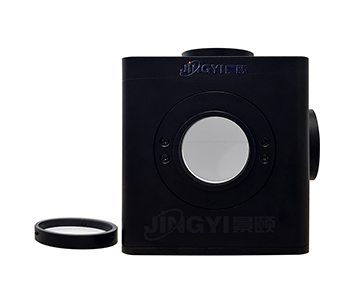
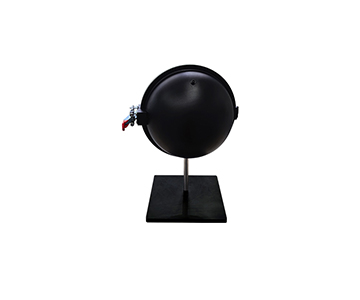
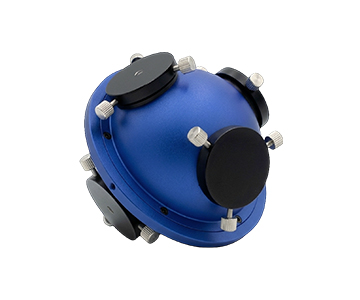
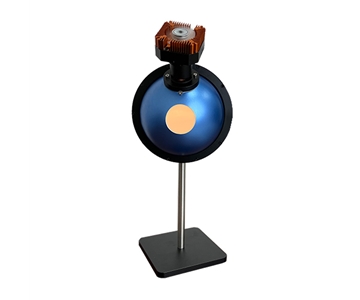
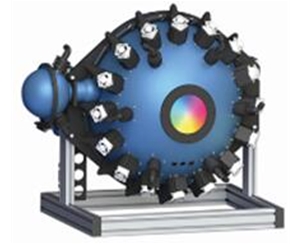
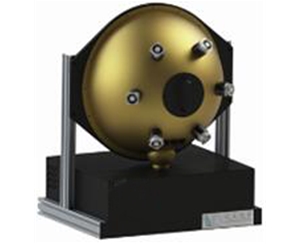
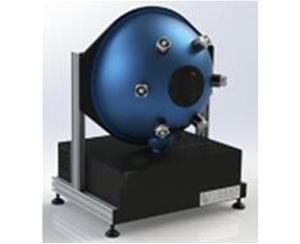
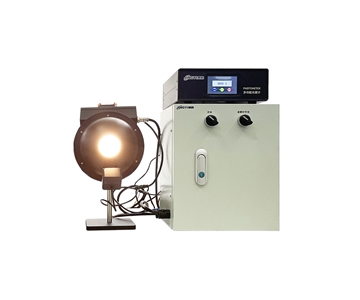
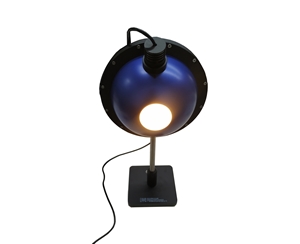
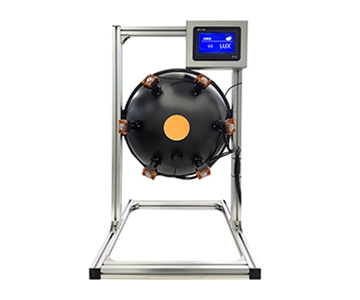
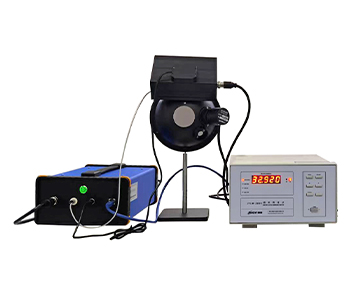
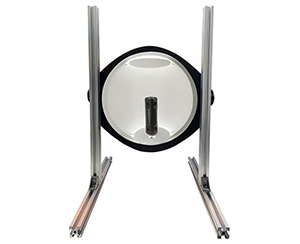
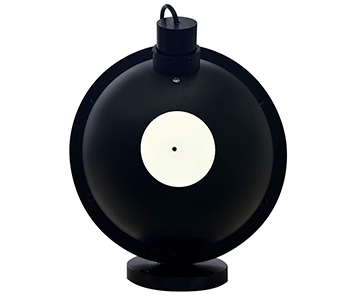
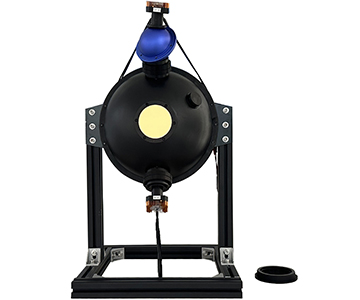
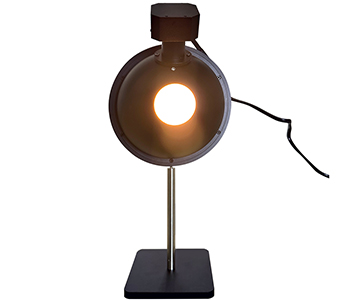
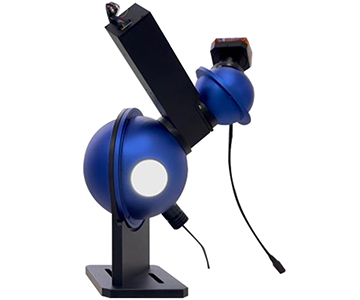
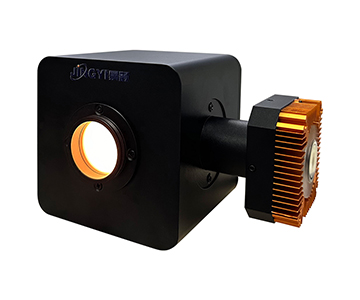
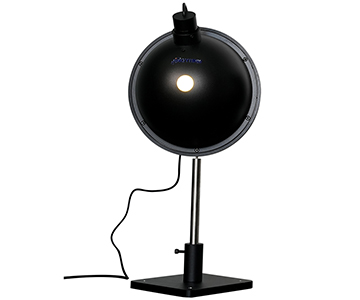
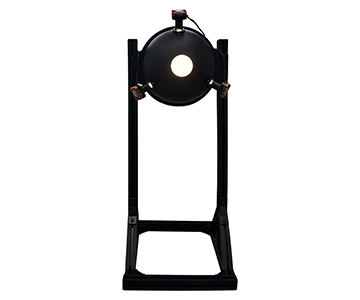
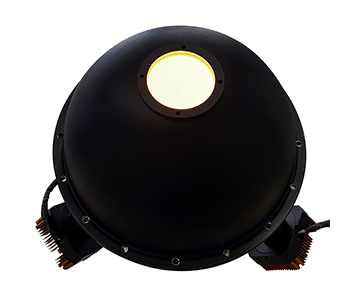
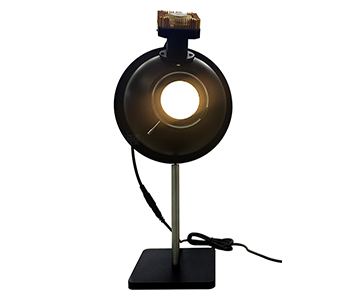
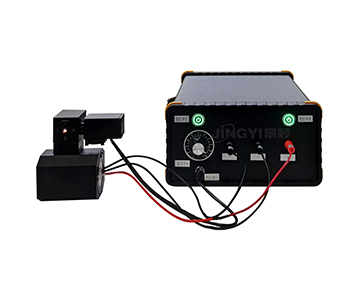
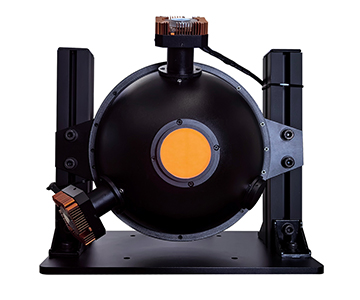
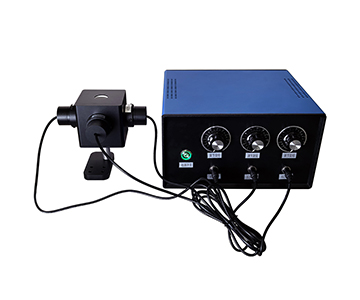
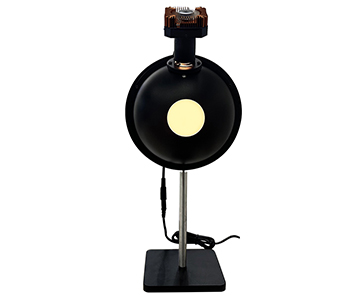
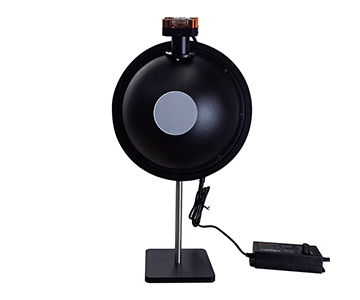
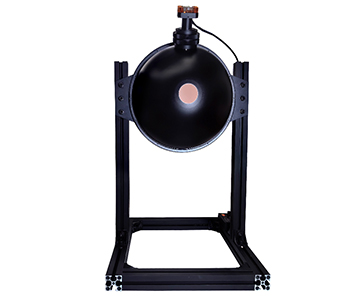
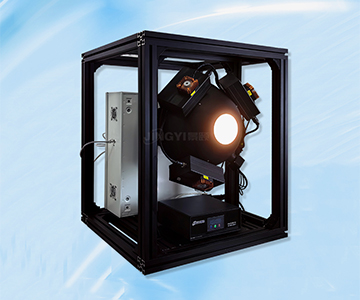
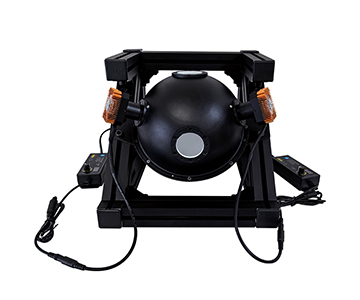
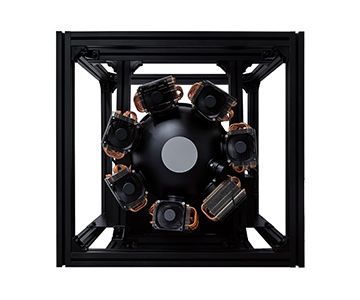
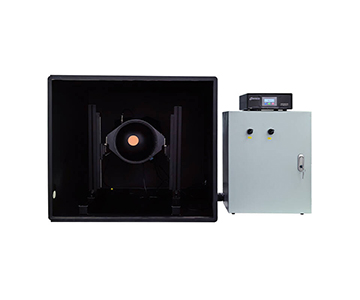
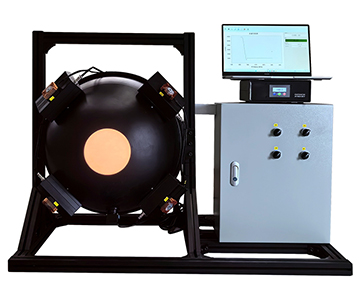
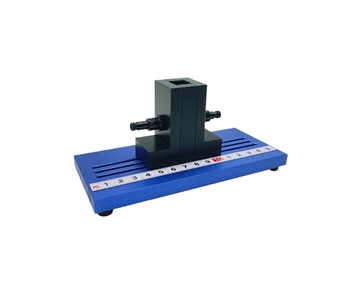
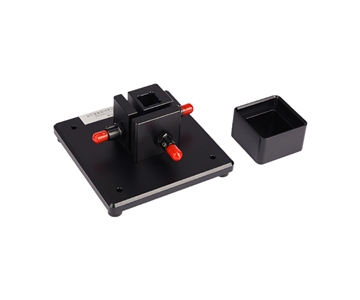
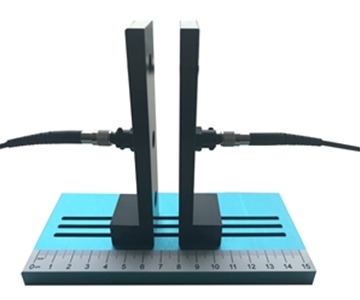
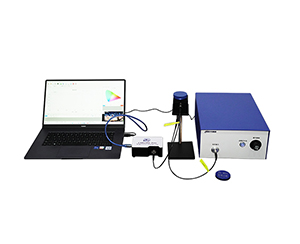
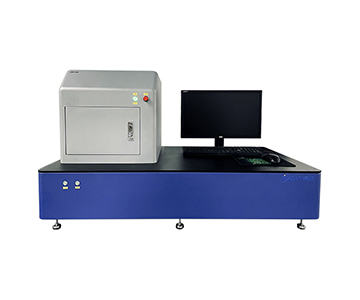
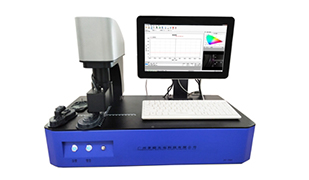
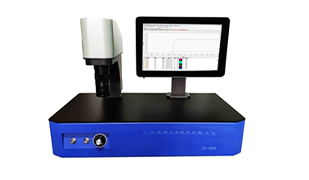
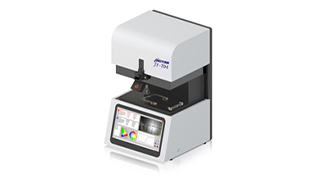
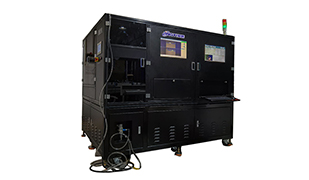
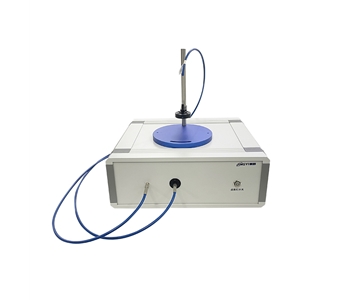
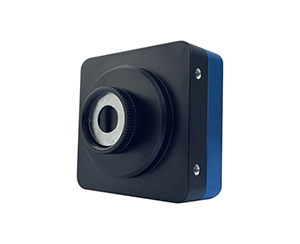
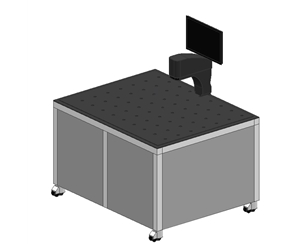
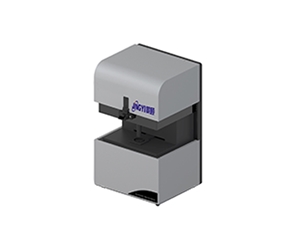
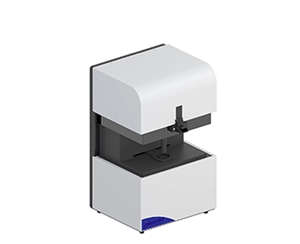
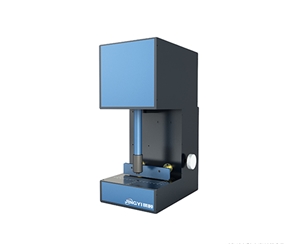
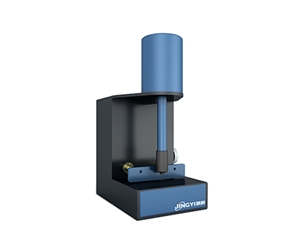
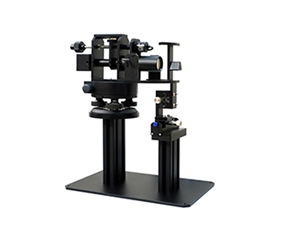
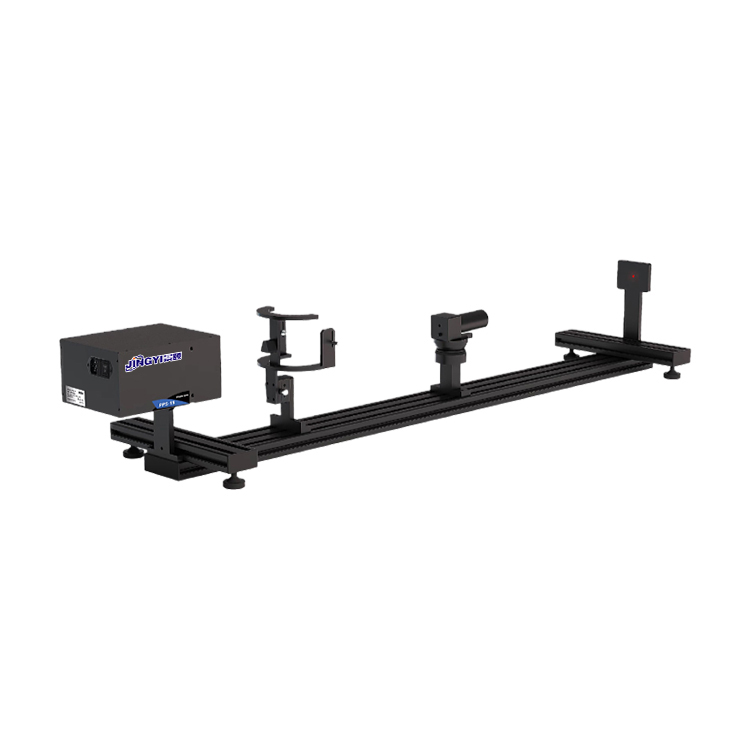
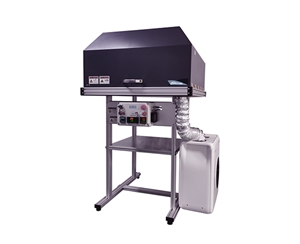
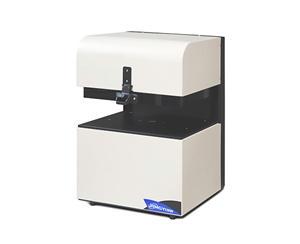
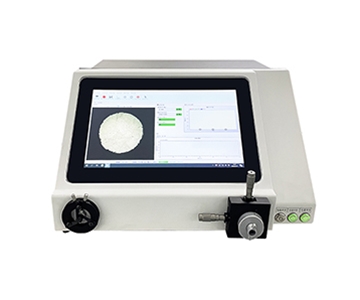
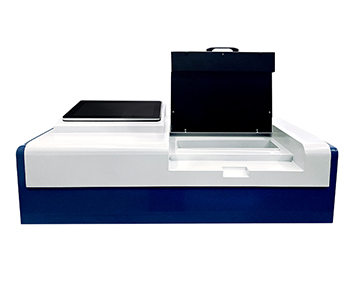
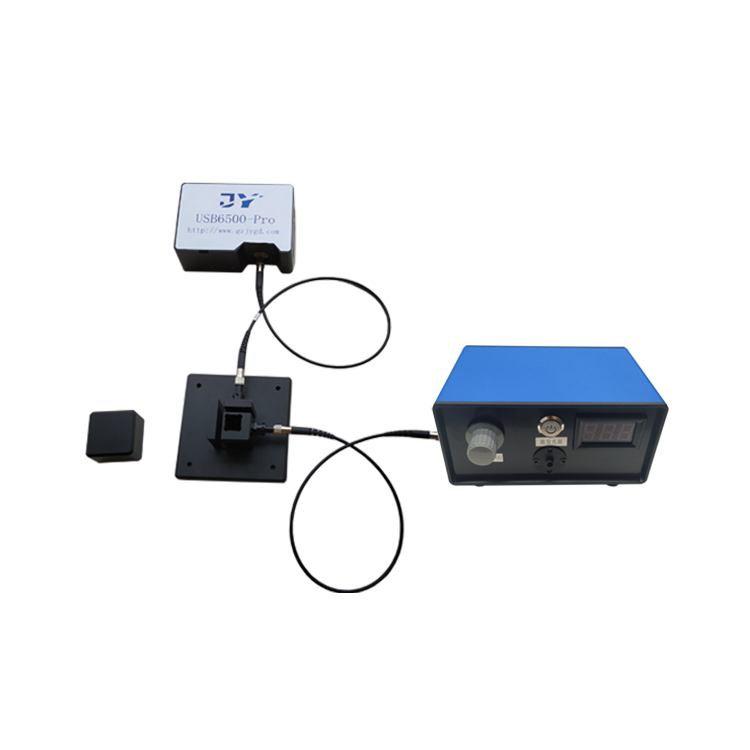
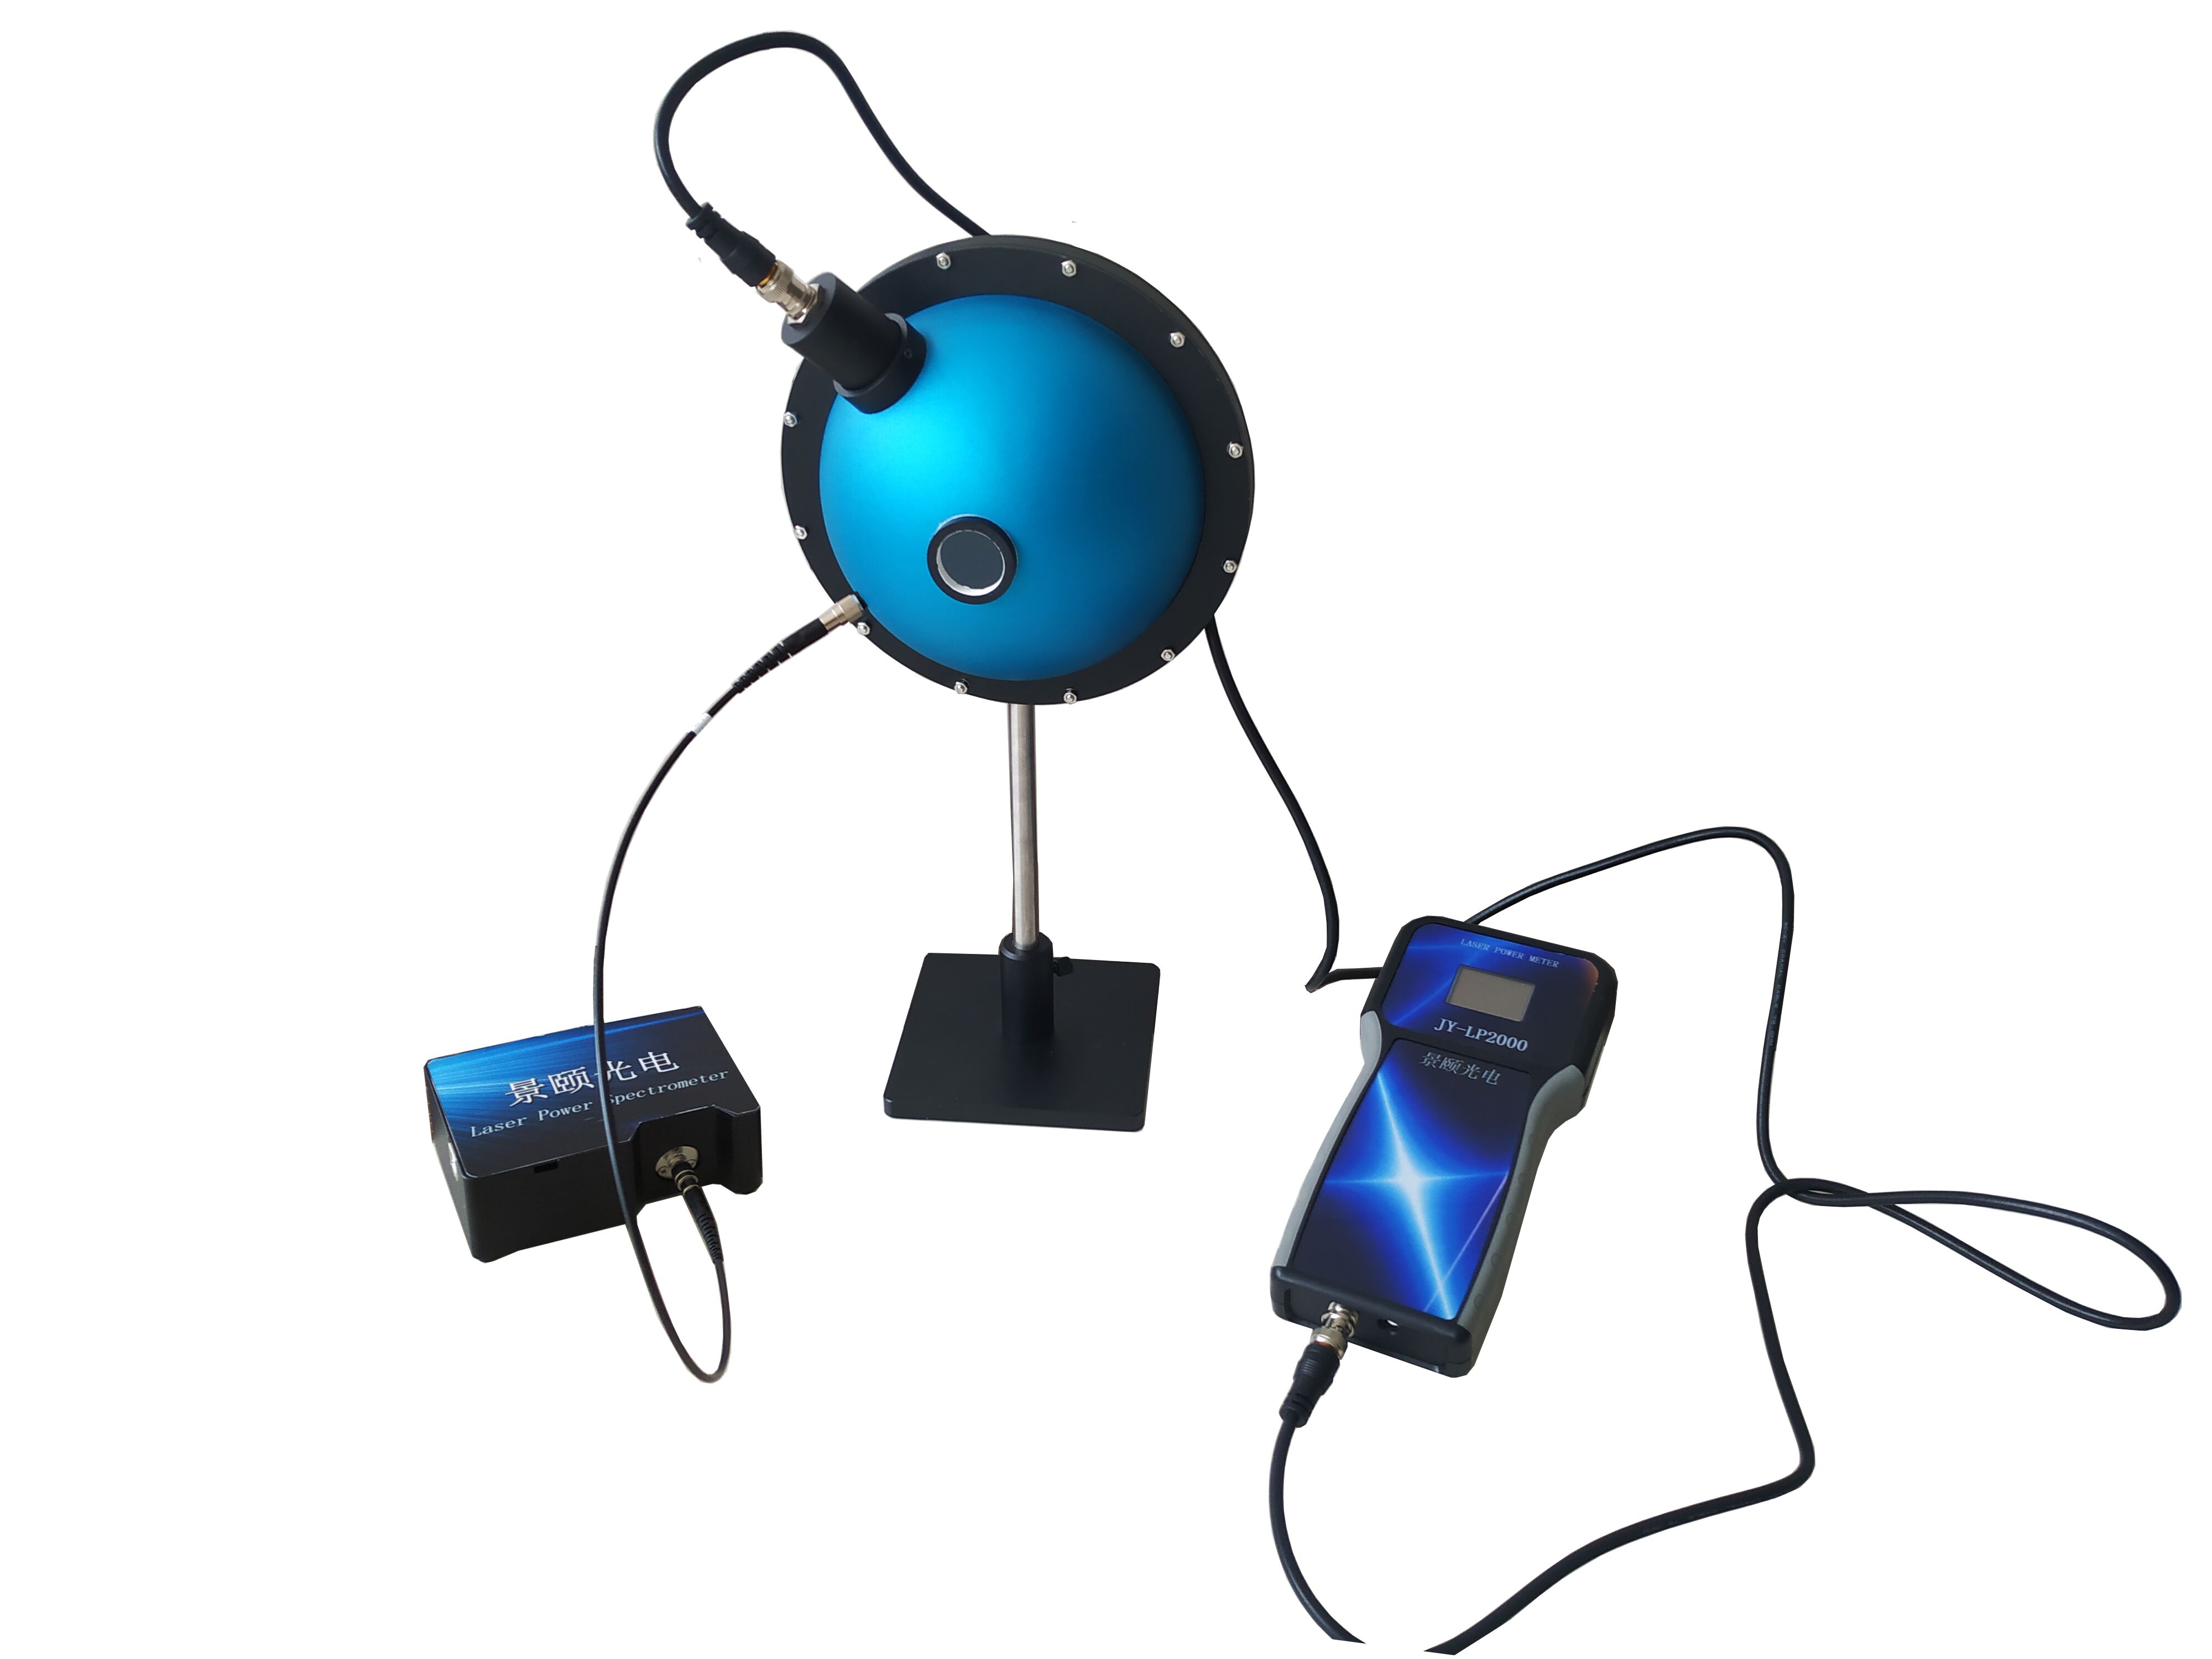
Laser beam profilers equipped with 22.4mm targets and up to 227.7fps infrared sampling provide quantified spatial, temporal, and energy distribution data for production environments. This article examines two field scenarios—a battery welding drift incident and an aerospace fiber alignment challenge—documenting how integrating 12-bit grayscale analysis with SPC reduced contour defect escape rates from 6.8% to below 1.1% while enabling traceable beam pointing stability under IP40 conditions.
The Overnight Shift Incident: Spot Drift in Battery Laser Welding
During an overnight shift at a lithium-ion battery gigafactory in the Southwest United States, a process engineer conducting routine patrols on a laser welding line for electrode tabs encountered a sudden anomaly. After switching parameters on a 1070nm welding head, the monitoring curve spiked: the beam spot diameter drifted from 0.82mm to 1.17mm, centroid jitter exceeded allowable thresholds, and the entire batch of tab weld points showed 0.37mm-level offsets. Based on shift scrap rates, the direct loss amounted to approximately $21,400 (equivalent to 152,000 RMB at prevailing exchange rates).
The root cause was not laser source power fluctuation, but uncaptured micro-distortions in the beam profile. Traditional visual inspection and static sampling failed to reconstruct transient changes. By the time the AOI station triggered an alarm, defective units had already been produced in continuous streams. What the line needed was not merely "seeing the spot," but recording spot diameter, centroid position, ellipticity, and power fluctuation on a unified, real-time timeline.
Large-spot, far-field divergence scenarios impose hard requirements on target size. When the clear aperture must cover the 22.4mm range, small-format sensor chips clip the energy boundary, causing ellipticity fitting distortion. A large target combined with 3.2μm-class pixels is the only configuration capable of resolving sub-millimeter-level contour changes within production takt times.
Afternoon in the Cleanroom: Blind Spots in Aerospace Optical Alignment
Shift the setting to an aerospace optical communications alignment bench. During an afternoon shift, the same process engineer—now working in a cleanroom on collimator tuning—faced a different contradiction: weak-signal misreading. A 0.05mm-level coupling deviation within the InGaAs detection chain caused the communication-end eye diagram margin to contract continuously.
Here, the core challenge is not large spots, but contour restoration of near-infrared weak-light spots. A 400–1700nm response range, 640×512 resolution, and 5.0μm pixel pitch mean the measurable spot lower limit reaches 50μm, while capturing transient mode defects at 227.7fps. Relying solely on conventional visible-light cameras causes infrared-band energy distributions to be omitted, rendering pseudo-color contours physically meaningless.
When fiber alignment enters sub-millimeter travel ranges, 2D and 3D energy distribution imaging ceases to be merely "visually informative"—it becomes the only basis for judging whether the mode field is symmetric. A beam position offset of 0.03mm can amplify into far-field divergence angle non-conformance. Such errors cannot be stably reproduced through manual alignment.
Why Conventional Detection Methods Fail
Battery Production Lines: Static Sampling Misses Transient Distortion
Legacy methods combine power meters with periodic photography. Power meters provide only total energy, not spatial distribution. Standard cameras constrained by target size truncate spot edges, inflating diameter measurements by 0.2–0.4mm. At 3,000 weld points per shift, the missed detection rate reached roughly 6.8%, with rework labor costs increasing by nearly 30%.
When external optical path collimation drifts due to vibration, centroid jitter hides within average power readings. Without frame-by-frame pseudo-color overlays and Gaussian curve cross-referencing, engineers cannot see the danger signal of "shape changed but total power remained constant."
Optical Comms Alignment: Bandwidth Mismatch Distorts Contours
Traditional visible-light inspection equipment exhibits weak near-IR response and is completely blind in 8–14μm mid-IR scenarios. Mode defects, thermal lensing, and asymmetric divergence in infrared lasers are filtered out as "noise" under incorrect wavelength bands. Mid-IR configurations using vanadium oxide uncooled detectors, with thermal sensitivity below 35mK, are required to resolve the energy concentration zones of 170μm-class spots.
In automotive LiDAR external optical path verification, reference to the T/CITS 231—2025 standard (Technical Requirements for Automotive LiDAR) provides a framework for beam pointing and alignment consistency. Frame-by-frame recording of beam pointing stability and divergence angle serves as empirical data support for the technical dimensions outlined in this standard.
Measured Improvements After System A Deployment
Welding Production Line: From Alarm to Prediction
After integrating a large-aperture CMOS test system (System A), the production line fed spot diameter, ellipticity, and centroid coordinates into SPC. Exposure supports manual, automatic, and one-click modes, with 12-bit grayscale preserving energy hierarchy. Replacing manual sampling every 10 minutes with continuous 23.3fps monitoring allowed centroid drift to be intercepted 1.2 seconds before out-of-tolerance conditions occurred.
The measurable spot range of 32μm–22.4mm covers everything from fine mode fields to large-divergence far fields. Standard attenuation filters support high-power incidence, preventing saturation. At the yield level, contour non-conformance missed detection dropped from 6.8% to within 1.1%, while rework hours decreased by approximately 27%.
Optical Comms and IR Alignment: From "Close Enough" to Traceable
The near-IR configuration captures at 227.7fps @ 640×512, while the mid-IR configuration synchronizes thermal distribution at 50fps. Pass/Fail thresholds bind to Gaussian fitting degrees, eliminating subjective judgment on mode defects. In fiber alignment coupling analysis, beam position resolution enters the micrometer level, transforming coupling loss evaluation from "feel" to curve comparison.
The shared outcome across both scenarios: test reports exportable as PDFs, with raw frames fully traceable. Production debugging and laboratory calibration now operate under a unified criterion, breaking down data silos.
Cross-Industry Common Denominators
Beam Quality Is Not Total Power
Semiconductor, new energy, and aerospace industries appear vastly different, yet accident root causes converge: an exclusive focus on power while ignoring spatial distribution. Spot diameter, centroid, ellipticity, and divergence angle are four projections of the same physical quantity. Omitting any one leads to misjudgment.
When a test device simultaneously outputs 2D and 3D energy distributions, engineers observe "how energy travels" rather than merely "how much energy exists." This distinction separates beam quality analyzers from traditional laser attenuator configurations.
Protection and Interface Determine Production-Line Viability
Laboratory equipment is vulnerable to dust, vibration, and thermal drift. IP40 protection, 0–50°C operating temperature, and Gigabit Ethernet or USB 3.0 interfaces mean the device can reside on the production floor permanently rather than being returned to the metrology room daily. From a protection-class perspective, reliability is not an add-on—it is the prerequisite for data comparability.
Critical Conditions for Production Deployment
Attenuation Chain Must Match Power
Incident power can reach kilowatt levels; striking the target directly causes saturation or damage. Attenuation filter combinations must be selected per wavelength to ensure peak grayscale falls within the upper-middle range of the 12-bit effective interval. Configurations supporting up to 1000W input power are a prerequisite for long-term online operation.
Target Size Must Exceed Far-Field Spot Projection
During far-field measurement, divergence angles magnify the spot. If the sensor clear aperture is insufficient, edge energy is clipped, systematically underestimating ellipticity and divergence angle calculations. The value of mid-to-large target models lies not in "seeing bigger," but in "measuring completely."
Software Criteria Must Be Written Into Process Documentation
Pass/Fail thresholds, Gaussian fitting tolerances, and centroid drift windows must bind to process specifications rather than being adjusted per operator. While graphical interfaces are intuitive, standards must be locked down; otherwise, data across shifts becomes incomparable.
Applicability Boundaries and Practical Constraints
Large targets and high frame rates inherently increase data volume. At 7008×7000-class resolution, real-time pseudo-color rendering demands host computing power, requiring edge industrial PCs to reserve bandwidth.
Furthermore, a beam profiler addresses the "beam itself" and does not replace optical component defect detection. When lens contamination, coating stress, or mechanical assembly errors coexist, cross-validation with interferometric and reflectivity methods is required. A single instrument cannot cover the entire causal chain.
Frequently Asked Questions
Q1: How do I select between visible and near-infrared models?
Selection depends on the laser wavelength under test. For 300–1100nm, use the CMOS visible-light configuration. For weak infrared signals in the 400–1700nm range, select the InGaAs configuration. Bandwidth mismatch causes energy distribution loss that cannot be remedied by simply adding filters.
Q2: Can spots smaller than 0.1mm be measured accurately?
Yes. The near-IR configuration offers a 50μm lower limit; mid-IR starts at 170μm. However, pixel size and magnification must be matched to avoid fitting distortion when a single spot occupies only a few pixels.
Q3: Does production-line vibration affect centroid calculations?
It can. The system supports soft and hard trigger synchronization; connecting trigger signals to welding or scanning cadences is recommended. Frame-by-frame centroid statistics distinguish genuine drift from vibration noise.
Q4: Which specifications should I verify most carefully during procurement?
Verify actual clear aperture, physical pixel size, measurable spot range limits, bit depth, and frame rate. Then confirm whether the attenuation filter configuration covers your peak power—do not rely solely on nominal wavelength ratings.
Q5: How can I independently verify long-term equipment stability?
Use calibrated attenuation filters and a reference beam source for weekly back-testing. Export historical centroid and ellipticity curves to evaluate repeatability dispersion under identical conditions, without relying on vendor-supplied reports.
Conclusion
From transient drift in battery welding to weak-signal alignment in aerospace optical communications, the value of a laser spot detection instrument lies not in "capturing a clear image," but in simultaneously quantifying the spatial, temporal, and energy dimensions of the beam. Large target size, broad wavelength coverage, real-time 2D/3D energy distribution, and stable protection form the foundational conditions for reproducible in-line monitoring.
For detailed technical documentation on laser beam profiling systems, search "Jingyi Optoelectronics + beam profiler" or visit the technical library.
About This Guide
Data Sources
: Uploaded product technical documentation, T/CITS 231—2025 public text, industrial laser production line public test practices.
Author
: Cai Xiaodong, Senior Application Engineer, Jingyi Optoelectronics, 8 years in optical inspection and machine vision content creation.
Disclosure
: Jingyi Optoelectronics manufactures laser beam profiling equipment. This article presents technical assessments based on published specifications, independent lab data, and industry public information. No compensation was received from third-party brands mentioned.
Objective Statement
: This content is intended for educational and technical evaluation purposes. Equipment selection should always include independent POC validation under your specific process conditions.
Last Updated
: November 2026